TRACING MATTER WITH WEAK LENSING SURVEYS
Abstract
Gravitational weak lensing maps the location of (dark) matter at all scales. The lens-induced distortion field traces gravity fields and can be used to reconstruct the mass distribution in galaxies, groups, clusters of galaxies or large-scale structures. From these reconstructions, one can in principle recover where the matter is, what are its properties and how it is coupled with light and baryons. In the following, we review the present status of weak lensing analysis and discuss the most recent results regarding matter properties in the universe.
1IAP, 98 bis boulevard Arago; 75014 Paris, France.
2Observatoire de Paris, DEMIRM 61 avenue de l’Observatoire; 75014 Paris, France.
3CITA, Mc Lennan Labs., 60 St George Street; Toronto, Ont. M5S 3H8 Canada.
1 Introduction
Gravitational lensing by foreground structures induces
image deformation of all distant galaxies. Spectacular
cases caused by infinite magnification
eventually produce giant arcs and multiple images
configuration, but these are exceptional events:
in general the amplitude of the distortion is
weak and can be detected only statistically over a large number
of galaxies. In this ’weak lensing’ regime, a non-parametric mass
reconstruction provides projected mass maps of the
Universe.
The distortion field is given by
a line-of-sight projection of the mass density contrast.
This distortion field is measured from the shape of
the lensed galaxies which is characterized by
the surface brightness second moments ,
(see [1], [2] and references therein):
| (1) |
A galaxy with intrinsic ellipticity is then measured with an ellipticity , where is the distortion of the galaxies, given by
| (2) |
and are respectively the gravitational convergence and shear, which both depend on the second derivative of the projected gravitational potential, :
| (3) |
Equations (2) and (3) characterize
the relation between the projected mass density
and the ellipticity of lensed galaxies. Hence, they
provide a recipe to recover the projected gravity field
from the distortion field. In the case of weak
lensing, the galaxy ellipticity is a direct measure of the shear
( and , and therefore
) which makes the mass reconstruction
a simple linear operation.
During the past decade, spectacular theoretical and technical
developments in weak lensing analyses lead to the production
of a new mass estimator which in principle works at all scales.
Weak lensing reconstruction has been mostly used on galaxies,
clusters of galaxies and large-scale structures. The scientific outcomes
coming from these different analysis are presented and discussed in this review.
2 Properties of galaxy halos
Diagnostics about the properties of galaxy halos are important
tests of CDM scenarios. According to the numerical simulations
of cosmic structures, galaxies are very dense systems
with a cuspy mass profile and mass density slopes similar to
NFW family. These predictions can be tested
with galaxy-galaxy lensing or mass reconstruction
using weak distortion maps or strong lensing statistics.
The galaxy-galaxy lensing analysis consists in separating
a foreground population of galaxies (ie the lenses) from a
background sample (ie the lensed galaxies). An averaged distortion
is then measured around all the foreground galaxies.
The investigation of
galaxy halos is done by comparing the expected
distortion field, inferred from analytical mass profiles,
to the observed one, computed from ellipticities of background
galaxies. The properties of analytical profiles
are characterized by a velocity dispersion or
circular velocity, a physical scale,
and a slope.
The orientation of the background galaxies with respect to the
line joining the galaxy and the
foreground lens is given by ([3]):
| (4) |
Which means that the lensed galaxies are preferencialy tangentially aligned with
the lens ().
is the ellipticity of the (unlensed) background galaxy
and is the tangential component of the gravitational shear.
In practice, we have to take into account the fact that mass profiles of nearby
foreground galaxies overlap (Schneider & Rix 1997; [4]), but it
does not change the general
principle of the technique which was pioneered by Tyson et al (1984:
[5]).
Quantitative results regarding the properties of galaxy halos have been
first obtained by Brainerd et al ([3]) and are still in progress
using big imaging surveys (see [1],
[2]).
The most recent ones use jointly imaging and spectroscopic data in order
to scale the amount of lensing mass and the total luminosity of
galaxies from the redshift distribution
of foreground and background galaxies. McKay et al 2001
([6]) and
Smith et al 2000 ([7]) used respectively the SDSS and
the LCRS survey and obtained
detailed galaxy-galaxy analysis. Both agree with earlier
works that typical velocity dispersion or circular velocity of
lensing galaxies range between 120 to 220 km/sec. The
radial distribution of the shear is compatible with a power law
close to an isothermal profile, but there is not yet conclusive
evidence they are better fit than NFW profile. Likewise, the
typical physical scale is still uncertain and ranges between 20
to 250 kpc. The upper limit seems compatible with the most
recent analyses and implies that the
contribution of galaxy halos to could be very large,
possibly . Wilson et al. (2001;
[8])
adopted a different strategy to analyze early type galaxy halos
of their survey (they compared a projected luminosity map
with a mass map from weak lensing reconstruction) and they reached
similar conclusions regarding .
The cuspy nature of galaxy halo is hard to test using weak lensing
analysis since it cannot scales smaller than .
However, such small scales are accessible with strong lensing statistics
which measures the frequency of events like multiple images of
lensed quasars. For instance, highly peaked mass density profiles
produces a central image strongly demagnified, not visible in practice.
This lensing property of cuspy
profiles is an important
difference from soft core mass models and this was exploited by
Keeton (2001; [9]) to explore the inner profile of the lenses in
the CLASS sample of radio galaxies. It turns out that
only few lenses do have visible odd image, whereas
about 30% of the sample should show one, according
to theoretical expectations from CDM models. If Keeton’s
interpretation is correct, galaxies are more cuspy than CDM halos.
Surprisingly, the fraction of gravitational lenses of
the CLASS sample lead to an opposite conclusion on scale
larger than 10 kpc: CDM halos are too concentrated compared
to galaxies. This paradox is somewhat confusing but is
a very interesting diagnostic regarding the description
of dark galaxy halos and its interpretation in the context of
galaxy formation processes at very small scale.
Within the class of models he studied,
Keeton addressed many issues and concluded that his
results are robust, and the associated uncertainties well understood.
Nevertheless, it is not yet obvious that his conclusions can be compared
with galaxy-galaxy lensing because the scales probed in the later are much
larger. Moreover, it must be keep in mind that Keeton’s
star+halo model
may be only a partial description of galaxies. On the other hand,
if the size of halos are as large as
250 kpc, then galaxy-galaxy lensing parameters may be
significantly contaminated by other foreground galaxies or by additional
effects produced by groups or clusters of galaxies.
3 Clusters of galaxies
Gravitational growth of structure formation
predicts that clusters of galaxies
are dynamically young gravitational systems
still in formation. Numerical simulations clearly show that
the mass distribution of clusters of galaxies, their
radial mass profile as well as
the evolution of cluster abundance with redshift
strongly depend on cosmological models and can be used
in order to measure the cosmological parameters,
like or . Earlier work on
cluster lensing revealed however that these systems
are in general dynamically and thermodynamically complex
and hard to interpret from their baryonic content only
using simple models.
Because gravitational lensing analysis only probes matter
regardless the complexity of its internal physical properties,
it is an interesting alternative tool to standard
virial and X-ray studies.
From a weak lensing technical point of view,
clusters of galaxies are well suited systems
for mass reconstruction: their mass-density contrast is high
enough () to produce significant
gravitational distortion, and their angular scale
( 10 arc-minutes) is much larger than the typical
angular distance between the lensed background galaxies.
Therefore mass reconstruction in cluster of galaxies is quite
easy and robust, and the angular resolution good enough
for scientific purpose (about arcmin).
The present status of weak lensing mass reconstruction of
distant clusters of galaxies is listed in [10].
This sample only contains clusters with a redshift larger than 0.1
and does not include those analyzed
with the magnification bias (or depletion) technique.
Despite an important dispersion due to an
heterogeneous sample, some general trends emerge.
The averaged mass-to-light ratios from
weak lensing () is (with
a dispersion of ) and the typical
velocity dispersion is 1000 km/sec.
Assuming that all the mass is contained in clusters,
this corresponds to , which is
in good agreement with X-ray
or virial analyses as well as strong lensing studies based
of giant arc reconstruction in clusters of galaxies.
Unfortunately, the differences between
isothermal, power law or NFW
“universal” models are still smaller than
the errors of the measured mass profile
(see for example [11]). The fact that
giant arcs statistic is in favor of highly peak mass profile is
not enough to distinguish between the different theoretical profiles.
In fact, in view of the present signal-to-noise ratio of mass maps and
the large family of analytical mass profiles which are
proposed, this issue will demand important improvements in the shear
measurement and to stack together many cluster profiles.
It is important to notice that the difficulty to separate all
the analytical mass profiles from weak lensing reconstruction
is coming from random noise and not from intrinsic problems with mass
reconstruction (which has been extensively studied and tested). This
is well confirmed from the comparison between
weak lensing and X-ray analyses: for instance, the recent
comparison of lensing studies in Abell 2390 with Chandra observations
([12])
show a remarkable agreement of the mass profiles which confirm
a posteriori that mass reconstruction are reliable.
In contrast to the rather good agreement observed between
weak lensing and X-ray,
frequent discrepancies are reported on small scales
with strong lensing reconstructions. Part of the discrepancy
is due to gravitational lensing and is
likely a projection effect of matter located anywhere along
the line of sight of clusters ([13], [14]).
But on very small scale, inside
the innermost
regions, physical properties of clusters are complex and
a simplistic
description of hot baryons is no longer valid. [15]
observed that the discrepancy is only significant in
clusters without cooling flow of intra-cluster gas.
Since cooling flows are only detected in the densest
systems which are also the most dynamically evolved,
the tendency he reported reveals that only
young clusters show a discrepancy. If so, it is likely
that their dynamics and thermodynamics models of these clusters
are oversimplified.


4 Dark clusters
The unknown contribution to dark matter which could not be
detected by any method but gravitational
lensing would be the so-called “dark clusters”.
The most convincing cases reported so far (HST/STIS field,
Miralles et al 2001 - private communication;
Abell 1942, [16]; Cl1604+4304,
[17]; Cl0024+1654, [18])
show a clear shear pattern spread over angular scale of one
arcminute.
Their typical mass, estimated from reasonable assumptions
on their redshift, is about M⊙
and corresponds to .
It is not clear yet whether dark clusters are real physically bound
systems. An alternative view is that they are
indeed very high redshift clusters: they are not detected
because they are too faint and because most of its optical light
is shifted toward the infrared. This possibility has been explored
by [19] who carried out very deep H-band
observations of Abell 1942.
But nothing has been detected so far. It is also
possible that these systems do not have bright galaxies
but do have a hot intra-cluster gas. So far, none of them
have been observed deeply in X-ray telescopes, so it is
not demonstrated yet that dark clusters do not contain
baryonic matter.
The key question is now to confirm that dark clusters exist
or whether these detections are fortuitous fluctuations along
some line of sights. “Dark clusters” could also be produced by
intrinsic alignment, or just systematics. This is a difficult issue: up to now
we have no way, but gravitational lensing, to “see” them,
and if they contain neither galaxies nor hot gas, we cannot
measure their redshift. From a cosmological point of view, the existence
of such systems is a theoretical challenge. In particular,
it seems difficult to produce
a selective gravitational collapse which would accrete
only non-baryonic dark matter without simultaneous baryonic collapse.
From the
point of view of dark matter and dark cluster abundance,
if dark clusters include a large fraction of
mass, then
the mass fraction and the cluster abundance in the
universe have been underestimated.
Whether they contribute significantly
to has to be clarified. Assuming a flat universe with
, there is still enough uncertainty
in to allow dark clusters
(DC) to contribute up to without
facing contradiction with what we learned from other mass estimates.
5 Cosmic shear
The light propagation through an inhomogeneous universe accumulates weak gravitational deflections over Gigaparsec distances. The theoretical works pioneered about 40 years ago initiated a long series of theoretical and observational analysis, which came to successful detections two years ago. The developments in this field went incredibly fast and revealed some of the interesting cosmological applications of cosmic shear.
5.1 Gravitational deflection in inhomogeneous universe
Assuming structures formed from gravitational growth of Gaussian fluctuations, gravitational deflections on cosmological scales can be predicted from Perturbation Theory. To first order, the convergence at angular position is given by the line-of-sight integral
| (5) |
where is the radial distance out to redshift , the angular diameter distances, is the redshift distribution of the sources and the mass density contrast responsible for the deflection at redshift . depends on the properties of the power spectrum and tells us how the gravitational convergence field depends on the cosmic history of structure formation. Similarly, the cumulative weak lensing effects of structures also induce a shear field correlated with the projected mass density which can be characterized by the 2-point shear ( ellipticity) correlation function:
| (6) |
where is the power spectrum of the convergence field. Note that to first order we have . A measurement of this correlation function and of the skewness of the convergence, , which probes non Gaussian features in the projected mass density field, describe most of cosmological properties of the convergence field (see [21]; [22] and references therein). This is easy to demonstrate with a simple calculation based on perturbation theory and assuming a power law mass power spectrum. Assuming no cosmological constant, and a background population at a single redshift , and can be analytically calculated:
| (7) |
| (8) |
where is the spectral index of the power spectrum of density fluctuations. It shows that in principle the degeneracy between and is broken when both the variance and the skewness of the convergence are measured. Note that the true relationship between all the cosmological parameters and the measurement for realistic models (that is including CDM power spectrum, broad redshift distribution and non-linear effects) is in fact more complicated, but these equations faithfully reflect the main dependencies.
5.2 Expectations
From an observational point of view, cosmic shear surveys
turn out to be a difficult task.
[23]
clarified the strategy by exploring
the properties of the variance and the skewness of the convergence
for various cosmological scenarios.
They conclude that the variance can provide cosmological
information, provided the survey size is about 1 ,
whereas for the skewness at least 10 must be covered and
more than 100 for information on
or the shape
of the power spectrum over scales larger than 1 degree.
Like in the precedent Section, assuming perturbation theory and
a power law power spectrum with ,
we can derive the shear variance as a function of the survey characteristics.
For example for and , we have:
| (9) |
where is the total sky coverage of the survey. The numbers given in the brackets correspond to a measurement at confidence level of the shear variance. However, technical issues regarding corrections of atmospheric and optical distortions are the major concerns and the main limitations. The present-day systematic residuals prevent us to measure gravitational shear amplitude smaller than 0.3-0.5% ([24]). Translated into angular scale, it means that we are presently limited to , that is where the expected signal equals the residual systematics.
5.3 Observational results
Table 1 lists cosmic shear surveys with already
published results. This is not an exhaustive summary
because many surveys are still going on at SUBARU, CTIO, NOAO,
CFHT, HST or WHT and several are also planned within the next decade
with new facilities.
The different strategies adopted by each group enables
to handle carefully and in different manner all sources of
noise as well as systematics. It is indeed important to
keep
a variety of approaches in order to cross-check results and
consistency of cosmological interpretations and, in the future
to use all these samples together.
| Telescope | Pointings | Total Area | Lim. Mag. | Ref.. |
|---|---|---|---|---|
| CFHT | 5 30’ 30’ | 1.7 deg2 | I=24. | [25][vWM E+] |
| CTIO | 3 40’ 40’ | 1.5 deg2 | R=26. | [26][WTK +] |
| WHT | 14 8’ 15’ | 0.5 deg2 | R=24. | [27][BRE ] |
| CFHT | 6 30’ 30’ | 1.0 deg2 | I=24. | [28][KWL ] |
| VLT/UT1 | 50 7’ 7’ | 0.6 deg2 | I=24. | [29][Mv WM+] |
| HST/WFPC2 | 1 4’ 42’ | 0.05 deg2 | I=27. | [30] |
| CFHT | 4 120’ 120’ | 6.5 deg2 | I=24. | [31][vW MR+] |
| HST/STIS | 121 1’ 1’ | 0.05 deg2 | V | [32] |
| CFHT | 10 126’ 140’ | 16. deg2 | R=23.5 | [33] |
| CFHT | 4 120’ 120’ | 8.5 deg2 | I=24. | [34] |
From these surveys, it has been possible to recover the amplitude of the cosmic shear variance as function of angular scale. Figure 2 show the remarkable agreement between surveys111 [33] data are missing because depth is different so the sources are at lower redshift and the amplitude of the shear is not directly comparable to other data plotted. This plot is the most convincing result showing the existence of a correlation of ellipticities of galaxies in the universe. It is indeed interpreted as a cosmological weak lensing effect of large-scale structures of the universe. However, we should keep in mind that a robust and definitive cosmological interpretation of these measurements remain dependent on our ability to pin down the residual systematics and/or to separate signal and systematics as the E-B mode decomposition seems to be able to make it ([34]). Another important aspect is the necessity to improve our knowledge of the redshift distribution, which seems possible with the photometric redshift technique.
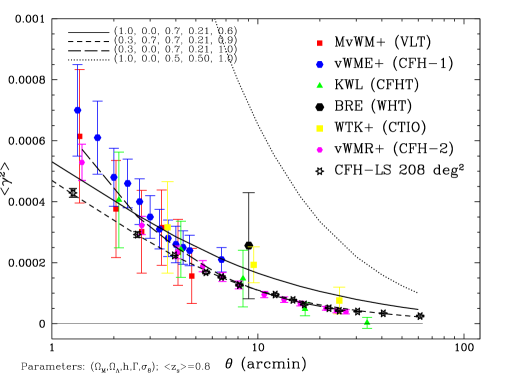
5.4 Cosmological outcomes
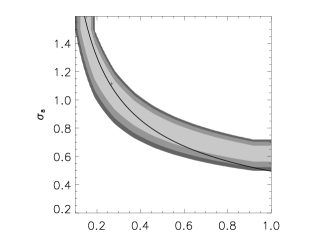
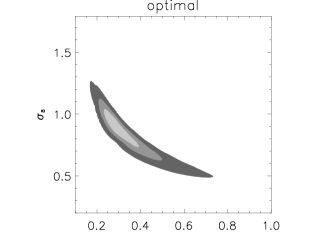
Comparison with some realistic cosmological models are ploted in Figure 2. The amplitude of the shear has been scaled assuming that sources are at , as expected from the comparison of the photometric depth of these surveys with the deepest spectroscopic surveys done so far. The standard COBE-normalized CDM is ruled at a 10 confidence level. However, there are many models which fit the data. This simply illustrates the degeneracy between and we discussed in the previous section and which cannot be broken without high-order statistics. A plot with - confidence level contours is more meaningful, as in Fig. 3. The left and middle panels show two independent data sets, both containing almost the same number of galaxies. The left panel is a compilation of the five first survey of the previous figure. It covers 6.5 deg2 over 75 independent areas and contains 250,000 galaxies. The middle panel is the CFH-2 survey (see figure 2) which covers 8.5 deg2 over 4 independent fields and contains 450,000 galaxies. Both - contours are difficult to reconcile observations with an -universe. Assuming a CDM model with , we can conclude that reasonable cosmological models have:
| (10) |
A more detailed investigation of the data also permits to probe the power spectrum of the dark matter on scale below 30 arc-minutes. [34] cleaned first the CFH-2 sample of the VIRMOS-DESCART cosmic shear survey222http://terapix.iap.fr/Descart and http://www.astrsp-mrs.fr/virmos/ from systematics residuals. This is possible by separating the shear field into curl-free and curl modes (called E and B modes respectively). This is identical to the technique expected to take place on the cosmic microwave background polarization analysis. In the case of weak lensing, the residual are expected to contribute equally to the E and B modes, while the cosmic shear signal shows up only in the E channel. By separating the and components of the shear field, [34] succeeded to reduce errors by a factor of of the pure gravitational lensing signal. Then, they computed each from the -mode in a standard way. They are shown on Figure 3. Since they are inferred from weak distortion of galaxies only, they represent a direct measurement the projected dark matter power spectrum. The data cover a small area, are still confined inside the range () and are noisy. However, the signal is strong enough to be compared with cosmological models or other inferred from redshift surveys or the CMB. It shows the potential of future cosmic shear surveys, in particular that it will be possible to measure the 3D mass power spectrum with accurate measurements.

5.5 Systematics and calibration issues
There are four major concerns regarding the amplitude and the
interpretation of the weak distortion signal. (1) systematics
produced by wrong or insufficient PSF anisotropy correction;
(2) systematics produced by real but non-lensing signal
producing similar distortion as cosmic shear, like
intrinsic correlations of ellipticities (3)
wrong scaling of redshift distribution of sources, and
(4) source clustering.
All of them have been analyzed at length.
Careful tests regarding PSF anisotropy corrections
demonstrate that residuals are
small on scale ranging from 1 arc-minute to 30
arc-minutes. The intrinsic correlations of ellipticities
which could be generated during galaxy formation processes
may produce similar signatures as cosmic shear. Several
recent numerical and theoretical studies (see for
example [35]; [36])
show that intrinsic correlations are negligible on scales beyond
one arc-minute, provided that the survey is deep enough. In that case,
most lensed galaxies along a line of sight are spread over
Gigaparsec scales and have no physical relation with its apparent
neighbors.
Since most cosmic survey are deep, they are almost
free of intrinsic correlations.
[34], in particular,
have confirmed that the VIRMOS-DESCART
survey listed in Table 1
shows a pure cosmic shear signal on scales beyond
one arc-minute, which dominates any systematics by
significant factor.
In contrast, shallow surveys may have strong contamination. Although
it weakens the interest of shallow survey for cosmic shear, they
are nevertheless interesting since
it give us insight on properties of intrinsic ellipticity correlations
produced by the generation of angular momentum during merging
processes of halos.
Likewise redshift of arcs which scale the total mass inside a
critical radius, the redshift of sources used for cosmic shear
analysis scales the amplitude of the shear. Current surveys
probe sources up to . This is within the
limits of giant telescopes, so
detailed informations on redshift distributions of lensed galaxies
will be soon well constrained333Using the DEEP2 ([44]
Davis et al. 2000)
or VIRMOS ([45] Le Fèvre et al. 2000) surveys for example.. Beyond this limit, there
is no possibility to get spectroscopic redshifts of sources and
only photometric redshifts are expected to work. Present-day
calibrations show that the technique works well enough to provide
source redshift with sufficient accuracy up to .
Beyond this, it may be more critical.
The difficulties may be with clustering of sources which seems
to significantly affect high-order statistics, like skewness
([37]). Uncertainties on the amplitude of
the skewness produced by clustering may be as high as 30% .
If so, multi-lens plane cosmic shear analysis will be necessary
which implies a good knowledge of the redshift distribution.
For very deep cosmic shear surveys, this could be could be
a challenging issue.
6 Conclusions and prospects
Tracing the matter and its evolution with look-back time
is a major goal of all massive
surveys done with ground based telescopes or satellites.
Weak gravitational lensing is a new but reliable tool for this
purpose because it is almost insensitive on the nature
and the physical stage of the matter. Past and present
experiences show that
it can provide astrophysical informations at about all scales
ranging from 10 kpc to 1 Gpc and address as well key scientific question
relevant for fundamental physics.
In this review we focussed on galaxies, cluster of galaxies and
large-scale structures. But first tentatives by Hoekstra at al
([38]) on the CNOC2 surveys on groups of galaxies and by Kaiser et
al 1998 ([39])
on a supercluster of galaxies will be soon widely deployed on very
large samples in order to understand the physics of these systems
and their interactions with galaxy halos, clusters and very
large structures. Used jointly with cosmic shear analysis, we
expect that these
surveys will provide a complete description of the dark matter, with
particular emphasis on the properties of its power spectrum, the
radial mass profile of bound systems and the coupling between
baryonic and non-baryonic matter. This last point is now underway.
The recent analysis on the biasing and galaxy-mass cross correlation
coefficient in the RCS survey by Hoestra et al show that we can
now test whether the linear biasing is valid and probe the relation
between mass and light as function of angular
scale ([40]; [41]). Similar studies can be done inside clusters of
galaxies by using jointly weak lensing, X-ray and SZ reconstructions
([42], [43]).
Next cosmic shear survey generation with MEGACAM at CFHT or VST/VISTA
at Paranal
or even space based panoramic cameras will improve by one order of
magnitude in details and precision (see figure 2).
It is expected that they will provide accurate projected mass
reconstruction, similar to APM galaxy survey. They should be able
to break the degeneracy between and from
the analysis of the skewness of . On a longer
time-scale, very large cosmic shear surveys
will probe the dark matter power spectrum over scales
larger than 10 degrees and will permit to constrains ,
or any quintessence fields ([46]; [47]).
Acknowledgements
We thank R. Athreya, K. Benabed, F. Bernardeau, E. Bertin, O. Doré, B. Fort, H. Hoekstra, B. Jain, P. Schneider, for useful discussions. This work was supported by the TMR Network “Gravitational Lensing: New Constraints on Cosmology and the Distribution of Dark Matter” of the EC under contract No. ERBFMRX-CT97-0172. YM thanks the organizers of the meeting for financial support.
References
- [1] Mellier, Y.; 1999 ARAA 37, 127.
- [2] Bartelmann, M.; Schneider, P.; 2001 Phys. Rep. 340, 292.
- [3] Brainerd, T.G., Blandford, R.D., Smail, I. 1996 ApJ466, 623.
- [4] Schneider, P.; Rix, H.-W. 1997 A&A 474, 25.
- [5] Tyson, A.J.; Valdes, F.; Jarvis, J.F.; Mills, A.P. 1984 ApJ281, L59.
- [6] McKay, T. et al. 2001 preprint, astro-ph/0108103.
- [7] Smith, D.R.; Bernstein, G.M.; Fischer, P.; Jarvis, M. 2000 Preprint astro-ph/0010071
- [8] Wilson, G., Kaiser, N., Luppino, G.A.; 2001 ApJ556, 601.
- [9] Keeton, C.R. 2001, preprint, astro-ph/0105200.
- [10] Mellier, Y.; 2001 Proceedings of the the ISSI workshop “Matter in the Universe”, Vol. 15. Ph. Jetzer, K. Pretzl and R. von Steiger Eds. Kluwer Academic Press.
- [11] Clowe, D.; Luppino, G.; Kaiser N.; Gioia, I.M.; 2000 ApJ 539, 540.
- [12] Allen, S.W., Ettori, S.; Fabian, A.C. 2001 MNRAS 324, 877.
- [13] Reblinsky, C.; Bartelmann, M; 1999 A&A345, 1.
- [14] Metzler, C.; White, M.; Michael, N.; Loken; 1999 AJ520, L9.
- [15] Allen, S.W.; 1998 MNRAS 296, 392.
- [16] Erben, T.; van Waerbeke, L.; Mellier, Y.; et al. 2000 A&A 355, 23.
- [17] Umetsu, K.; Futamase, T.; 2000 ApJ 539, 5.
- [18] Bonnet, H.;, Mellier, Y.;, Fort, B. 1994 ApJ427, L83.
- [19] Gray, M.; Ellis, R.S.; Lewis, J.R.; McMahon, R.G.; Firth, A.E.; 2001 MNRAS 325, 111.
- [20] Athreya, R.; Mellier, Y.; van Waerbeke, L.; et al. 1999 preprint, astro-ph/9909518.
- [21] Bernardeau, F.; van Waerbeke, L.; Mellier, Y.; 1997 A&A 322, 1.
- [22] Jain, B.; Seljak, U.; 1997 ApJ 484, 560.
- [23] van Waerbeke, L.; Bernardeau, F.; Mellier, Y.; 1999 A&A 342, 15.
- [24] Erben, T.; van Waerbeke, L.; Bertin, E.; Mellier, Y.; Schneider, P.; 2001 A&A 366, 717.
- [25] van Waerbeke, L.; Mellier, Y.; Erben, T.; et al.; 2000 A&A 358, 30 [vWME+].
- [26] Wittman, D.; Tyson, J.A.; Kirkman, D.; Dell’Antonio, I.; Bernstein, G. 2000a Nature 405, 143 [WTK+].
- [27] Bacon, D.; Réfrégier; A., Ellis, R.S.; 2000 MNRAS 318, 625 [BRE].
- [28] Kaiser, N.;, Wilson, G.;, Luppino, G. 2000 preprint, astro-ph/0003338 [KWL].
- [29] Maoli, R.; van Waerbeke, L.; Mellier, Y.; et al.; 2001 A&A 368, 766 [MvWM+].
- [30] Rhodes, J.; Réfrégier, A., Groth, E.J.; 2001 ApJ 536, 79.
- [31] van Waerbeke, L.; Mellier, Y.; Radovich, M.; et al.; 2001 A&A 374, 757 [vWMR+].
- [32] Hämmerle, H.; Miralles, J.-M.; Schneider, P.; Erben, T.; Fosbury, R.A.E.; Freudling, W.; Pirzkal; N., Jain, B.; White, S.D.M.; 2001 Submitted
- [33] Hoekstra, H.; Yee, H.;, Gladders, M.D. 2001 ApJ 558, L11
- [34] Pen, U.; van Waerbeke, L.; Mellier, Y.; 2001 preprint, astro-ph/0109182.
- [35] Crittenden, R.G.; Natarajan, P.; Pen, U.; Theuns, T. 2000 preprint astro-ph/0012336.
- [36] Mackey, J.; White, M.; Kamionkowski, M.; 2001 preprint, astro-ph/0106364.
- [37] Hamana, T. et al. 2000. preprint astro-ph/0012200
- [38] Hoekstra, H.; et al. 2001 ApJ 548, 5
- [39] Kaiser, N.;, Wilson, G.;, Luppino, G.; Kofman, L.; Gioia, I.; Metzger, M.; Dahle, H. 1998 preprint, astro-ph/9809268.
- [40] Schneider, P.; 1998 A&A 498, 43.
- [41] van Waerbeke, L.; 1998 A&A 334, 1.
- [42] Zaroubi, S.; Squires, G.; Hoffman, Y.; Silk, J.; 1997 ApJ 500, 87.
- [43] Doré, O., Bouchet, F., Mellier, Y., Teyssier, R.; 2001 A&A 375, 14.
- [44] Davis, M.; Newman, J.; Faber, S.; Phillips, A.; 2000 Proc. ESO/ECF/ESA on Deep Fields Springer.
- [45] Le Fèvre, O.; Saisse, M.; Mancini, M.; 2000 SPIE 4008, 546.
- [46] Hu, W.; Tegmark, M. ApJ 514, 65.
- [47] Benabed, K.; Bernardeau, F.; 2001 preprint, astro-ph/0104371.