Stellar differential rotation from direct starspot tracking
Abstract
On the Sun, the rotation periods of individual sunspots not only trace the latitude dependence of the surface rotation rate, but also provide clues as to the amount of subsurface fluid shear. In this paper we present the first measurements of stellar differential rotation made by tracking the rotation of individual starspots with sizes comparable to the largest sunspots. To achieve this we re-analyse four sequences of densely-sampled, high signal-to-noise echelle spectra of AB Doradus spanning several stellar rotations in 1996 December. Using spectral subtraction, least-squares deconvolution and matched-filter analysis, we demonstrate that it is possible to measure directly the velocity amplitudes and rotation periods of large numbers of individual starspots at low to intermediate latitude. We derive values for the equatorial rotation rate and the magnitude of the surface differential rotation, both of which are in excellent agreement with those obtained by ? from cross-correlation of Doppler images derived a year earlier in 1995 December, and with a re-analysis of the 1996 data by the method of ?. The differences between the rotation rates of individual spots and the fitted differential rotation law are substantially greater than the observational errors. The smaller spots show a greater scatter about the mean relation than the larger ones, which suggests that buffeting by turbulent supergranular flows could be responsible.
keywords:
stars: activity – stars: imaging – stars: individual: AB Dor – stars: rotation – stars: spots1 Introduction
Observational studies of differential rotation on rapidly rotating stars have recently been published by a number of authors. ? and ? applied a latitude-by-latitude cross-correlation analysis to pairs of surface images of the rapidly rotating K dwarf AB Doradus secured several days apart. They found a solar-like rate of surface shear, with the equatorial region rotating faster than higher latitudes and a beat period of about 110 days between the equatorial and high-latitude rotation periods. ? obtained a similar result for the young K dwarf PZ Tel. ? used a parametric imaging method to establish the differential rotation rate on the pre-main sequence G star RXJ1508-4423 (= LQ Lup). ? measured the differential rotation of the K subgiant primary of the RS CVn binary HR 1099 by this same method. ? and ? examined the evolving starspot distribution on HR 1099 from long sequences of Doppler images, and found evidence of a gradual poleward drift of large spot groups on timescales of months to years.
Studies based on Doppler images suffer from a number of drawbacks for this kind of work. When the sampling of the line profile around the stellar rotation cycle is sparse, the problem of mapping the stellar surface-brightness distribution becomes an ill-conditioned inverse problem, necessitating a regularised fitting approach. The regularising function imposes a penalty on the growth of fine-scale structure in the stellar image. This has the well-documented effect of biassing the centroids of low-latitude features in the images away from the stellar equator, and may even suppress them altogether. It it likely that differential rotation measurements based on these methods may suffer some distortion as a result.
Several recent Doppler imaging studies of rapidly rotating young main-sequence and pre-main sequence stars have, however, employed a much denser sampling strategy. With echelle spectrographs and large-format CCD detectors it is possible to monitor the profiles of thousands of lines simultaneously in continuous sequences of exposures with a time resolution of a few minutes. Signal-enhancement techniques such as least-squares deconvolution (LSD: ?) stack up the profiles of thousands of photospheric lines to give composite line profiles with signal-to-noise (S/N) ratios of several thousand.
These densely-sampled series of composite line profiles delineate clearly the trajectories of line-profile distortions of many small spots. They bear a superficial resemblance to time-series spectra of rapidly rotating, early-type pulsating stars. Many of the analytic techniques that have been used to identify non-radial pulsation modes in these objects operate directly on the data, without recourse to large-scale inversion techniques (?; ?; ?; ?; ?). Since the trajectories of starspot signatures in the trailed spectrogram of a rotating star are sinusoidal, it should be possible to use analogous forward-modelling techniques to identify individual spots and determine their properties.
The purpose of this paper is to apply matched-filter analysis to the problem of detecting and tracking individual unresolved starspots in densely-sampled time sequences of high S:N line profiles. Section 2 presents a re-analysis of archival echelle spectra of AB Doradus observed in 1996 December, from which Doppler images have previously been published. Section 3 develops a matched-filter methodology based on a similar technique used by Collier Cameron et al (1999, 2001) to search for faint reflected-light signatures of extra-solar planets. In section 4 this technique is used to measure the rotation periods of individual spot signatures present in each of these data sets, as a function of their rotational velocity amplitudes. In section 5 the results are compared with those predicted by differential rotation models derived from previous Doppler imaging studies.
2 Data preparation
The datasets employed here were secured using the SEMELPOL dual-fibre polarimeter feed to the UCL echelle spectrograph (UCLES) at the 4.2-m Anglo-Australian Telescope on 1996 December 23-29 (?). Readers are referred to the above paper for the journal of observation and details of the instrument configuration, and the initial extraction of the echelle spectra from the raw data frames.
The starspot signatures were isolated using a spectral subtraction and least-squares deconvolution procedure. The first task was to place all the spectra on a common velocity scale. This was achieved via the least-squares deconvolution method of ?. The essence of this technique is that the observed spectrum is treated as the convolution of an “average” line profile and a list of delta functions at the wavelengths of the known photospheric lines derived from a Kurucz model. The lines are weighted according to their central depths, and the “average” profile is computed using the method of least squares, such that it gives an optimal fit to the spectrum when convolved with the line list.

If the line list is augmented to include a list of known telluric lines in the observed wavelength range, the deconvolved profile develops a small, narrow pseudo-absorption bump near zero velocity. This feature becomes more apparent when we subtract the we subtract the deconvolved profile computed using the stellar line list only, as shown in Fig. 1. By fitting a gaussian to the central peak of this residual profile, we are able to determine the zero-point offset introduced by systematic errors in the wavelength calibration (using Th-Ar arc spectra taken at the start and end of each night) and by any instrumental flexure during the night. This offset is computed and applied to the zero-point of the velocity scale for all subsequent deconvolutions, thereby ensuring that the deconvolved spectra are accurately positioned in the observer’s rest frame.
Telluric-line spectra derived from the rapidly-rotating B star HR 3084 were then scaled and subtracted from the individual echelle spectra. The individual spectra of AB Dor were then summed to create a time-averaged spectrum for each night of observation. This template spectrum was then scaled and subtracted from each individual spectrum in turn, using the spectral alignment technique described by ?.


This left a residual spectrum consisting mainly of random noise, on which the residual line-profile distortions caused by stellar spots were superimposed. We deconvolved this residual spectrum with the stellar line list, this time applying the heliocentric velocity correction computed for the mid-time of the exposure. This yielded profiles from which the average line profile had been removed, effectively isolating the starspot signatures and placing them accurately on a heliocentric velocity scale.
Any residual telluric features produced by misalignment of the telluric template and the target spectrum were removed at this stage using principal-component analysis (PCA) of the night’s ensemble of spectra. Removal of the first two principal components was sufficient to eliminate the residual telluric lines without significantly affecting the starspot trails. A detailed description of the use of PCA for removal of correlated noise features is given by ?. In practice this only proved necessary for the spectra observed on 1996 December 29.
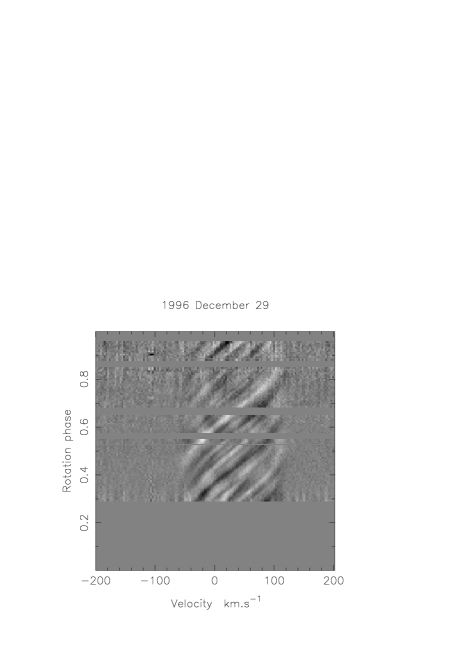
The resulting time-series of deconvolved starspot residuals are shown in Fig. 2. They show clearly the signatures of individual starspots, following sinusoidal paths about the stellar centre-of-mass velocity as they cross the visible hemisphere of the star. When the same range of rotation phases is observed on successive nights, the same features are seen to recur at more or less the same rotation phase. As Donati et al (1997, 1999) have shown, however, spots at high latitudes have slightly longer rotation periods than spots near the equator. High-latitude spots also have smaller velocity amplitudes, since they lie closer to the stellar rotation axis. Since we are interested in measuring the rotation periods and latitudes of individual spots in order to delineate the differential rotation pattern, we need to develop an optimal method for determining these two quantities directly from the trailed spectrograms.
3 Matched-filter analysis
The spectral signature of an unresolved spot on the stellar surface is closely approximated by a gaussian having the same full width at half maximum intensity (FWHM) as the local specific intensity profile of the spectral line concerned.
The gaussian profile varies in amplitude and radial velocity according to the expression:
Here is the radial velocity of the star’s centre of mass. A spot located at latitude on a spherical star lies at a distance from the stellar rotation axis. If the stellar axis is inclined at an angle to the line of sight, the spot’s radial velocity will vary sinusoidally about with angular frequency and amplitude , where
| (1) |
At any time , a spot at position will be displaced from the observer’s meridian in the direction of rotation by an angle
The stellar longitude increases in the direction of rotation, and is measured from the observer’s meridian on the stellar surface at an arbitrary time . The fiducial epoch is chosen to be near the middle of the sequence of observations, to eliminate spurious correlations between and .
While the spot is on the visible hemisphere its apparent area will be foreshortened by a factor
Here is the angular separation of the spot and the observer subtended at the centre of the star.
The flux blocked by the spot is also subject to limb darkening, which is assumed to have a linear dependence on with a limb-darkening coefficient . This value, from the tabulation of ?, is appropriate for an early-K photosphere at the depth- and inverse-variance weighted mean wavelength Å of the spectral lines used in the deconvolution.
The overall reduction in signal strength for a spot at foreshortening angle relative to its strength when viewed directly from above () is
The gaussian width parameter is related to the line FWHM by
The spectrum of the slowly rotating K dwarf Gl 176.3 has been used in several previous Doppler imaging studies of AB Dor as a spectral template whose line profiles are representative of the local line profiles on AB Dor in the absence of rotational broadening. A gaussian fit to the least-squares deconvolved profile of Gl 176.3 yielded km s-1.
The matched filter can be computed on a two-dimensional map with the same dimensions as the observed time-series spectrum, and fitted to the data via an optimal scaling. The scale factor by which is multiplied to give the best fit to an individual spot trail, is the equivalent width of the bump in the line profile that would be produced by the spot if it were located at the centre of the disc. It is proportional to the area of the spot, and related to the intensity ratio of the local continuum in the photosphere and the spot, the ratio of the line equivalent widths in the photosphere and the spot, the overall spot coverage, and the limb-darkening coefficient.
3.1 Second-derivative profiles
The matched-filter fitting procedure described above suffers from the disadvantage that although the residual starspot signatures are approximately gaussian, they appear superimposed on a sloping, non-zero background that changes slowly from one spectrum to the next (Fig. 3). This means that cannot be determined using a simple gaussian fit.

Instead, we compute a numerical second derivative to pick out the “ridge line” traced out by a spot in the trailed spectrogram. The second derivative of each spectrum in the observed time-series is defined as:
The choice of a two-pixel offset is a compromise between computing the derivatives over a small velocity range to avoid loss of resolution, and maximising the baseline over which the derivatives are computed to reduce noise. The smallest resolvable separation between neighbouring spot features appearing in a single line profile is roughly 5 pixels (Fig. 3), which suggests that a two-pixel offset is optimal in this respect.


We treat the matched filter in the same way:
Here is the contribution of the gaussian matched filter to the th pixel of the th profile in the time-series, which spans the velocity range from to :
The scale factor is then computed from these second-derivative maps via the optimal scaling:
Here is the variance associated with the data point , so
Note that the scale factor is the equivalent width in velocity units of the starspot bump that would be seen in the deconvolved profile if the spot were observed at the centre of the stellar disc, and so is expressed in km s-1.
4 Results
4.1 Spot parameter estimation
The optimal fitting procedure determines both and the associated badness-of-fit statistic
for a given set of matched-filter parameters . To identify spot signatures and measure their parameters, we construct a sequence of maps on a grid, for a range of rotation periods .
The sequence of maps is stacked to form a data cube, or which is then searched for local maxima in all three dimensions. Inevitably some of the weaker local maxima are spurious noise features, so it is necessary to impose a cutoff on (or better, on ) below which candidate spots are rejected as being probable noise features. An appropriate cutoff is found by computing the maps over a range of values somewhat greater than the stellar , and tuning the cutoff to reject all features with .
Note also from Fig. 2 that good repeated phase coverage was obtained on at least 3 of the 4 nights only for features crossing the centre of the line profile in the phase range from 0.50 to 1.00. The search was therefore restricted to this phase range.
| Phase | |||
|---|---|---|---|
| (km s-1) | (days) | (km s-1) | |
| 0.00655 | |||
| 0.00297 | |||
| 0.00171 | |||
| 0.00298* | |||
| 0.00596 | |||
| 0.00176* | |||
| 0.00155* | |||
| 0.00267 | |||
| 0.00196* | |||
| 0.00715 | |||
| 0.00244 | |||
| 0.00254 | |||
| 0.00297 | |||
| 0.00413 | |||
| 0.00181 | |||
| 0.00158 | |||
| 0.00188 | |||
| 0.00547 | |||
| 0.00275 | |||
| 0.00240* | |||
| 0.00369 | |||
| 0.00201* | |||
| 0.00254 | |||
| 0.00325 |
This yielded the list of candidate spots in Table 1. The parameter values are listed together with their formal errors, derived using
and similarly for and . The errors on the spot velocity amplitude and period are consistent with the values expected from simple considerations: if the radial velocity of a spot bump can be determined to a precision of order 0.1 pixel (300 m s-1), the uncertainty in the time at which it crosses the observer’s meridian is of order 20s. Over a 6-day (12-rotation) baseline, this gives an uncertainty of about 0.00003 day in the period determination. Determining the radial acceleration – and hence – involves measuring the change in spot velocity over the course of roughly one-sixth of the rotation cycle, which again involves velocity and timing measurements that are uncertain at the 0.1 km s-1 and 20s levels respectively. The resulting uncertainty in ought therefore to be of order 0.1 to 0.2 km s-1 for a well-observed spot.
We explored the effects of possible errors in the limb-darkening coefficient by repeating the matched-filter analysis using a more solar-like rather than . Given that the time-averaged spectrum is subtracted prior to deconvolution, the principal effect of decreasing the limb-darkening coefficient is to decrease the contrast between the strength of a spot signature viewed at the centre of the disc and near the stellar limb. As expected, we found that the lower value of yielded a slightly poorer fit to the data. The velocity amplitudes and rotations periods of individual spots were found, however, to be nearly identical (to within the 1- error limits) for both values of . This confirms that the results are insensitive to any error in the adopted value of the limb-darkening coefficient.
As was mentioned in Section 3 above, the equivalent width of a spot bump is related to the area of the spot. To a very good approximation, the equivalent width of an absorption line in the specific intensity profile from any part of the stellar disc is the same as the equivalent width of the rotationally-broadened line profile considered as a whole. The ratio of the equivalent width of a small starspot bump at disc centre to that of the entire line profile is therefore just the ratio of the flux “missing” in the spot () to the total flux from the remaining limb-darkened photosphere, . Here is the specific intensity of the photosphere at disc centre, and are the radii of the spot and the star respectively, and is the distance to the star. Hence
for a small, isolated spot viewed at the centre of the stellar disc.
In reality the spots are neither isolated nor completely dark. At the red wavelengths observed, the continuum surface brightness of the spots is expected to be about 0.25 to 0.3 times the photospheric value. The bump amplitude for a spot of given area is thus expected to be diminished by this amount relative to the bump amplitude for a completely dark spot. However, the fractional coverage of spots on AB Dor is probably of order 30 percent, which serves to increase the loss of light from an individual spot as a fraction of the total amount of “clean” photosphere. Overall, the effects of finite spot surface brightness and a high spot filling factor will tend to cancel each other out.
The spots listed in Table 1 have equivalent widths ranging from to km s-1. Since the equivalent width of the deconvolved stellar profile is approximately 4.5 km s-1 (cf. Fig. 1), the inferred fractional areas of individual spots range from 0.00026 to 0.0012 of the visible hemisphere. AB Dor has a radius similar to the Sun, so if they are considered as single, circular spots, their radii range from 11300 km up to 24000 km. The smallest detectable spots on AB Dor are thus comparable with the largest observed sunspots, whose umbral radii occasionally exceed 10000 km.
4.2 Aliasing between neighbouring spots

The relationship between the velocity amplitudes and rotation periods of the candidate spots is plotted in Fig. 5. Although many of the spots lie on a sloping sequence delineating the stellar surface differential rotation pattern, a second cluster of points with high values of and anomalously long periods is also present.
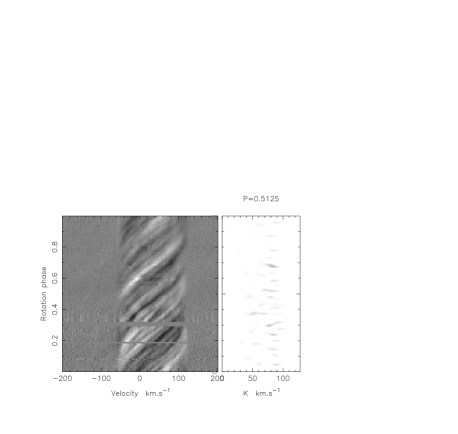
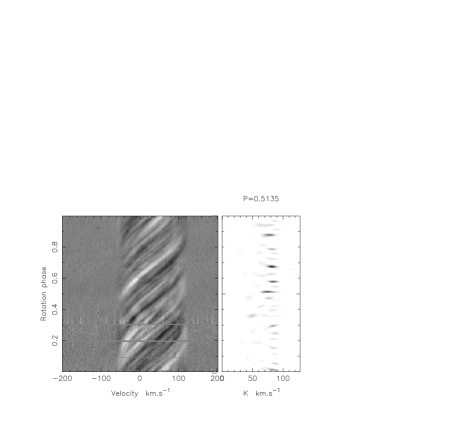
The upper cluster of points appears to result from aliasing between closely-spaced pairs of low-latitude spots. The top panel of Fig. 4 shows numerous low-latitude spots, with a typical separation in phase of between 0.02 and 0.04 rotations. The candidates with km s-1 and day are invariably sandwiched between a pair of candidates at similar latitudes, with periods of order 0.5135 day with a phase difference of 0.02 to 0.03, observed 4 to 6 days apart. Aliases will occur when the data set is phased at periods which cause a genuine spot signature seen near the start of the run to appear superimposed on that of a neighbouring spot at similar latitude observed near the end of the run. Aliases will thus occur at periods given by
A phase shift of 0.03 rotations over a 4-day interval corresponds to a beat period of 133 days. Hence we expect a pair of spots with days separated by 0.03 in phase to produce aliases at periods of 0.5155 and 0.5115 days. Pairs of spots with separations of 0.02 to 0.04 rotations, observed 4 to 6 days apart, can thus produce aliases with periods anywhere between 0.515 and 0.5165 days. This corresponds closely to the period range in which the aliases are seen in Fig. 5. The weak candidate spot at km s-1 and days appears to be another type of alias, arising from crosstalk between the blue-shifted and red-shifted ends of two distinct starspot trails from low-latitude features at phases 0.58 and 0.67.
4.3 Fitting a differential rotation law
? found that a differential rotation law of the form
| (2) |
with rad day-1 and rad day-1 gave a good description of the latitude dependence of the surface rotation rate of the magnetic features and dark starspots on AB Dor in 1995 December. This corresponds to an equatorial rotation period days, and an equator-pole lap time days.
Combining eqs. (1) and (2) gives
| (3) |
which can be solved iteratively to obtain the stellar latitude at which a spot will have a projected rotational velocity amplitude , given the values of , and . The rotation frequency of the spot (and hence its period) follows from eq. (2).
The equatorial rotation speed is known accurately from many previous Doppler imaging studies to be km s-1. We can therefore use eqs. (2) and (3) to determine the values of and that give the best (least-squares) fit to the data.

Fig. 6 shows contours of as a function of and . Note that, since the scatter in the period residuals is much greater than the precision of the measurements, an additional source of variance must be added to the errors associated with the periods listed in Table 1. As discussed in Section 4.4 below, the additional variance appears to be intrinsic to the star, and is equivalent to an additional RMS uncertainty of d in the period determination for each spot. Adding this error in quadrature to the measurement errors reduced the for the fit such that its minimum value was of order the number of degrees of freedom (in this case, 18 data points minus 2 fitted parameters.)
This fit yields days, and days. The parameters and are strongly correlated. The differential rotation parameters for the 1995 December dataset, obtained by ?, lie within the inner contour, close to the major axis of the error ellipse, indicating excellent agreement between the two methods. A re-analysis of the 1996 December data using the sheared-image method of ? gives days, and days, again in good agreement.
4.4 Residuals and spot size

The scatter about the fit to the data shown in Fig. 5 is considerably greater than the sizes of the errors on the data points. The measured periods of some of the best-observed spots deviate from the mean relation by as much as 0.005 day, giving an accumulated error of order an hour over the 6-day span of the data. This is too great to be ascribed to any plausible source of systematic error, such as irregularly-shaped spot groups spanning a range of latitudes. We are forced to conclude that the scatter in rotation rates for spots at any given latitude must be intrinsic to the spots themselves.
Fig. 7 may provide a clue to the physical origin of this scatter. Here we plot the residuals in rotational velocity
measured relative to the mean fit, as a function of spot size. The scatter about the mean relation appears to be considerably greater for the small spots than for the larger spots. This size-dependent scatter in the rotation rates of individual spots suggests that the smaller spots may be more susceptible to random buffeting by supergranular flows (see, e.g. ?). There does not, however, appear to be any significant difference between the average rotation rate of the large spots (i.e. those having km s-1), and that of the smaller spots.
5 Conclusions
The results of this investigation suggest that spectral subtraction, least-squares deconvolution and matched-filter analysis provide a powerful diagnostic method for identifying large numbers of individual starspot signatures in trailed spectrograms of AB Doradus and, by implication, other similar stars. The matched-filter analysis allows the positions and rotation periods of individual spots to be determined to high precision, and so provides a powerful alternative to methods involving regularised image reconstruction.
We have successfully measured the rotation periods of individual spots at latitudes ranging from the stellar equator up to a latitude of 55∘. The differential rotation law fitted to the larger spots shows excellent agreement with the mean relation obtained by ?. The rate of shear in the surface rotation speed as a function of latitude appears to be very similar to the Sun, with the equator pulling one full turn ahead of the pole every 110 days or so.
The rotation rates of the smaller spots at the low and intermediate latitudes studied here appear to have a larger intrinsic scatter than the large spots. Further observations of similar or better precision would be desirable to verify whether this size dependence is present. If confirmed, this result could give a first glimpse of the turbulent sub-surface velocity field in a late-type star other than the Sun.
ACKNOWLEDGMENTS
We thank Keith Horne for helpful conversations and useful comments on an early version of the manuscript. An anonymous referee made several useful suggestions for enhancing the clarity of the paper, and for improving the treatment of limb darkening. ACC acknowledges the support of a PPARC Senior Research Fellowship during the course of this work. This paper is based on observations made using the 3.9-m Anglo-Australian Telescope. The project made use of support software and data analysis facilities provided by the Starlink Project which is run by CCLRC on behalf of PPARC.
References
- Barnes et al. (2000) Barnes J. R., Collier Cameron A., James D. J., Donati J.-F., 2000, MNRAS, 314, 162
- Collier Cameron et al. (1999) Collier Cameron A., Horne K. D., Penny A. J., James D. J., 1999, Nat, 402, 751
- Collier Cameron et al. (2001) Collier Cameron A., Horne K., Penny A., Leigh C., 2001, MNRAS, submitted
- Diaz-Cordoves, Claret & Gimenez (1995) Diaz-Cordoves J., Claret A., Gimenez A., 1995, A&AS, 110, 329+
- Donati & Collier Cameron (1997) Donati J.-F., Collier Cameron A., 1997, MNRAS, 291, 1
- Donati et al. (1997) Donati J.-F., Semel M., Carter B., Rees D. E., Collier Cameron A., 1997, MNRAS, 291, 658
- Donati et al. (1999) Donati J.-F., Collier Cameron A., Hussain G. A. J., Semel M., 1999, MNRAS, 302, 437
- Donati et al. (2000) Donati J.-F., Mengel M., Carter B. D., Marsden S., Collier Cameron A., Wichmann R., 2000, MNRAS, 316, 699
- Hao (1998) Hao J., 1998, ApJ, 500, 440+
- Howard, Gilman & Gilman (1984) Howard R., Gilman P. I., Gilman P. A., 1984, ApJ, 283, 373
- Innis et al. (1988) Innis J. L., Thompson K., Coates D. W., Lloyd Evans T., 1988, MNRAS, 235, 1411
- Jankov, Janot-Pacheco & Leister (2000) Jankov S., Janot-Pacheco E., Leister N. V., 2000, ApJ, 540, 535
- Kennelly, Walker & Merryfield (1992) Kennelly E. J., Walker G. A. H., Merryfield W. J., 1992, ApJ, 400, L71
- Petit et al. (2001) Petit P., Donati J.-F., Wade G. A., Landstreet J. D., Oliveira J. M., Shorlin S. L. S., Sigut T. A. A., Collier Cameron A., 2001, in Boffin H., Steeghs D., Cuypers J., eds, Astro-tomography: An international workshop on indirect imaging. Springer, Berlin, In press
- Schrijvers & Telting (1999) Schrijvers C., Telting J. H., 1999, A&A, 342, 453
- Strassmeier & Bartus (2000) Strassmeier K. G., Bartus J., 2000, A&A, 354, 537
- Telting, Abbott & Schrijvers (2001) Telting J. H., Abbott J. B., Schrijvers C., 2001, A&A, 377, 104
- Vogt et al. (1999) Vogt S. S., Hatzes A. P., Misch A. A., Kürster M., 1999, ApJS, 121, 547