Extremely Weak Reflection Features in the X-ray Spectrum of XTE J1118480: Possible Evidence for X-ray-Emitting Jets?
Abstract
We have simultaneously fit Chandra and RXTE spectra of the Galactic black hole XTE J1118480 with three models for X-ray reflection. We explored a range of accretion disc ionizations (log()1–4; ) and iron abundances (0.10–1.00). Our fits with the constant density ionized disc models of Ross & Fabian indicate that 0.5 per cent (90 per cent confidence upper-limit) of the observed flux is reflected. Fits with the “pexrav” of model Magdziarz & Zdziarski indicate that the two-dimensional solid angle () subtended by the disc relative to a central source of incident hard X-rays is . A combination of the high inclination ( degrees), Comptonization, and bulk velocities may each contribute to the low reflection fractions we have measured. The results are also consistent with extended jets being the source of the hard X-ray flux, as the disc would then represent a small solid angle as seen from the emission region.
keywords:
Black hole physics – accretion – line:profiles – relativity – X-rays:bursts – X-rays:stars1 Introduction
Reflection geometries are well-established in AGNs, and the same basic geometry – the irradiation of an accretion disc by hard X-rays – is very likely at work in Galactic black holes (see, e.g., Gierlinski et al. 1997; Zdziarksi et al. 1998; Miller et al. 2001). The shape of the reflected component in a given spectrum depends on several factors, including the height and distribution of hard X-ray sources above the accretion disc, the temperature and ionization of the disc, and how close to the black hole the reflection occurs. Thus, the reflected component of a given spectrum may be used to constrain the accretion flow geometry.
XTE J1118+480 is particularly well-suited to reflection studies. In the bright X-ray states of most Galactic black holes (GBHs), the accretion disc is an X-ray object. This soft spectral component complicates fits with reflection models. In less luminous states, the accretion disc temperature is often below the soft X-ray band. Due to the extremely high latitude of XTE J1118480, the disc temperature could be measured via UV spectroscopy. At kT = 24 eV (McClintock et al. 2001a), the inner disc temperature in XTE J1118480 is similar to, or lower than, the inner disc temperatures measured in many AGN. In any reflection analysis, the inclination of the system and the mass of the black hole are important parameters, and both have been measured in XTE J1118+480 ( degrees, Wagner et al. 2001; , McClintock et al. 2001b), allowing us to more tightly constrain other model parameters.
Two separate new models have been proposed to describe XTE J1118480, which should produce different reflection signatures. Markoff, Falcke, and Fender (2001) have described a model in which synchrotron emission from the jet in this system (Fender et al. 2001) can account for the observed radio and X-ray spectra. In this model, a significant fraction of the power-law X-ray flux (perhaps all such flux) may be due to the jet. In such a geometry, one would expect very little of the flux to reflect from the accretion disc, and into the line of sight of the observer. Noting the similarity of optical and X-ray variability in this system, Merloni, Di Matteo, and Fabian (2000) have described a model wherein magnetic loops from the corona may generate hard X-rays and illuminate the accretion disc, creating the observed X-ray and optical QPOs. Although the inclination of XTE J1118480 is high, if this process is at work, a fraction of the incident hard X-rays from the magnetic loops might scatter into the observing line of sight.
McClintock et al. (2001a) and Esin et al. (2001) describe the accretion flow geometry in terms of an advection-dominated accretion flow (ADAF). In this picture, the central accretion region is a hot, quasi-spherical, radiatively-inefficient volume, and the inner accretion disc edge is truncated at a radius far from the black hole. A central ADAF may be expected to diminish the strength of any reflection features (e.g. Gierlinski et al. 1997). In contrast, Frontera et al. (2001) have described the accretion geometry in terms of a hot accretion disc. This work considers reflection explicitly and finds that the angle () subtended by the disc ranges between 0.11–0.18 for a variety of models.
For the purpose of constraining the accretion flow geometry in XTE J1118480, we have fit a number of reflection models, covering a large parameter space. Chandra and RXTE spectra were fit simultaneously, covering the 0.4–100 keV band. In the following sections, we detail our analysis and results. We also comment on recent models for XTE J1118480.
2 Observation and Data Reduction
We analyzed the Chandra LETG/ACIS-S spectrum reported on by McClintock et al. (2001a), reduced via the methods detailed in that work. Chandra observed XTE J1118480 on 18 April 2000, between 18:16–02:16 (UT), for an integrated exposure of 27.2 ksec. We consider the 0.4–5.0 keV range with 5 per cent systematic errors. Below 0.4 keV and above 5.0 keV, the data are more noisy and may require larger systematic errors (see the discussion in McClintock et al. 2001a), so we have restricted our fits to the 0.4–5.0 keV range.
We have summed 18 observations made with RXTE between 13 April and 15 May, 2000, for a total of 46 ksec of PCA data and 18 ksec of HEXTE data. This summation is not likely to distort any spectral features due to the extremely steady nature of XTE J1118480: fits to individual spectra indicate that the power-law index is constant at the 3 level of confidence across this time range (M. P. Muno, priv. comm.).
The PCA data was reduced using FTOOLS version 5. We used all available proportional counter units (PCUs; generally, PCUs 0, 2, and 3) in each observation, and selected only the top layers of the available PCUs. Response matrices were made using version 2.43 of “pcarsp.” Background spectra were made using the 2000 January 31 “blank-sky” model for gain epoch 4, and version 2.1e of “pcabackest.” Background spectra were subtracted using “mathpha.” We consider the 2.8–25 keV energy range, as residuals below 2.8 keV are relatively large and the PCA spectrum becomes background-dominated above 25 keV. Spectra from individual observations are summed using “mathpha.” Uncertainties in the PCA response may be as large as 1 per cent (Jahoda 2000), so we have added 1 per cent systematic errors to the statistical errors before fitting the summed PCA spectrum.
The HEXTE data were also reduced using FTOOLS version 5. The standard response matrices were used. The background was estimated using “hxtback,” and source spectra were summed using “mathpha.” No systematic errors were added to this data. Although data in the 15–20 keV range are likely free of any systematic effects, we excluded this range to avoid any possible response problems at the edge of the detector energy range. Even though HEXTE is sensitive up to 250 keV, we fit only up to 100 keV. We are interested in comparing reflection models as consistently as possible, and the version of the “constant density ionized disc” reflection model (Ross & Fabian, 1993; Ross, Fabian, & Young 1999) which calculates a reflection fraction is only valid up to 100 keV. The high energy signature of reflection – the Compton-backscattering excess – peaks near 30 keV (George & Fabian 1991), so an upper limit of 100 keV is high enough to allow for robust analysis.
3 Analysis and Results
Chandra LETG/ACIS-S, RXTE PCA, and RXTE HEXTE-A and HEXTE-B spectra are fit simultaneously, with an overall normalising constant allowed to float between each. The fitting range discussed above (0.4–100 keV) has a total of 1248 energy bins. For all fits, we fixed the neutral hydrogen column density to the value selected by McClintock et al. (2001a): N. We note a “notch” in the LETG/ACIS-S spectrum near 2 keV. As this feature was not seen in a BeppoSAX observation of XTE J1118480 (Frontera et al. 2001), we consider this feature to be an instrumental artifact. This assessment is bolstered by the fact that a similar “notch” is seen in other Chandra observations of bright continuum sources (e.g., Patel et al. 2001, Miller et al. 2002, Juett et al. 2002). We modeled this feature with an inverse edge at 2 keV (“”). With this addition, the LETG/ACIS-S spectral index becomes consistent with that of the other instruments.
Some of the fits we describe below include the effects of relativistic blurring, which is expected for regimes close to a black hole. In XSPEC, it is possible to convolve a fitting model with a Gaussian or Lorentzian profile. Instead of convolving with these profiles, we convolve with a profile appropriate for a general relativistic regime (the “diskline” model within XSPEC). Where we have blurred the spectrum, we do so for .
The “pexrav” and “pexriv” models do not include an Fe Kα line, and one must be added explicitly. The possibility of an iron line is discussed in McClintock et al. (2001a). Although we do not consider the 5–7 keV range in the Chandra spectrum due to larger overall effective area calibration uncertainties in that band, it is fine for examining the possibility of narrow emission and/or absorption features. We therefore adopt the same Fe Kα upper-limit as McClintock et al. (2001a), and constrain the equivalent width to be less than 24 eV. We fix the width at zero as any 1–2 bin features in the LETG are unresolved at the resolution of the PCA. The line center is fixed at 6.4 keV. We also consider the possibility of an Fe under-abundance intrinsic to XTE J1118480 in fitting “pexrav” and “pexriv” to explore the possible effects on the reflection fraction. It should be noted, however, that our fits to the Chandra/LETG data in the region of the Fe LIII edge do not indicate an under-abundance relative to solar values.
Fit parameters for each model which are not discussed below, are detailed in Table 2. Unless otherwise noted, all errors quoted in this paper are the difference between the best-fit value of a given parameter, and its value at the 90 per cent confidence limits.
3.1 Fits with a simple power-law
We first consider a simple power-law model for the spectrum (see Figure 1). This simple model is an excellent fit, yielding a very good reduced fit statistic (). We obtain a power-law index of , which is consistent with the values reported by McClintock et al. (2001) for the Chandra LETG/ACIS-S and combined RXTE spectra (, and , respectively). Frontera et al. (2001) measure a slightly harder power-law index with BeppoSAX (). Whereas we fit an energy range (0.4–100 keV) which does not require a blackbody component or a cut-off in the power-law slope at high energy, the Beppo-SAX results cover the 0.1–200 keV range, and include a blackbody component and a cut-off. Even without these considerations, it is striking how well these spectral characterisations agree.
3.2 Fits with “Pexrav” and “Pexriv”
We next made fits with “pexrav” (Magdziarz & Zdziarski 1995). This model describes the reflection of hard, power-law X-rays from a cool, neutral accretion disc. The parameters of this model include: the index of the incident power-law flux, the energy cut-off of the power-law, the reflection fraction (, normalised to 1, corresponding to an isotropic source above the disc), the source redshift, the abundance of elements heavier than He, the abundance of Fe, the cosine of the inclination angle, and component normalisation (photon flux at 1 keV). In our fits, the power-law index and cut-off, the reflection fraction, and flux were allowed to float. We fixed the redshift at zero, the lower abundances at solar, the Fe abundance at 0.10 and 1.00 relative to solar (see below), and the cosine of the inclination angle to 0.156 ( degrees; Wagner et al. 2001, McClintock et al. 2001b). We considered this model with and without incorporating the effects of relativistic blurring on the overall spectrum.
With the iron abundance set to 1.00 relative to solar abundances, fits with pexrav return a best-fit reflection fraction of . Relativistic blurring does not affect this result. However, as XTE J1118480 is a halo object, it is possible that it has a significant Fe under-abundance. We therefore also made fits with the Fe abundance fixed at 0.10 relative to solar abundance. Again, the best-fit values for , with blurring and without, were consistent with zero. The upper limits with this lower abundance are for both blurred and unblurred models.
We conclude that the upper-limits we have obtained with this model may be imprecise and dominated by the fact that the best-fit reflection fractions are consistent with zero. The most reliable upper-limit on the reflection fraction is likely the largest, . With these low reflection fractions, “pexrav” is a good fit to the data (e.g., without blurring and with Fe at solar abundance, ).
“Pexriv” (Magdziarz & Zdziarski 1995) is a cousin to “pexrav,” meant to cover regimes in which the accretion disc is ionized. An ionized accretion disc might be expected when the inner edge extends close to the black hole, and is therefore more strongly irradiated by incident hard X-rays. For this reason, we only consider this model with the effect of relativistic blurring. The parameters of this model in addition to those for “pexrav” include the disc temperature, and the disc ionization parameter . We fix the disc temperature to 24 eV, as per McClintock et al. (2001a), and examine the extreme ionization cases: (5000 is the upper-limit for this model), and Fe abundances of 0.10 and 1.00 relative to solar.
For solar iron abundances and , – this is exactly what we obtain with “pexrav” for the same values. For all other combinations of Fe abundance and , the upper-limit on the reflection fraction is . In all cases, “pexriv” was an acceptable fit (even for ); for the and Fe abundance at full solar value, .
We note that a very small error may be introduced by fitting “pexrav” and “pexriv” with a gaussian iron line model for which the maximum equivalent width is constrained to be less than 24 eV. Based on George & Fabian (1991), in the limit where all of the observed spectrum is reflected, the Fe Kα line equivalent width expected at an inclination of degrees is approximately 40 eV. However, as we measure only a very small fractional reflection with “pexrav” and “pexriv,” we regard any error introduced by constraining the Fe Kα line EW24 eV to be negligible.
3.3 Fits with the “Constant Density Ionized Disc Model”
This model is designed to handle a large range of disc ionizations (log()), assuming a constant density accretion disc and a power-law irradiating spectrum. The parameters for this model include the incident power-law flux, the disc ionization, the source redshift, the reflection fraction, and the component normalisation (related to photon flux at the detector, but not diluted by 1/d2, and therefore on the order of ph/cm2/s). In our fits, the redshift was fixed at zero, and all other parameters were allowed to float simultaneously. We considered this model with the effects of relativistic blurring.
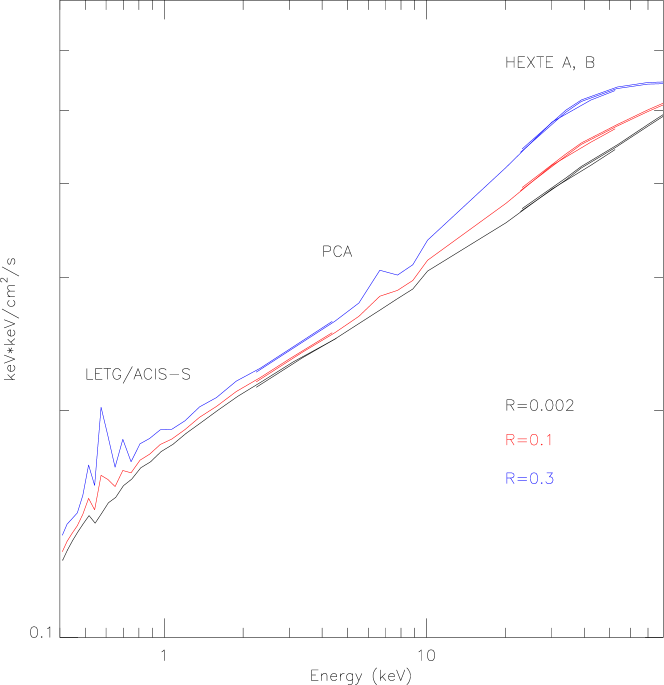
Extremely tight constraints are obtained with this model. A very low ionization is indicated: log(). As with the other models, the best-fit reflection fraction is zero; an upper limit of is obtained. Here, is the fraction of the total flux that is reflected (not an angle, like ). The fit achieved with this model is also good (). We tested the robustness of the low values for the ionization parameter and reflection fraction by fixing these parameters at higher values; this resulted in large changes in the fit statistic (), indicating that a low ionization and reflection fraction are strongly preferred with this model. In Figure 2, we plot the constant-density ionized disk model with , and 0.3 to illustrate the extremely weak nature of the reflection component we have measured in XTE J1118480.
The value measured by this model is an angle-averaged result. By inspection of the reflection components calculated in George & Fabian (1991), it is clear that at 81 degrees the strength of the reflected component is actually 2-3 times higher than we measure. Based on this comparison, the most appropriate upper-limit is slightly higher: .
4 Discussion
Each of the fits to XTE J1118480 with “pexrav” or “pexriv” wherein the strength of the reflection component is measured prefer – consistent with zero. These measurements are an order of magnitude lower than those found by Frontera et al. (2001) in fits to BeppoSAX spectra. Fitting these models on a range extending to 200 keV for a more direct comparison to the BeppoSAX results only minimally increases the upper limit on the reflection fraction: . “Pexriv” is not able to simultaneously constrain the ionization parameter and reflection fraction, and so we regard results from this model cautiously. Indeed, based on the very low inner accretion disk temperatures measured by McClintock et al. (2001a) and Frontera et al. (2001) – eV and eV, respectively – we expect a largely neutral accretion disk and therefore “pexrav” may be a more appropriate model. Fits made with the CDID model were able to constrain the parameters simultaneously, and indicate very little (if any) reflection component from a neutral accretion disk (, ), in good agreement with expectations based on the accretion disk temperature.
A flaring geometry for XTE J1118480 like that described by Merloni et al. (2000) is partially supported by our results. Beloborodov (1999) examined the effects of irradiating sources with large bulk velocity on the strength of X-ray reflection. Such a scenario might arise if a magnetically-active corona above an accretion disk is producing flares, and the flares are pushed away from the disk (e.g., by the radiation pressure from reprocessed radiation). For the measured inclination of XTE J1118480 ( degrees), there is no bulk velocity () which can explain a reflection fraction as small as the one we measure. However, it is possible that flaring of the kind described by Merloni et al. (2000) at large scale heights, especially if the flares have a bulk velocity, might produce a very small reflection fraction.
The effects of an inner ADAF geometry might also diminish the strength of reflected features. McClintock et al. (2001a) and Esin et al. (2001) find ADAF/disc transition radii of and , respectively. The degree to which reflection is diminished due to an inner ADAF can be addressed via fits to observations of Cygnus X-1. The model proposed by Esin et al. (1997) suggests that as the mass accretion rate falls between the “high/soft” state and “low/hard” states of black hole X-ray binaries, the inner disc may recede and be replaced by an inner ADAF. Esin et al. (1998) fit an ADAF model to these states in Cygnus X-1; in the high/soft state , and in the low/hard state , with a best-fit of . Gierlinski et al. (1999) and Gierlinski et al. (1997) fit reflection models to the high/soft and low/hard states, respectively. The angle subtended by the disc () reduces from to between these states. Thus, although an inner ADAF region of a size comparable to that reported in XTE J1118480 reduces by half the strength of the reflected components observed in Cygnus X-1, it does not reduce the reflection to . It therefore seems unlikely that an ADAF description of the accretion geometry in XTE J1118480 can account for our reflection results.
If a hot, optically-thin corona partially covers the inner accretion disk, then at least a fraction of the reflected spectrum must pass through the corona along a given line of sight. Petrucci et al. (2001) examined the effects of this scenario as a function of inclination angle, assuming a corona which blankets the accretion disk. For high inclinations, the strength of the observed reflection component may be diminished considerably by the effects of Comptonization. If the corona covers the accretion disk, then Comptonization may at least partially explain the very low reflection fraction in XTE J1118480. Such a geometry is not necessarily favored for this source, however. Fits to the Beppo-SAX spectrum with a number of Comptonization models by Frontera et al. (2001) find that the optical depth () of the corona is lower for a “slab” geometry than a spherical geometry. If the corona is spherical and central, and of a size similar to the ADAF geometry suggested by McClintock et al. (2001a) and Esin et al. (2001), then the effects of Comptonization on the reflection spectrum would likely be rather small. If the corona were larger and more diffuse, then a smaller optical depth might be expected for a spherical volume than for a slab geometry.
Finally, we consider the possibility that the hard, power-law X-ray flux observed in XTE J1118480 is due primarily to synchrotron self-Comptonization in the jet observed in this source (Markoff, Falcke, & Fender 2001). As seen from such an extended emission region, the accretion disk would subtend a smaller solid angle than the geometries we consider above. Of the explanations for a small reflection fraction that we consider here, this interpretation can most easily explain why we have measured reflection fractions consistent with zero.
If the jets are a source of the hard X-ray flux in XTE J1118480 as our fits may suggest, a number of interesting questions arise. Are the X-ray QPOs seen in this source (0.08 Hz; Revnivtsev, Sunyaev, & Borozdin 2000) manifested within the jet? How can the correlated X-ray and optical variability be explained? Why is XTE J1118480 different than other GBHs, wherein non-zero reflection fractions are measured (see, e.g., Zycki, Done, & Smith 1997; Gilfanov, Churazov, & Revnivtsev 2000), and the jet does not seem to be the major source of hard X-ray flux? The answers to these questions can be partially given by studies of reflection in other GBHs, but may only be answered definitively by subsequent outbursts of XTE J11118480 itself.
5 Acknowledgments
We wish to thank J. E. McClintock, H. L. Marshall, and M. P. Muno for generously providing data files, and for helpful discussions. We acknowledge Andrea Merloni for carefully reading this work and offering helpful suggestions. D. R. B. acknowledges financial support from the Natural Sciences and Engineering Research Council of Canada and a Commonwealth Fellowship. W. H. G. L. gratefully acknowledges support from NASA. This research has made use of the data and resources obtained through the HEASARC on-line service, provided by the NASA–GSFC.
References
- Arnaud (1996) Arnaud K.A., 1996, in Jacoby G., Barnes J., eds, Astronomical Data Analysis Software and Systems V, ASP Conference Series, 101, 17
- Bel (1999) Beloborodov, A. M., 1999, ApJ, 510L, 123B
- Esin (1997) Esin, A. A., McClintock, J. E., and Narayan, R., 1997, ApJ, 489, 865
- Esin (1998) Esin, A. A., Narayan, R., Cui, W., Grove, E. J., and Zhang, S., 1998, ApJ 505, 854
- Esin (2001) Esin, A. A., McClintock, J. E., Drake, J. J., Garcia, M. R., Haswell, C. A., Hynes, R. I., and Muno, M. P., 2001, ApJ, 555, 483
- Fender (2001) Fender, R. P., Hjellming, R. M, Tilanus, R. J., et al., 2001, MNRAS, 322, L32
- Gierlinski (1997) Gierlinski, M., et al., 2001, MNRAS 288, 958
- Gierlinski (1999) Gierlinski, M., et al. 2001, MNRAS 288, 958
- George (1991) George, I. M., & Fabian, A. C., 1991, MNRAS, 249, 352
- Fro (2001) Frontera, F., et al., 2001, ApJ, in press, astro-ph/0107199
- Gie (1997) Gierlinski, M., et al., 1997, MNRAS, 288, 958
- Gilfanov (2000) Gilfanov, M., Churazov, E., and Revnivtsev, M., 2000, Proc. of the 5th CAS/MPG Workshop on High Energy AStrophysics, astro-ph/0002415
- Jahoda (2000) Jahoda, K., 2000, unpublished talk presented 2000 March 22 at the Rossi 2000 Symp. (Greenbelt, MD:GSFC/NASA)
- Juett (2002) Juett, A., et al., 2002, ApJL, subm.
- Mag (1995) Magdziarz, P., and Zdziarski, A. A., 1995, MNRAS, 273, 837
- Markoff (2001) Markoff, S., Falcke, H., and Fender, R., 2001, A & A, 272L, 25
- McClintock (2001a) McClintock, J. E., et al., 2001a, ApJ, 555, 477
- McClintock (2001b) McClintock, J. E., Garcia, M. R., Caldwell, N., Falco, E. E., Garnavich, P. M., and Zhao, P., 2001, ApJ, 551, L147
- Mitsuda (1984) Mitsuda, K., et al., 1984, PASJ, 36, 741
- Merloni (2000) Merloni, A., Di Matteo, T., and Fabian, A. C., 2000, MNRAS, 318, L15
- Miller (2001) Miller, J. M., et al., 2001, ApJ, 546, 1055
- Miller (2002) Miller, J. M., et al., 2002, ApJ, subm., astro-ph/0202083
- Narayan (1994) Narayan, R., and Yi, I., 1994, ApJ, 428L, 13
- Nay (2001) Nayakshin, S., Kallman, T. R., and Kazanas, D., 2001, available at http:lheawww.gsfc.nasa.govuserssergms.ps
- Patel (2001) Patel, S. K., et al., 2001, ApJL, in press, astro-ph/0110182
- Petrucci (2001) Petrucci, P. O., Merloni, A., Fabian, A., Haardt, F., and Gallo, E., 2001, MNRAS subm., astro-ph/0108342
- Ross (1993) Ross, R. R., & Fabian, A. C., 1993, MNRAS, 261, 74
- Ross (1999) Ross, R. R., Fabian, A. C., & Young, A. J., 1999, MNRAS, 306, 461
- Wagner (2001) Wagner, R. M., Foltz, C. S., Shahbaz, T., Casares, J., Charles, P. A., Starrfield, S. G., and Hewett, P., 2001, ApJ, 556, 42
- Zdz (1998) Zdziarski, A. A., Poutanen, J., Mikolajewska, J., Gierlinski, M., Ebisawa, K., and Johnson, W. N., 1998, MNRAS, 301, 435
- Zycki (1997) Zycki, P. T., Done, C., and Smith, D. A., 1997, ApJ, 488, L113
| Observatory | Instrument | Bandpass | Fitting Range | Date (UT) | Time (ksec) |
|---|---|---|---|---|---|
| Chandra | LETG/ACIS-S | 0.24–7 keV | 0.4–5 keV | 18 Apr 18:16 | 27 |
| RXTE | PCA | 2–60 keV | 2.8–25 keV | 13 Apr – 15 May | 46 |
| RXTE | HEXTE | 15–250 | 20–100 keV | 13 Apr – 15 May | 18 |
| Model | Blurring a | Fe b | E | Norm. h | |||||
| (fixed) | (keV) | ||||||||
| power-law | No | 1.0 | 1.777(4) | – | – | – | 0.1823(7) | 1243 | 0.982 |
| pexrav | No | 1.0 | 1.767(3) | – | 0.182(1) | 1241 | 0.960 | ||
| pexrav | Yes | 1.0 | 1.767(5) | – | 0.178(1) | 1241 | 0.965 | ||
| pexrav | No | 0.1 | 1.764(4) | – | 0.04 | 0.182(7) | 1241 | 0.961 | |
| pexrav | Yes | 0.1 | 1.767(4) | – | 0.04 | 0.178(1) | 1241 | 0.966 | |
| pexriv | Yes | 1.0 | 1.767(4) | 0.178(3) | 1240 | 0.966 | |||
| pexriv | Yes | 1.0 | 1.768(4) | 0.001 | 0.180(3) | 1240 | 0.987 | ||
| pexriv | Yes | 0.1 | 1.767(5) | 0.001 | 0.178(3) | 1240 | 0.964 | ||
| pexriv | Yes | 0.1 | 1.767(5) | 0.001 | 0.178(3) | 1240 | 0.964 | ||
| CDID | Yes | 1.0 | 1.776(2) | – | 11.3(1) | 0.002 | 3.33(1) | 1241 | 1.035 |