PLASMA EJECTIONS FROM A LIGHT BRIDGE IN A SUNSPOT UMBRA
Abstract
We present conspicuous activities of plasma ejections along a light bridge of a stable and mature sunspot in NOAA 8971 on 2000 May 02. We found the ejections both in the H (104 K) images obtained with the Domeless Solar Telescope (DST) at Hida Observatory, and in the 171 Å (Fe ix/x, 106 K) images obtained with the Transition Region and Coronal Explorer (TRACE). Main characteristics of the ejections are as follows: (1)Ejections occur intermittently and recurrently, (2)The velocities and the timings of the 171Å-ejections are the same as those of H ejections, (3)The appearance of ejections are different from one another, i.e. the H ejections have jet-like appearance, while that of 171Å-ejections is like a loop.
1 INTRODUCTION
Characteristics of H surges have been studied for many years (e.g. Roy 1973). Those are summarized by Bruzek and Durrant (1977) as follows: (1)H surges are straight or slightly curved spikes that are shot out of a small mound, (2)On the solar disk, they appear usually in absorption, but in their initial phase, sometimes in emission, (3)They also show strong tendency to recur. Kurokawa (1988) and Kurokawa and Kawai (1993) have reported that H surges are often found at the earliest stage of Emerging Flux Regions (EFRs) and continue recurrently for many hours. They have also suggested that magnetic reconnection between a newly emerging flux and a pre-existing magnetic field is the essential mechanism of H surge production. Yokoyama & Shibata (1995) showed in their numerical simulation that such a reconnection really produces H surges in EFRs.
Roy (1973) found that H surges are also ejected from a light bridge of a sunspot umbra. However, no detailed study has been made of plasma ejections from a light bridge until now. We use the term “light bridge” to refer to a bright, long, and narrow feature penetrating or crossing a sunspot umbra. Light bridges are often seen in umbrae of mature and stable sunspots, and have been considered to have the same magnetic polarity as that of the sunspot umbrae, while their field strength is much weaker (Beckers and Schröter, 1969).
We found that conspicuous H surge activities occurred along the light bridge of the sunspot umbra in the active region NOAA 8971 on 2000 May 02, with 60 cm Domeless Solar Telescope (DST) at Hida Observatory, Kyoto University. H surge activities continued intermittently for about 6.5 hours, as long as the time span of our observation. Examining the extreme-ultraviolet (EUV) images obtained with the Transition Region and Coronal Explorer (TRACE) (Handy et al., 1999; Schrijver et al., 1999), we found similar ejections from the light bridge in 171 Å (Fe ix/x) images. Such ejections from a light bridge have never been reported before in the EUV wavelength. From now on, we refer to the ejection seen in 171 Å images obtained with TRACE as “171Å-ejection”.
In this Letter, we report the morphological and the dynamical characteristics of the ejections from the light bridge, using the H and the 171 Å images of high spatial and temporal resolution obtained with DST and TRACE, respectively. In §2, we summarize the observational data, and in §3, we present observational results and discussion. In §3.1, we report the features of the H surges obtained with DST, and in §3.2, compare them with 171Å-ejections. Then we discuss the magnetic configuration of this region and possible mechanisms for the surge activity in the light bridge in §3.3. Our results are summarized in §4.
2 OBSERVATIONAL DATA
We have observed the surge activities along the light bridge in the active region NOAA 8971 (N20∘ , W55∘ ) with DST from 23:00 UT on 2000 May 01 to 05:30 UT on May 02. The H monochromatic images were obtained with the Zeiss Lyot filter of 0.25 Å passband and SONY laservideo disc recorder sequentially in 3 wavelengths: H Å, Å, and Å. The successive wavelength-change and recording were controlled with a personal computer, and the time capture for each wavelength was 12 seconds. In this study we mainly used the H Å images, in which their ejecting motions are clearly seen.
The EUV images of this region obtained with TRACE are available from 04:30 UT to 06:00 UT on May 02. They also show conspicuous ejections along the light bridge. The TRACE 171 Å images were used to compare the features of the hot ejections of about 106 K with those of H cool surges of about 104 K. To co-align the H images with the EUV images, we used a TRACE 1600 Å image. There are a few soft X-ray images obtained with SXT (Soft X-ray Telescope) aboard Yohkoh (Tsuneta et al., 1991) during the time interval from 05:20 UT to 05:30 UT on May 02. To process the TRACE and Yohkoh SXT images, we used the solar software of IDL.
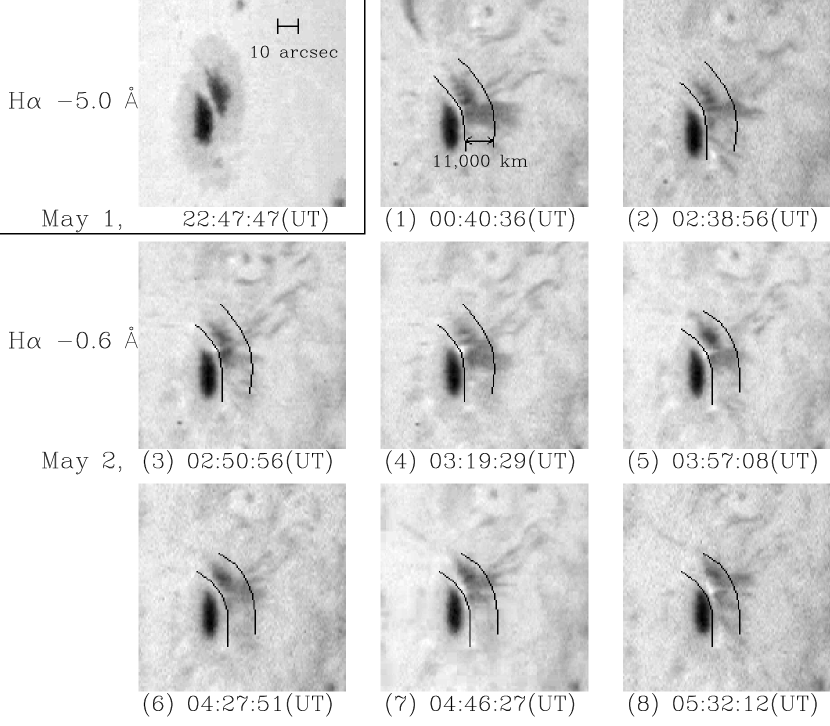
In Figure 1, the times of H and EUV observations are summarized, where each time is represented by plus (+) sign. The second and the fourth rows show the times when the ejections along the light bridge are distinctly identified at H and 171 Å, respectively, and numbered thick lines in both rows show that they are especially “conspicuous” ejections. We mainly studied the event which occurred at 04:46 UT on May 02 (#(7) in Figure 1, 2, and Table 1), because the ejection was clearly seen both in H and in EUV.
3 RESULTS AND DISCUSSIONS
3.1 Motions of H surges
During the observation of DST, which was about 6.5 hours, H surges were ejected intermittently from the light bridge of the sunspot umbra in NOAA 8971 (see Figure 1). Figure 2 shows eight surges which extended to larger than 11,000 km in apparent length. They are the largest among a number of surges observed in this light bridge. In Figure 2, the top left is the image at H Å, and the others are at H Å. The mean apparent velocity of these surges is about 40 , the mean apparent maximum length is about 17,000 km, and the mean lifetime is about 10 minutes. These features of the eight surges are listed in Table 1. We correct these values for the the projection effect. Assuming that the surges are vertically ejected from the solar surface, we get the velocity of 50 and the maximum length of 20,000 km. The surges we observed are a few times smaller in velocity and about an order of magnitude smaller in maximum length than those described by Tandberg-Hanssen (1995).
3.2 Comparison with TRACE and Yohkoh SXT images
We also found ejections from the light bridge in 171 Å images obtained with TRACE. These 171Å-ejections have occurred intermittently just as H surges. For the event of 04:46 UT (#(7) in Figure 1, 2, and Table 1), we compared the H surge with the 171Å-ejections with respect to their morphological and dynamical characteristics.
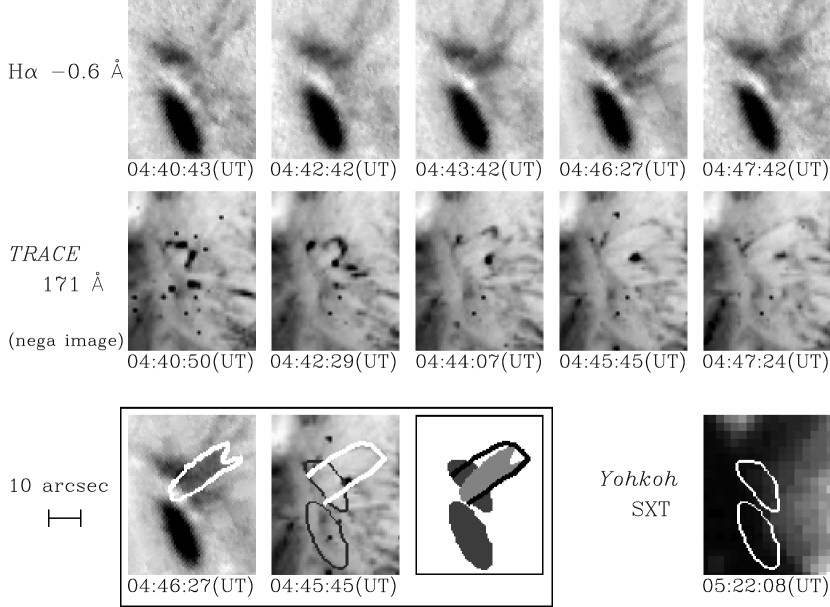
Figure 3 shows the evolution of the ejection in H Å (top) and TRACE 171 Å (middle; negative). The bottom right panel is a Yohkoh SXT image overlaid with the contour of the sunspot umbra. The three panels in the bottom left box show the comparison of the appearance and the site of the ejections. The rightmost panel in the box gives the spatial relation among the sunspot umbra, the H surge, and TRACE 171 Å loop, where they are displayed in dark gray, light gray, and black curved line, respectively. The timing and location of the ejections in TRACE 171 Å images are almost the same as those of the surges at H Å. Furthermore, the velocity of the 171Å-ejection is about 40 , and it is nearly equal to that of H surge (see Table 1). However, the appearance of the ejections are different between the H images and the EUV images; that of H surge is like a jet, while that of 171Å-ejection looks like a reverse U-shaped loop.
The H surges seem to be ejected along some open magnetic field lines of about 5,000 km in width, and about 12,000 km in length. On the other hand, the 171Å-ejections (hot plasma) are reverse U-shaped loops that trace the edge of H surges (cool plasma) (see the bottom middle cartoon in Figure 3). The separation of two foot points of the loop is about 5,000 km, and the loop top is about 12,000 km in hight. The growth of the reverse U-shaped 171 Å loops indicates the existence of some bipolar magnetic polarities in the light bridge of the sunspot umbra. In addition, as will be discussed below with the magnetograms (§3.3), the emergence of some new magnetic flux is probably occurring there. We examined soft X-ray images for the same region obtained with Yohkoh SXT, which provide information of the plasma of much higher temperature (more than 3 MK). However, we did not find any SXT ejections according the locations of the H surges and EUV ejection in the light bridge. Such difference between the appearance of cool (about K) surges in H and hot plasma ejections in 171 Å (about K) and in soft X-ray (more than 3 MK) images indicate some dynamical and thermal characteristics of plasma ejection in the light bridge of the sunspot umbra. They should be explained by a proper model of the accelerating and heating mechanism.
3.3 Magnetic Configuration
The continuous surge activity, which was found in the light bridge of the sunspot umbra (§3.1), is considered to be evidence of emerging magnetic flux (e.g. Kurokawa & Kawai 1993). The reverse U-shaped loop seen in TRACE images (§3.2) also suggests the emergence of a bipolar magnetic flux.
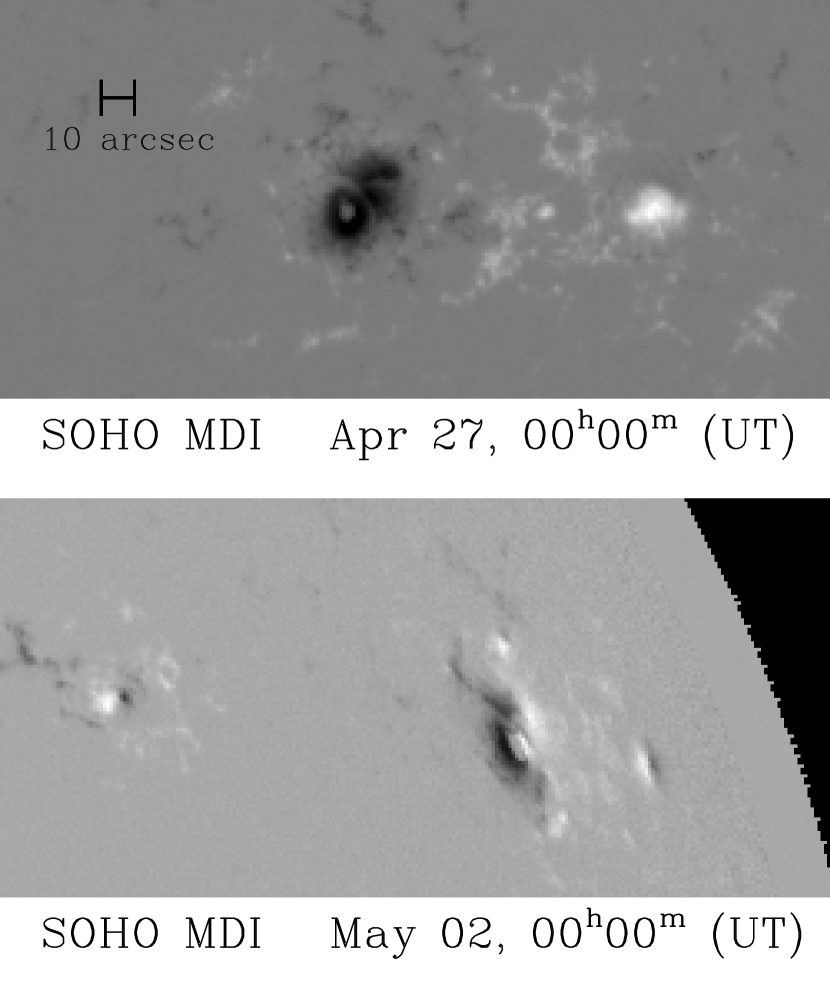
Figure 4 shows the magnetograms on April 27 (top; near the disk center) and on May 02 (bottom; near the northwest limb, N20∘, W55∘) obtained with the Michelson Doppler Interferometer (MDI) on board the Solar and Heliospheric Observatory (SOHO) (Scherrer et al., 1995). The sunspot has negative polarity (black). The polarity of the light bridge is also negative, though its field strength is much weaker than the main sunspot umbra (April 27 top). On May 02 (bottom), positive polarity (white) is seen at the location on the light bridge.
Since the sunspot is located close to the solar limb (55∘) on May 02, it is difficult to determine whether this opposite polarity is an indication of the newly emerging magnetic flux or whether it appears only due to the projection effect of the negative polarity field. We cannot exclude the possibility that some negative polarity which is inclined more than about 40 degrees from the normal produces the fake positive polarity. Nevertheless, we suggest that unresolved and small newly emerging magnetic flux plays an essential role in the long-lasting surge activity. To conclude that new bipolar magnetic fluxes really emerge in light bridges and produce such surge activities by magnetic reconnection, we need more precise observations of magnetic fields of light bridges, near the disk center and with higher spatial resolution.
4 SUMMARY
We studied dynamical characteristics of H surges along a light bridge in a sunspot umbra with the DST at Hida Observatory. The surge activities continued intermittently for a long time, at least 6.5 hours. The apparent velocity of the surges was about 50 in average, and it is typical for that of an H surge. We also studied the ejections from the light bridge observed in EUV coronal line of 171 Å with TRACE for the first time. The apparent velocities of 171Å-ejections were almost equal to those of H surges. We could not find any ejections from the light bridge in Yohkoh SXT images. This means that the temperature of plasma ejected from the light bridge is lower than a few MK. We found morphological differences between H surges and 171Å-ejections; the 171Å-ejections seem to be a loop, while the H surges are like jets. Examining the magnetogram obtained with SOHO MDI, we suggest that the emergence of new flux occurs in the region, though we cannot exclude the possibility that the opposite polarity is due to a projection effect. We need more precise observations of magnetic fields of light bridges.
References
- Beckers and Schröter (1969) Beckers, J. M., and Schröter, E. H., 1969, Sol. Phys., 10, 384
- Bruzek and Durrant (1977) Bruzek, A., and Durrant, C. J., 1977, Astrophysics and Space Science Library, 69, Illustrated Glossary for Solar and Solar-Terrestrial Physics, (Dordrecht: Reidel)
- Handy et al. (1999) Handy, B. N. et al., 1999, Sol. Phys., 187, 229
- Kurokawa (1988) Kurokawa, H. 1988, VA, 31, 67
- Kurokawa and Kawai (1993) Kurokawa, H., & Kawai, G., 1993, in ASP Conf. Ser., 46, The Magnetic and Velocity Fields of Solar Active Regions, ed. H. Zirin, G. Ai, & H. Wang (San Francisco: ASP), 507
- Roy (1973) Roy, J. R., 1973, Sol. Phys., 28, 95
- Scherrer et al. (1995) Scherrer, P. H., et al., 1995, Sol. Phys., 162, 129
- Schrijver et al. (1999) Schrijver, C. J. et al., 1999, Sol. Phys., 187, 261
- Tandberg-Hanssen (1995) Tandberg-Hanssen, E., 1995, Astrophysics and Space Science Library, 199, The Nature of Solar Prominences, (Dordrecht: Kluwer)
- Tsuneta et al. (1991) Tsuneta, S., et al., 1991, Sol. Phys., 136, 37
- Yokoyama & Shibata (1995) Yokoyama, T., & Shibata, K., 1995, Nature, 375, 42
Table 1: Apparent velocity and max. length of large surges
| number | time | apparent | apparent |
|---|---|---|---|
| velocity | max. length | ||
| # | [UT] | [km s-1] | [Mm] |
| H (1) | 00:40 | 37.1 | 19.9 |
| (2) | 02:38 | 32.3 | 23.2 |
| (3) | 02:50 | 41.0 | 15.9 |
| (4) | 03:19 | 57.3 | 17.0 |
| (5) | 03:57 | 44.0 | 14.2 |
| (6) | 04:27 | 28.3 | 14.2 |
| (7) | 04:46 | 40.4 | 13.9 |
| (8) | 05:32 | 15.6 | |
| mean value | 38.5 | 16.7 | |
| EUV | |||
| 171 Å (7) | 04:46 | 41.5 |