Cometary molecular clouds around RNO 6
We present molecular line observations of the star-forming
cloud around RNO 6 along with a newly discovered nearby molecular
cloud that we name RNO 6 NW. Both clouds display striking
similarities in their cometary structures and overall kinematics. By
using 13CO line observations, we estimate that these clouds
have similar sizes (4.5 pc) and masses (200
M☉).
Both molecular clouds RNO 6 and RNO 6 NW are active
in star formation. From new high resolution near-IR narrowband
images, we confirm that RNO 6 hosts an embedded IR cluster that
includes a Herbig Be star. A conspicuous H2 filament is found to
delineate the dense cometary head of the globule. RNO 6 NW hosts
at least two IR sources and a bipolar molecular outflow of 0.9 pc
of length and 0.5 M☉ of mass.
We show that the
cometary structure of both clouds has been created by the UV
radiation from numerous OB stars lying 1.5∘ to the north.
Such OB stars are associated with the double cluster and
Persei, and are probably members of the Per OB1 association. Thus
star formation inside these clouds has been very likely triggered by
the Radiation Driven Implosion (RDI) mechanism. From comparison to
RDI theoretical models, we find that the similar kinematics and
morphology of both clouds is well explained if they are at a
re-expansion phase. Triggered sequential star formation also
explains the observed spatial distribution of the members of the
near-IR cluster inside the RNO 6 cloud, and the morphology of the
H2 filament. We conclude that the RNO 6 and RNO 6 NW clouds are
high-mass counterparts to the cometary globules of smaller masses
which have been studied up to now. Thus our observations demonstrate
that the RDI mechanism can produce, not only low mass stars in small
globules, but also intermediate mass stars and clusters in massive
clouds.
Key Words.:
Stars: formation – Interstellar medium: individual objects: RNO 6 – Interstellar medium: jets and outflows – Interstellar medium: moleculese-mail:bachiller@oan.es
1 Introduction
Red Nebulous Object 6 (RNO 6, Cohen coh80 (1980)) is a rather bright nebulosity of 1′ size lying at the eastern border of an optical extinction patch of 2′ and placed 5∘ below the galactic plane in the Perseus constellation. The object was first catalogued as GM 4 by Gyulbudagyan & Magakyan (gm77 (1977)). It was also included, with the name NS 3, in the catalog of bipolar nebulae by Neckel & Staude (ns84 (1984)), because of the peculiar morphology which includes an equatorial lane of obscuration, roughly in the E-W direction, suggestive of a dusty disk. However, polarization measurements by Scarrott et al. (scrt86 (1986)) have shown that the dust obscuration in this lane is too low to constitute a dense disk as those which are usually observed around protostars or very young stars.
RNO 6 contains a B star with H emission (Cohen coh80 (1980)) which thus fulfills all the criteria that define Herbig AeBe stars as a class, namely (i) its spectral type is A or earlier with emission lines in the spectrum, (ii) its location is in an obscured region, and (iii) it is illuminating a nebulosity. This star has been hence included in some standard lists of HAeBe stars (e.g. Thé et al. the94 (1994)). The systematic searches for clustering around HAeBe stars carried out by Testi el al. (tes97 (1997), tes98 (1998), tes99 (1999)) revealed a clear enhancement in the stellar surface density profile toward the central RNO 6 position; it appears that the central B star is accompanied by a small group of less luminous stars.
The distance to RNO 6 is poorly determined. The kinematic estimate from a standard galactic curve (e.g. Burton bur74 (1974)) is 31 kpc, whereas the polarization measurements of Scarrott et al. (scrt86 (1986)) together with photometric considerations indicate a distance in the range 1.6 to 2.2 kpc. So we will assume in this paper a distance of 2 kpc. The spectral type of the main star of the RNO 6 group is also poorly known. The IRAS luminosity (300 ) corresponds to a ZAMS B6 star or to a B8III. No radio continuum emission at 6 cm was detected in the sensitive VLA search by White & Gee (wg86 (1986)).
The environment of RNO 6 was essentially unstudied up to now. The region was first observed in the millimeter wave range in the context of a complete survey of HAeBe stars (Fuente et al. fuente01 (2001)), and was found to be interesting on its own. One of the interests of the region resides in its possible relationship with the double cluster and Persei, which lie at only 1.5∘ in the sky from RNO 6, and which are at a comparable distance from the Sun (2.2– 2.6 kpc, according to Tapia et al. tap84 (1984)). Thus, as an extension to the surveys by Fuente et al. (fuente01 (2001)), we undertook a detailed study of the RNO 6 area, and the corresponding results are presented in this paper. The new data provide important information about the mass, kinematics, and evolutionary stage of the region; we have found that the strong UV field from the OB stars associated with the double cluster is creating striking cometary structures and is triggering star formation activity in molecular clouds around RNO 6.
2 Observations
We observed the 13CO J=10, C18O J=10, and 12CO J=21 rotational transitions around RNO 6 with the IRAM 30 m radiotelescope at Pico Veleta (near Granada, Spain) in June 1998. The three transitions were observed simultaneously using the multireceiver capabilities of the 30 m telescope. The backend was an autocorrelator split in several parts which provided a spectral resolution 78 kHz. Forward efficiency, main beam efficiency, typical system temperatures and Half Power Beam Width were 0.92, 0.68, 350 K and 24 at the frequency of the 13CO J=10 and C18O J=10 lines, and 0.86, 0.39, 1000 K and 12 at that of the 12CO J=21 line. Some regions of interest around the C18O maxima and around newly-detected 12CO wings (see Section 3) were explored in the H13CO+ J=10, and SiO J=21 lines near 3 mm. The characteristics of the telescope at these frequencies are similar to those at the C18O J=10 frequency. No SiO emission was detected at a level of 0.02 K r.m.s. (1.6 km s-1 velocity resolution). H13CO+ emission was well detected around the C18O maxima, but the data quality was not good enough as to produce contour maps. All line intensities in this paper are reported in units of main beam brightness temperature.
Near infrared (IR) observations were carried out with the United Kingdom Infrared Telescope (UKIRT) at Mauna Kea (Hawaii, USA) as part of a service observing program on October 2000. Narrow band (m) images through H2 (m) and continuum (m) filters were obtained using the near-IR camera UKIRT Fast Track Imager (UFTI). UFTI employs a HgCdTe array; the optics used provides a pixel scale of 0.0917″ and a field of view 90″. Two positions centered on RNO 6 and RNO 6 NW were observed with a 33 mosaic to cover a total field of view of 136″. As a result of the mosaic technique the signal to noise ratio is higher in the central regions of the final images than at the edges. The average seeing during these observations was less than 0.5.
3 Overall structure
3.1 Molecular clouds
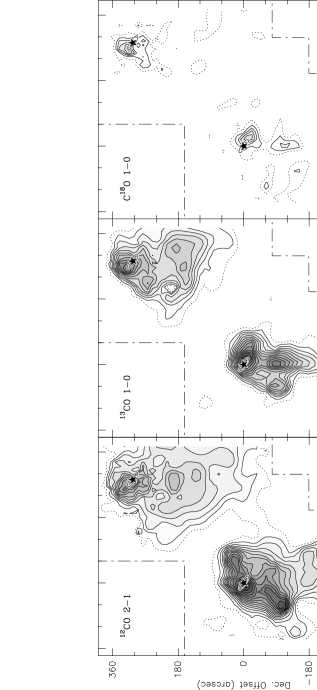
We mapped a region of 10′13′ around the central RNO 6 position in CO rotational lines. An overall view of the molecular clouds in the area can be obtained from the integrated intensity maps of Fig. 1. Strong CO emission around RNO6 comes from a molecular cloud which extends 7.5′4′. Surprisingly, a second cloud of similar size is observed toward the NW. In the following we will refer to these large-scale clouds as RNO 6 and RNO 6 NW, respectively. The central velocities of the emission peaks in both clouds are very close ( km s-1). Such a coincidence in radial velocity, together with the ridge of weak emission extending between both clouds, suggests that these clouds are placed at similar distances from the Sun, and very likely are physically connected.
Both clouds display a striking cometary morphology with sharp boundaries toward the N–NE, and much more diffuse tails extending toward the S–SW. At the assumed distance of 2 kpc, the tails of both clouds extend by about 4.5 pc. This kind of head-tail morphology is typical of molecular clouds placed in the vicinity of massive stars; winds and shocks from the massive stars are expected to compress the nearmost edges of nearby clouds which thus develop the cometary structure.
Both molecular clouds RNO 6 and RNO 6 NW are also well observed in the 13CO J=10 map. Nevertheless, the CO and the 13CO maps present important differences which can be attributed to several reasons. Most importantly, the CO J=21 exhibit deep self-absorption features near the central velocities, at which the 13CO profiles present their maxima. The differences in opacities make the CO map very sensitive to variations in kinetic temperature across the cloud, whereas the 13CO J=10 map is more sensitive to variations in the gas column density and reveals the opaque regions of both clouds. A well defined emission peak is associated with RNO 6, and the main peak in the NW cloud is placed near the offset (″, +310″). Finally, the C18O J=10 emission is more concentrated than the 13CO emission revealing that the most opaque zones are close to offsets (″, ″), (0, ″), and (″, ″).
We have estimated the masses of the different clumps by assuming LTE at a temperature of 15 K, which should be adequate for the inner regions of the cloud. We have considered that the boundaries of the clouds are defined by the lowest contours given in Fig. 1 (marked with dashed lines in the maps). From the C18O data, by assuming a C18O/H2 abundance ratio of 1.710-7 (Frerking et al. 1982), we estimate that the three clumps near (″, ″), (0, ″), and (″, ″) have masses of 55, 34, and 73 , respectively. The masses of the RNO 6 and RNO 6 NW molecular clouds, estimated from the 13CO data are 190 and 235 , respectively, where we have assumed a 13CO/H2 abundance ratio of 210-6 (Frerking et al. frer82 (1982), Bachiller & Cernicharo bach86 (1986)). Thus, assuming that half of the mass is in a halo which is seen in CO but not in 13CO (Cernicharo & Guélin cg87 (1987)), we estimate that the total mass in both molecular clouds amounts to 850. We caution that these mass estimates are subject to important sources of uncertainty. In addition to the poorly known distance, uncertainties in the CO isotope abundances and in the excitation temperature make the mass estimates to be uncertain by a factor of 2.
3.2 Young stars in the region
3.2.1 RNO 6
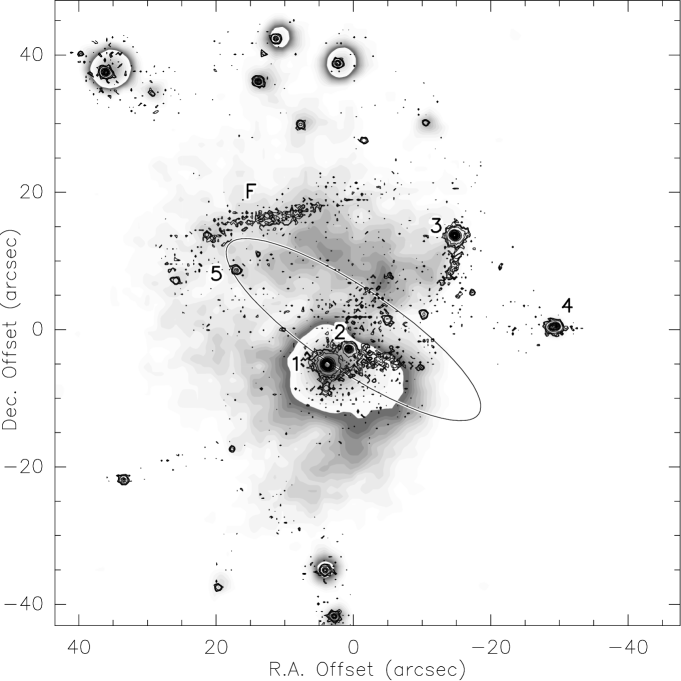
Figure 2 shows the new near-IR image of the RNO 6 region overlayed on the Digital Sky Survey red image. The near-IR image, obtained through a narrow-band H2 filter, is shown here without subtracting the continuum in order to display the stars (which disappear in the continuum-subtracted image). The central region, which is very bright in the optical, contains at least two stars (labeled 1 and 2 in Fig. 2), one of which is the Herbig AeBe star. This double source is accompanied by a small cluster of at least 10 fainter stars which are distributed in a region of 30″, in good agreement with Testi et al. (tes98 (1998)). Only the most prominent stars in the central region have been labeled. In addition to the stellar emission, the near-IR image shows a kind of filament near offset (10″, 15″), which is labeled F, and another filamentary structure arising in star 3. The continuum-subtracted image of the area shows that the emission from these filaments is purely H2 line emission. It can also be noted that the filament F appears external to the bipolar nebulosity and situated at the periphery of the optical nebula.

We have examined the IRAS point source catalog to search for infrared sources in the region. We found that RNO 6 is coincident with an IRAS source (IRAS 02130+5509) of increasing spectrum from 12 to 100 m. The IRAS fluxes (see Weaver & Jones 1992, for corrected co-added values) lead to a luminosity of 300 .
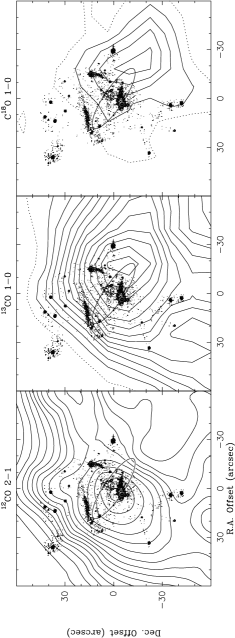
The spectra of CO and its isotopomers arising from two positions near the cluster are shown in Fig. 3. Note the striking differences in the emission of the CO isotopomers toward the (0,0) map position, i.e., the position where the B star is located, and the (–20″, –20″) position where the C18O is stronger. Clearly the CO and C18O lines peak at different places, and this is further illustrated in the superposition of the near-IR image on the maps in the lines of CO and its isotopomers shown in Fig. 4. The CO line peaks near the central (0,0) position, whereas the C18O maximum is placed near (–20″, –20″). The strong CO peak (peak line intensity 25 K) seen at the stellar position clearly indicates the presence of a local temperature maximum, probably owing to the gas heated by the stellar radiation. In contrast, the C18O maximum near position (–20″, –20″) marks a maximum in gas column density in which the temperature is significantly lower (peak CO line intensity 10 K). These displacements of the stellar positions from the dense cores are typical of relatively “evolved” young stars (Fuente et al. 2001), and indicate that the UV flux from neighbouring stars to the northeast has been able to destroy the molecules and to heat the gas in this region. Finally, note that the filament F seen in H2 emission delineates the north-east edge of the C18O clump.
3.2.2 RNO 6 NW
There is another point IRAS source, IRAS 02124+5514, associated with the maximum at (″, ″) in RNO 6 NW. This source also presents an increasing spectrum from 12 to 100m, but it is much weaker than RNO 6. The luminosity of IRAS 02124+5514 is estimated to 27 .
The near-IR images of the region we obtained with UKIRT are relatively featureless. A detailed comparison with the Digital Sky Survey optical images reveals a star with significant 2 m excess emission at position 02:12:29.1, 55:14:24 (1950.0), with 1 uncertainty. This object is thus at the edge of the position uncertainty ellipse of the IRAS source, so it is unclear whether the IRAS and the near-IR sources are the same star. On the other hand, in the next section we report the detection of a high-velocity bipolar outflow in this region. As shown in Sect. 4.2, the driving source of the outflow is also predicted to be at the edge of the uncertainty ellipse of the IRAS source, but it is 27 east of the near-IR source, so we believe that there are at least two young stars in this region.
Figure 5 provides some molecular spectra observed toward RNO 6 NW. H13CO+ J=10 emission was detected around the C18O maximum, and the peak velocities and linewidths of both lines are found to be similar, confirming that both lines are formed in the same region of the cloud. The detection of H13CO+ implies the presence of rather high-density material (volume density a few 104 cm-3) associated with RNO 6 NW. The presence of a dense molecular core, together with at least two closely associated embedded sources demonstrates that the RNO 6 NW molecular cloud is an active site of star formation.
4 Kinematics
4.1 Velocity-position diagrams
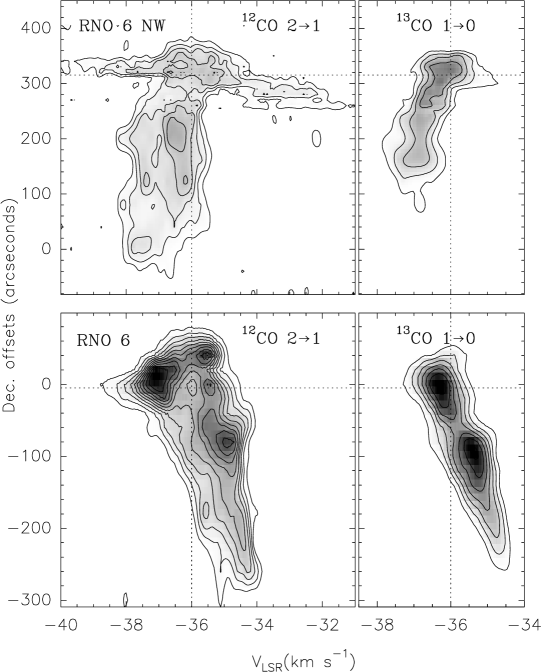
There are important variations in the CO profiles shapes and in the central velocities of the different molecular lines across the mapped region. This is illustrated in Fig. 6 by means of velocity-position diagrams along the N-S direction for both RNO 6 and RNO 6 NW clouds.
The cuts near RNO 6 show very nicely how the 13CO emission lines peak at the self-absorption dips or shoulders of the CO profiles. The CO lines are broadened near the position of the IRAS source, where both 13CO and C18O present well pronounced maxima. Moving from this position to the South (i.e. from the head to the tail of the cometary cloud) there is a remarkable continuous velocity gradient. The velocity of the peak emission varies from –36 km s-1 to –34 km s-1.
A similar cut near RNO 6 NW displays a rather similar behavior. Again a systematic velocity gradient is observed from the head to the tail of the cloud, with the velocity changing from –36 km s-1 near the head position to –37 km s-1 at the end of the tail. The CO lines are also found to be very broad around the position of the IRAS source. Nevertheless, the broadening around IRAS 02124+5514 is much more pronounced than that observed around RNO 6 as the CO lines extend over 10 km s-1 and exhibit prominent wings typical of high-velocity molecular outflows.
4.2 A bipolar outflow around IRAS 02124+5514 (RNO 6 NW)
The CO spectra around IRAS 02124+5514 (see Fig. 5) show that the wings extend from about –41 km s-1 to –30 km s-1. Examining the 12CO J=21 profiles around IRAS 02124+5514 we find that there is a systematic behavior in the spatial location of the velocity wings. Blue-shifted wings are observed at the positions north of the IRAS source, whereas redshifted wings are observed at the southern positions. The distribution of the blueshifted wing (integrated from –41 to –37.5 km s-1) and of the redshifted wing (integrated from –34.5 to –30 km s-1) is shown in Fig. 7. The distribution of the emission is strongly bipolar with respect to the position offset (–265″, +315″). We thus predict that the source driving the outflow is at the (corresponding) coordinates: 02:12:32.1, 55:14:27 (1950.0), with a uncertainty of 5. As discussed in Sect. 3.2.2, this position is at the edge of the error position ellipse of the IRAS source, but it is east from the near-IR source we detected in the region. The three positions are marked in the outflow map of Fig. 7 with different symbols. If we take into account the resolution of our observations and the IRAS positioning error, we conclude that the IRAS 02124+5514 emission could arise in the outflow driving source, in the near-IR star, or in both of them. However, the large position offset from the outflow driving source to the near-IR star suggests that these are different objects.

The total length of the outflow is 0.9 pc, and it is poorly collimated. Its collimation factor, estimated as the ratio of the outflow length to its width, is . The outflow is very asymmetric; the south (redshifted) lobe is brighter, and twice more extended along the flow axis than the north (blueshifted) lobe. Such an asymmetry is likely related to the location of the IRAS source within the ambient molecular cloud. It is important to note here that molecular outflows are made of accelerated “ambient” material (e.g. Bachiller & Tafalla bt99 (1999)). Since IRAS 02124+5514 is near the north border of the globule’s head, the southern flow lobe is propagating within the cloud, where there is abundant material to be swept up. However the north outflow lobe is propagating out of the cloud into an “empty” medium which is illuminated by a strong UV field (see Sect. 5). So in this northern area there is less material to be swept up, and moreover the UV field can quickly destroy the CO molecules carried out of the cloud. We thus believe that the cloud morphology, and the location of the YSO within it, can explain the observed asymmetry of this outflow. Indeed there are other known cases of asymmetric outflows at the edges of molecular clouds, examples include HH 46-47 (Hartigan et al. ha90 (1990)) and Orion B (Richer et al. rich92 (1992)).
The mass of the outflow, , can be estimated from the CO intensities integrated to the wings. We assumed Local Thermodynamical Equilibrium (LTE) at an excitation temperature of 15 K, optically thin emission along the wings, and a H2/CO abundance ratio of 110-4 (Frerking et al. frer82 (1982)). We found that the masses of the blue and redshifted lobes are 0.12 and 0.35 , respectively. We however caution that this mass estimate is subject to important uncertainties. In addition to that arising from the poorly known distance, the main uncertainties arise (i) in the placement of the velocity boundary between the high velocity wing and the ambient line and (ii) in the assumed kinetic temperature (note that the mass estimate is nearly proportional to the assumed temperature). We believe that our estimate of the outflow mass ( 0.5 M⊙) is accurate within a factor of 2.
The kinematical time scale of the outflow can be estimated, for each of the lobes, as the ratio where is the distance from the center of mass of the lobe to the driving source, and is the mean velocity of the lobe. We estimate that both outflow lobes have 105 yr. This estimate considers that the outflow is created from a unique explosive episode, which very likely does not corresponds to reality. As mentioned above, the CO outflow consists of ambient material which is accelerated from the driving agent (the primary wind from the star/disk system) and which is decelerated as it moves into the surrounding molecular cloud. So the estimate given above is obtained from a very crude approximation. Another important source of uncertainty in estimating the kinematic time scale is the inclination angle of the outflow with respect to the line of sight. The estimate above is valid for an inclination angle = 45∘, otherwise it has to be multiplied by a factor of tan(). The small spatial overlap between the blueshifted and redshifted lobes indicates that the inclination angle of the RNO 6 NW outflow is probably higher than 45∘. If the inclination were = 75∘, the estimated time scale should be multiplied by a factor 0.27.
The momentum, kinetic energy, and mechanical power of the outflow can be estimated as , and , respectively. We obtain 1.4 M⊙km s-1, 4.21043 erg, and 510-3 L⊙, respectively, without correcting for projection effects. For an inclination angle of = 75∘, these estimates become 5.4 M⊙km s-1, 6.41044 erg, and 0.26 L⊙, respectively. Thus, compared to other outflows, the parameters of the RNO 6 NW outflow appear relatively modest and correspond to a driving young star of low mass. The mechanical power of the outflow, in the range 510-3 to 0.26 L⊙, depending on the outflow inclination, points to a source of 1– 20 L⊙ (see e.g. Bachiller & Tafalla bt99 (1999)). By comparing this estimate with the luminosity of the IRAS 02124+5514 source (27 ), we conclude that the IRAS flux could contain some contribution from the near-IR star placed 27″ west from the outflow origin (see Fig. 7).
Since SiO emission is a sign of youth in outflows (Bachiller ba96 (1996)), we searched for SiO emission in several selected positions of the RNO 6 NW outflow to assess the evolutionary stage of the system. No SiO emission was detected at a level of 0.02 K rms.
In summary, the rather long kinematic time scale ( 105 yr), poor collimation (), and lack of SiO emission indicate that the IRAS 02124+5514 outflow is in a rather evolved stage. These outflow characteristics (see Bachiller & Tafalla bt99 (1999)) indicate that IRAS 02124+5514 could be a relatively evolved Class I source with a luminosity in the range 1– 20 L⊙.
5 Discussion
The cometary morphology of both RNO 6 and RNO 6 NW molecular clouds, the presence of star formation activity at the dense heads, and the strong velocity gradients observed along the major axes of both clouds, are all attributes of molecular clouds which are subject to the strong influence of neighboring luminous stars.
Such category of cometary clouds include the bright-rimmed globules as those studied by Hawarden & Brand (hb76 (1976)) and Sugitani et al. (sug89 (1989)). Cometary globules are believed to be formed by the Radiation-Driven-Implosion (RDI) mechanism first described by Reipurth (br83 (1983)), and later on modeled by Bertoldi & McKee (bm90 (1990)) and Lefloch & Lazareff (ll94 (1994),ll95 (1995)). In this mechanism, the incident photons from neighboring bright stars ionize the gas at the globule surface which thus begin to flow out. Moreover, the high pressure at the globule surface drives a shock wave into the globule which compresses the molecular gas. Such compression can lead to the formation of new stars at the globule head, whereas the external layers of the cloud continue being photo-evaporated. As a result of this mechanism, as first noted by Sugitani et al. (1989), the ratio of the stellar luminosity to the mass of the cloud is found to be much higher (0.3– 13 ) in cometary clouds than in nearby isolated dark clouds (0.03– 0.3 ). For the RNO 6 and RNO 6 NW clouds, the ratio is 3 and 0.3, respectively, which confirms that star formation has been triggered by the action of some external luminous stars in RNO 6, and very probably in RNO 6 NW.
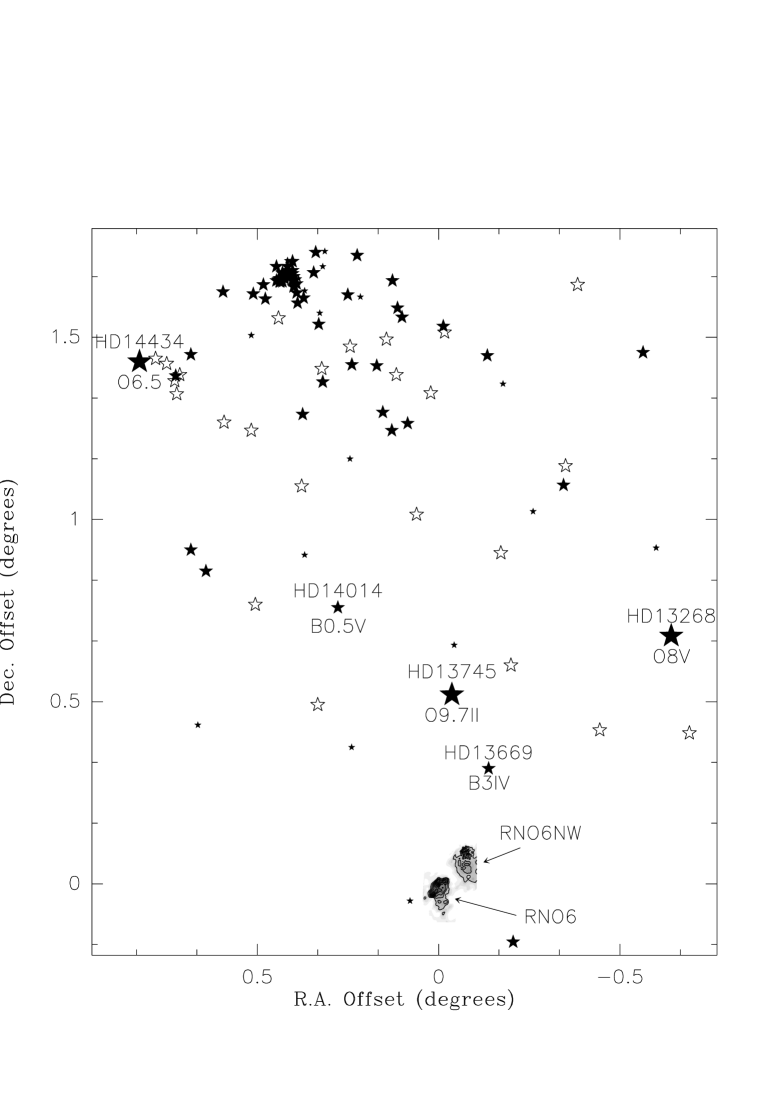
The cometary structures of both RNO 6 and RNO 6 NW clouds are elongated north-south with the heads oriented to the north. Moreover, the northern edge of the RNO 6 cloud exhibits bright H2 emission (feature F in Fig. 2), suggesting that a shock wave could be propagating from north to south. We thus explored the region north of these clouds for the presence of massive stars, and we found that the double cluster and Persei (NGC 869 and NGC 884) lies 1.5∘ away from the clouds. The double cluster is believed to be the core of the large OB association Per OB1 (see e.g. Cappa & Herbstmeier, ca00 (2000), and the references therein). Fig. 8 shows all the known OB stars in a 2∘ region to the north of RNO 6 clouds. O stars are denoted by big filled stars, B3 or earlier B stars by medium filled stars, and B stars later than B3 by small filled stars. White (unfilled) stars represent B stars for which the exact spectral class is unknown. Clearly these stars can be responsible for an intense UV field at the heads of the RNO 6 and RNO 6 NW clouds.
We estimated the ionizing UV photon flux at the cometary heads of the RNO 6 and RNO 6 NW clouds due to the earliest type stars in the region – including those marked with their names and spectral types in Fig. 8– by using the stellar properties listed by Panagia (pa73 (1973)), and by assuming that all stars and both molecular clouds are in the same plane perpendicular to the line of sight. We obtain that the Ly-c flux incident on the cloud heads is 6108 cm-2s-1. But it should be noted that this is a very rough estimate of the actual UV flux because of several reasons. First there are many B stars whose exact sub-classification is unknown, and every B0–B1 type star can contribute up to a few percent of the total flux. Second, very distant stars out from the field covered by Fig. 8 can have a significant contribution if they are of early types. Third, we have assumed all stars in the same plane which is an obvious simplification. In any event, we believe this flux to be accurate within a factor of 5. As we next discuss, this flux of UV photons is large enough to cause the observed cometary structures.

Since the RDI mechanism is well documented in the literature, we looked for the best RDI model that would match the observed morphology and kinematics of the RNO 6 and RNO 6 NW clouds. We found that model 2 of Lefloch and Lazareff (ll94 (1994), hereafter LL94) is in striking agreement with our observations. In fact, several aspects of the morphology and kinematics of both RNO 6 and RNO 6 NW clouds are in very good agreement with the structure of a cloud at the re-expansion phase described in model 2 of LL94:
1.- The general appearance of both RNO 6 and RNO 6NW molecular clouds is very similar to that of the model 2 globule at the re-expansion phase.
2.- There is a clear velocity gradient in the north-south direction of both RNO 6 and RNO 6NW clouds (as seen in Fig. 6, and described in Sect. 4.1). In model 2 (LL94), such gradients are caused by the acceleration of the gas along the tail of the globules.
3.- Line broadening can be seen at the heads of both molecular clouds (see Fig. 6). In model 2 (LL94), such a broadening is indeed predicted, it results from the expansion of the forward and backward sides of the globule’s head.
4.- The position of the CO peak is situated about 60 below the surface of the cometary bright rim of these clouds. This maximum density point is not immediately behind the bright rim (as expected for the quasi-stationary state) but further behind.
Although the model predictions of LL94 are in the context of small cometary globules it has been suggested that the model can be applied to a different case with an appropriate scaling of the parameters. The corresponding scaling factor is denoted by . The meaning of this factor is such that in order to match the parameters of any cloud with the model, the size and the age of the cloud described in model 2 (LL94) have to be multiplied by a factor of , the mass by a factor , and the cloud density and the incident Ly-c flux by a factor . For the case of the molecular clouds discussed here, the matching of the sizes and masses of the RNO 6 and RNO 6 NW clouds with those of the model leads to a scaling factor 4. Then we find that the required Ly-c flux incident on the clouds surface is 5.5 cm-2s-1, in general agreement with the estimate made from the fluxes of the neighboring stars. The age resulting from the model, i.e. the duration of the photo-ionization phase, is 1.3 Myr.
Further comparison of the observations and the model provides additional pieces of information. For instance, the sign of the head-tail velocity gradient can be used to infer the position in space of the cometary clouds. The red-shifted gradient in RNO 6 indicates that the tail is pointed towards us, whereas the blue-shifted gradient in RNO 6NW indicates that it is pointing away from us. The observed magnitude of the velocity gradient corresponds to a kinematical timescale of tkin1.4 Myr, in very good agreement with the value of 1.3 Myr obtained for the duration of the photo-ionization phase. This timescale is also consistent with the ages of the and stellar clusters, which are of the order of 6 and 3 Myr respectively, according to Tapia et al. (1984). We thus believe that 1.3 Myr can be considered as a good estimate of the time spent by these clouds under the incidence of strong UV flux.
Additional support for triggered star formation in the RNO 6 cloud comes from the distribution of young stars in the cloud’s head. In Fig. 4 we can see that the distribution of the stars are elongated or fan out towards the north away from the IRAS source. The only star with H emission in this cluster is the RNO 6 object itself which is the southernmost member of the cluster. The spatial coincidence of the IRAS source with the H emission star suggests the relative youth of this star with respect to other cluster members. Also, the IRAS source and the two stars with associated nebulous filaments are situated inside the C18O contours that represent the densest portion of the cloud, which confirms the relative youth of these near-IR sources. The placement of bluer stars closer to the surface of the cloud’s head and redder stars away from the cometary head, but closer to the IRAS source and C18O maximum, is a strong indication of triggered sequential star formation (see also Sugitani et al. sug95 (1995)).
Many cometary globules have been observed until now in different evolutionary stages. Cometary globules that also agree with model 2 of LL94 have been found near the Rosette nebula (Patel et al. patel93 (1993), White et al. white97 (1997)) and near the Gum Nebula (González-Alfonso et al alf95 (1995)). Some of these globules harbor stars and some times bipolar outflows (Nielsen et al. niel98 (1998), Cernicharo et al. cer92 (1992), Codella et al. cod01 (2001)). However, in all cases mentioned above the globules are low mass objects (up to tens of solar masses) containing stars of masses around 1 M☉. In contrast, the RNO 6 and RNO 6NW clouds, with 200 M☉ each (as estimated from 13CO), are higher mass counterparts to these cometary globules studied before. A precedent to such high mass objects is the 135 M☉ globule studied by Lefloch et al. (le97 (1997)) in IC 1848. It thus appears that the RDI mechanism is able, not only to form low-mass stars in small globules, but also to form intermediate mass stars and small clusters in massive molecular clouds.
6 Conclusions
We have presented mm-wave line observations of the molecular clouds around RNO 6. The main results of this work can be summarized as follows:
-
•
We have mapped the molecular cloud harboring RNO 6 along with a newly detected molecular cloud northwest of RNO 6 which has been named RNO 6 NW.
-
•
These clouds RNO 6 and RNO 6 NW display striking similarities in their cometary structures and overall kinematics. By using 13CO line observations, we estimate that both clouds have similar sizes (4.5 pc) and masses (200 M☉).
-
•
Both molecular clouds RNO 6 and RNO 6 NW are active in star formation. From new near-IR narrowband images, we confirm that RNO 6 hosts an embedded IR cluster that includes a Herbig Be star. A conspicuous H2 filament is found to delineate the dense cometary head of the globule.
-
•
RNO 6 NW hosts at least two IR sources and a bipolar molecular outflow 0.9 pc of length and 0.5 M☉ of mass.
-
•
The cometary structure of both clouds RNO 6 and RNO 6 NW has been created by the UV radiation from numerous OB stars lying 1.5∘ to the north. Such OB stars are associated with the double cluster and Persei, and are probably members of the Per OB1 association.
-
•
Star formation inside these molecular clouds has been very likely triggered by the Radiation Driven Implosion (RDI) mechanism. From comparison with RDI theoretical models, we find that the similar kinematics and morphology of both clouds is well explained if they are at a re-expansion phase.
-
•
Triggered sequential star formation also explains the observed spatial distribution of the members of the near-IR cluster inside the RNO 6 cloud, and the morphology of the H2 filament.
-
•
The RNO 6 and RNO 6 NW clouds are high-mass counterparts to the cometary globules of smaller masses which have been studied up to now. Thus our observations demonstrate that the RDI mechanism can produce, not only low mass stars in small globules, but also intermediate mass stars and clusters in massive clouds.
Acknowledgements.
The authors are grateful to Dr. M. Pérez Gutiérrez for help with the mm-wave observations, to Dr. C. J. Davis for help with the near-IR observations, to Dr. B. Lefloch for useful discussions, and to the referee, Dr. W.H. McCutcheon, for careful reading the manuscript and for valuable comments and suggestions. The SIMBAD database is operated by the CDS, Strasbourg, France. The United Kingdom Infrared Telescope is operated by the Joint Astronomy Centre on behalf of the U.K. Particle Physics and Astronomy Research Council. This research have been partially supported by Spanish DGES grant AYA2000-927.References
- (1) Bachiller R. 1996 ARAA, 34, 111
- (2) Bachiller R., & Cernicharo J. 1986, A&A, 166, 283
- (3) Bachiller R., & Tafalla M. 1999, in The Origins of Stars and Planets, Eds: Lada C. J., & Kylafis N., Kluwer Acad Publ, p 227
- (4) Bertoldi F., & McKee C. F. 1990, ApJ, 354, 529
- (5) Burton W. B. 1974, in Proc. IAU symp. 60, Eds. Kerr, J.F, & Simon C. S., D. Reidel Pub Co., p 551
- (6) Cappa C.E., & Herbstmeier U. 2000, AJ, 120, 1963
- (7) Cernicharo J., & Guélin M. 1987, A&A, 176, 299
- (8) Cernicharo J., Bachiller R., Duvert G., González-Alfonso E., & Gómez-González J. 1992, A&A, 261, 589
- (9) Codella C., Bachiller R., Nisini B., Saraceno P., Testi L. 2001, A&A, 376, 271
- (10) Cohen M. 1980, AJ, 85, 29C
- (11) Frerking M. A., Langer W. D., & Wilson R. W. 1982, ApJ, 262, 590
- (12) Fuente A., Neri R., Martín-Pintado J., Bachiller R., Rodríguez-Franco A., & Palla F. 2001, A&A, 366, 873
- (13) Gyulbudagyan A. L., & Magakyan T. Y. 1977, Pis’ma Astron. Zu., 3, 113-116
- (14) González-Alfonso E., Cernicharo J., & Radford S. J. E. 1995, A&A, 293, 493
- (15) Hartigan P., Raymond J., & Meaburn J. 1990, ApJ, 362, 624
- (16) Hawarden T. G., & Brand P. W. J. L. 1976, MNRAS, 175, 19
- (17) Lefloch B., & Lazareff B. 1994, A&A, 289, 559
- (18) Lefloch B., & Lazareff B. 1995, A&A, 301, 522
- (19) Lefloch B., Lazareff B., & Castets A. 1997, A&A, 324, 249
- (20) Neckel T., & Staude H. J. 1984, A&A, 131, 200
- (21) Nielsen A. S., Olberg M., Knude J., & Booth, R. S. 1998, A&A, 336, 329
- (22) Panagia N. 1973, AJ, 78, 929
- (23) Patel N. A., Xie T., & Goldsmith P. F. 1993, ApJ, 413, 593
- (24) Reipurth B. 1983, A&A, 117, 183
- (25) Richer J., Hills R. E., & Padman R. 1992, MNRAS, 254, 525
- (26) Scarrott S. M., Brosch N., Ward-Thompson D., & Warren-Smith R. F. 1986, MNRAS, 223, 505
- (27) Sugitani K., Fukui Y., Mizuni A., & Ohashi N. 1989, ApJ, 342, 87
- (28) Sugitani K., Tamura M., & Ogura K. 1995, ApJ, 455, L39
- (29) Tapia M., Roth M., Costero R., & Navarro S. 1984, RMxAA, 9, 65
- (30) Thé P. S., de Winter D., & Pérez M. R. 1994, A&AS, 104, 315
- (31) Testi L., Palla F., Prusti T., Natta A., & Maltagliti S. 1997, A&A, 320, 159
- (32) Testi L., Palla F., & Natta A. 1998, A&AS, 133, 81
- (33) Testi L., Palla F., & Natta A. 1999, A&A, 342, 515
- (34) Weaver W. B., & Jones G. 1992, ApJS, 78, 239
- (35) White G. J., & Gee G. 1986, A&A, 156, 301
- (36) White G. J., Lefloch B., Fridlund C. V. M., Aspin C. A., Dahmen G., Minchin N. R., & Huldtgren M. 1997, A&A, 323, 931