Sub-structure of the outer Galactic Halo from the 2 Micron All Sky Survey††thanks: This publication makes use of data products from the Two Micron All Sky Survey, which is a joint project of the University of Massachusetts and the Infrared Processing and Analysis Center/California Institute of Technology, funded by the National Aeronautics and Space Administration and the National Science Foundation.
Abstract
A pole-count analysis of the infrared 2MASS survey is presented, in order to identify faint stream-like structures within the halo of the Milky Way. Selecting stars with colours consistent with M-giant stars, we find a strong over-density of sources on a stream with pole , which corresponds to the pole of the orbit of the Sagittarius dwarf galaxy. This great-circle feature of width , contains % of the late M-giants in the Halo. No other stream-like structures are detected in M-giants in the 2MASS Second Incremental Data Release (2IDR), and in particular, we find no evidence for a stellar component to the Magellanic Stream. This suggests that the present accretion rate of low-mass satellites with a luminous component is very low, and the formation of the luminous component of the Halo must have been essentially complete before the accretion of the Sagittarius dwarf galaxy, more than ago. We also search for great-circle streams using almost all high-latitude () sources in the 2IDR dataset. No narrow great-circle streams of width – were found, though we were only sensitive to relatively nearby () remnants of massive () globular clusters. If the Galactic potential is close to being spherical, as some recent observations suggest, the lack of observed great-circle streams is consistent with the presence of dark matter substructures in the Halo. Although alternative explanations cannot be ruled out from our analysis of the 2IDR dataset, future experiments with better statistics have the potential to reveal the heating effect of dark matter substructure on stellar streams.
keywords:
halo — Galaxy: structure — Galaxy1 Introduction
According to our current understanding of the formation of galaxies, galaxy halos build up over time by the continued accretion of smaller galactic or sub-galactic structures (Cole et al., 1994). Of the theories that quantify this formation process, the Cold Dark Matter theory gives at present the best explanation of available data, but there are several inconsistencies in this picture that remain to be explained. Possibly the most troublesome of these is the inconsistency between the predicted and observed density profiles of galaxy halos. CDM predicts strongly centrally-peaked ( to ) mass distributions (Navarro, Frenk & White, 1997; Moore et al., 1999a), contrary to what is inferred from the slowly-rising rotation curves of highly dark matter dominated dwarf disk galaxies (Côté et al., 2000; de Blok et al., 2001; Marchesini et al., 2001). Another problem is the apparent disagreement between the expected number of sub-structures in CDM halos compared to the visible substructures in the halos of real galaxies (Klypin et al., 1999; Moore et al., 1999b, 2001). It appears that a proper treatment of the ionizing effect of the intergalactic UV background, which disperses the baryonic component of low mass proto-galaxies into the intergalactic medium, can explain the absence of copious low-mass substructures in galaxy halos (Bullock et al., 2000; Somerville, 2001; Tully et al., 2001). There is also some concern that current cosmological simulations are of insufficient resolution: for instance, one needs excellent numerical resolution to properly resolve the wakes in the dark matter distribution which give rise to dynamical friction. If the resolution is not high enough, dynamical friction will be artificially low, and structures will take longer to merge than they would in reality (van Kampen, 2000).
Further observations are required to help resolve these issues with CDM or to guide galaxy formation theory. Data that constrain the structure of the luminous and dark matter in the inner regions of galaxies are relatively easy to obtain, but in those regions the dynamical times are short and much of the detailed information about the formation of the galaxy has been phased-mixed and is now largely lost. In the outer regions of galaxies, typical dynamical mixing timescales are long, and so valuable information on the formation of the galaxy can be recovered, if only we can find tracer material or dynamical probes. This is, of course, the challenge of studying the halos of galaxies: their very low surface brightness renders them unobservable, in general, to present instrumentation.
One solution to this problem is to study the halo of the Milky Way and other nearby galaxies, where the halo stars are resolved. Radial velocities can be obtained in this situation to complement the starcounts data, allowing detailed dynamical modeling of the stellar population. In this way one can study the structure and substructure of the underlying dark matter even if it is not traced by stars. The nearby universe therefore gives us a unique and more complete view of the dark matter, which we cannot gain from statistical studies of more distant systems. The richness of the information in this region will be even more striking after the completion of the astrometric satellite missions GAIA and SIM: we will then also have precise measurements of the transverse motion of a huge sample of Galactic and Local Group stars.
In a companion paper (Ibata, Lewis & Irwin 2002; Paper 1), we discuss the possibility of using narrow tidal streams from defunct globular clusters to ascertain the lumpiness of galactic halos. We show that the heating due to repeated close encounters with the dense dark matter clumps predicted by CDM and other structure formation theories spread an otherwise narrow tidal stream into a coarse band. Individual streams from the expected population of tidally destroyed globular clusters should be readily detectable with the GAIA all-sky survey and the effect of the broadening of the globular-cluster tidal stream should be a strong effect if CDM predictions are correct. The GAIA dataset will be by far the most efficient way to reveal these ancient tidal streams, since there will be proper motion measurements, radial velocities as well as a good spectral energy distribution from multi-band photometry. The kinematic data will allow selection of stars in a 5-dimensional phase-space (perhaps even in 6-dimensions for nearer streams for which parallax measurements are possible).
However, most of the giant-branch stars of the streams that will be detected by GAIA have already been cataloged in current all-sky surveys. Ancient accretions of low-mass galaxies and globular clusters in the outer halo of the Milky Way should give rise to long stellar streams (Johnston, Hernquist & Bolte, 1996). These streams may be detected by searching for long band-like overdensities on the sky if the Halo potential is not very flattened.
In this contribution we undertake a preliminary analysis of the 2 Micron All Sky Survey (2MASS) to investigate if any streams can be identified from sky position together with simple colour-magnitude cuts that reject foreground contamination. Our two-dimensional search is therefore only likely to recover the structures of greatest contrast over the background.
Some tidal streams from disrupting stellar systems have already been identified. Leon, Meylan & Combes (2000) have found low-level tidal streams around several globular clusters, and another very nice example has been revealed by the Sloan Digital Sky Survey (Odenkirchen et al., 2001). These globular cluster streams, however, are a most a few degrees long and it has not been possible to trace them over a large extent on the sky, which is needed if we are to be able to probe the lumpiness of the halo dark matter. Large-scale tidal streams of more massive systems such as disrupted dwarf galaxies have also been found. In another companion paper (Ibata et al., 2001a), we analysed the distribution of Carbon stars (C-stars) in the halo of the Milky Way, and found that more than half of these are distributed along a great circle on the sky. These C-stars trace the tidal stream of the Sagittarius dwarf galaxy, which has been disrupted over the course of its many close encounters with the Milky Way. In extragalactic systems, huge tidal streams have been found around NGC 5907 (Shang et al., 1998) and M31 (Ibata et al., 2001b).
2 Sample 1: selection of late M-giant Halo stars
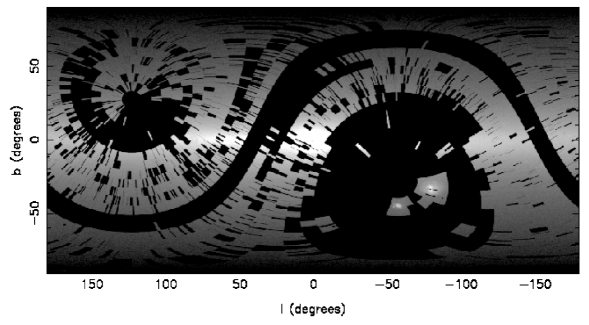
The dataset we use is the Second Incremental Data Release (2IDR) of the 2MASS project. 111see http://www.ipac.caltech.edu/2mass This release covers 47% of the sky in a rather patchy fashion, as can be seen from Figure 1, which shows the density of point-source detections with (the 10 sigma limit of the 2MASS photometry). The vast majority of the stars in Figure 1 belong to the Galactic disk and bulge; these outnumber spheroid stars by several orders of magnitude. They are the background “noise” that has to be removed, or accurately modelled out, from the sample.
Since the structures we are interested in revealing are at large distances in the Halo, it is convenient to remove first the disk stars from the 2MASS sample. To do this we took advantage of the structure of the , colour-colour diagram. As shown by Bessel & Brett (1988), dwarf and giant stars beyond M1 separate cleanly, the M-giants being 0.1 to 0.3 magnitudes redder in than M-dwarfs at a given colour. Selecting stars with , , and removes 99.9% of all of the 2IDR 2MASS point-source detections, the majority of which are nearby disk dwarfs. (The colours were corrected for interstellar reddening by interpolating in the IRAS-DIRBE reddening map of Schlegel et al. (1998), using , , ). Though the relative fraction of dwarf and giant stars in the disk and spheroid may be similar, by selecting only giant stars, we are able to clean much of the disk contribution to the high-latitude sky, but even with this cleaning we find that the contamination at 20–30 degrees from the Plane is still sufficiently high that we are restricted to using a sample with .
Given a characteristic absolute magnitude of RGB M-giants of (Nikolaev & Weinberg, 2000), the bright limit of of the 2MASS data corresponds to a lower distance limit of for the giant stars. This distance is more than three thick disk scale-heights ( Reylé & Robin 2001) for . (The 2MASS faint limit of corresponds to an upper distance limit of .)
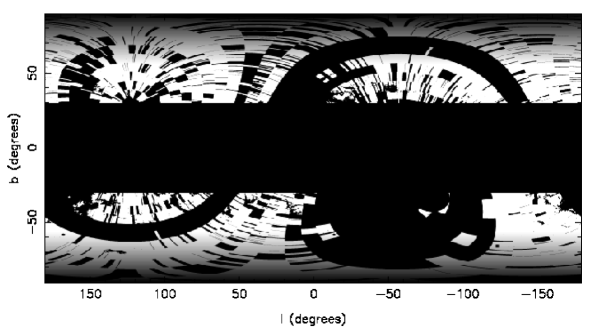
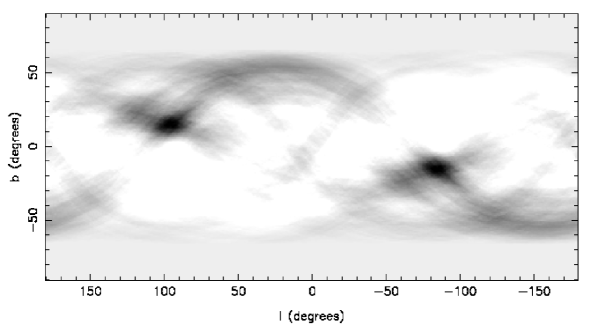
We decided to ignore the data at Galactic latitudes lower than , as contamination from the Galactic thick disk begins to be significant below that latitude. Strong reddening can move dwarfs in the region of the colour-colour diagram inhabited by giants, so we also excised from our final dataset all regions of the sky where the reddening deduced from the IRAS-DIRBE map of Schlegel et al. (1998) exceeded . Because of this reddening cut, and to maintain a homogeneously deep map, we further restricted the K-band limit to . At Galactic latitudes , the area of sky which is removed by this extinction cut is very small () and is confined to regions around nearby molecular clouds. Finally, two more regions are cut out of the dataset: a circular region of radius around the LMC and SMC. The resulting map is shown in Figure 2, which shows the 1106 point-sources on the sky that remain after these various cuts; the area of sky available for analysis (see Figure 3) is %.
| parameter | value | |
|---|---|---|
3 Pole-count analysis of sample 1
One way to identify long band-like structures is through a pole-count analysis. The pole-count analysis is very simple: the number of sources situated within a band centered on a great circle on the sky is counted up, and assigned to the corresponding pole. This is repeated for all possible poles. In this way, a band-like structure on the sky becomes two peaks in the pole-counts diagram (two peaks due to the symmetry of the mapping), whereas a localised peak in counts on the sky becomes two bands in the pole counts diagram. Due to the complicated irregular nature of the window function, it is more convenient to perform the pole-counts on binned data: to this end we binned up the sky into a rectangular grid. To correct for the sky regions for which we have no data, we add in the average number density of sources into each pixel in the image (see Figure 3).
The pole-counts analysis is particularly powerful if the underlying potential in the region of the Galaxy inhabited by the stream is spherical, in that case the stellar stream does not precess and it remains on a great circle on the sky forever. In a halo with a flattened potential, differential precession will eventually phase-mix the stream, thereby filling the box-orbit. In this situation, only strong recent accretions would be detected by the pole-counts technique.
Fortunately for the pole-counts method, the outer regions of the Milky Way appear to have an almost spherical potential. The evidence for this comes partly from the great-circle distribution of C-stars from the tidal stream of the Sagittarius dwarf galaxy (Ibata et al., 2001a), and also from the distribution of metal-poor spheroid stars towards of the inner Halo region surveyed by Chiba & Beers (2001).
The free parameter that we need to choose is the width of the equatorial bands. Clearly, narrow bands are better suited to identify narrow structures. We chose not to probe band widths below ; this was motivated by the simulations of Paper 1, where model globular clusters gave rise to stream widths of (equivalent to at ). The analysis was repeated with band widths , and peaks above the background were identified in each polecounts image. The result of the pole-count for a band width of (which gives the highest S/N peak) is shown in Figure 4. Of our Halo sample of 1106 sources, % are located within this band, compared to % that would be expected from a Poisson distribution. How significant is this peak given the strange window function of the 2IDR data? To answer this question, we have performed 1000 Monte-Carlo simulations, drawing in each case 1106 random points over the sky within the data regions displayed in Figure 3. The analysis was repeated in exactly the same way as for the real data, searching for peaks in the pole-counts diagram. In the 1000 simulated datasets, the highest deviation was a % peak, found at an location far from the Sgr pole. Interpreting this maximum random deviation as a peak, implies that the peak in the pole-counts distribution detected in Figure 4 has a significance of and is therefore clearly real.
4 Sample 2: almost no restrictions
In selecting only late M-giant stars from the 2MASS dataset, we previously retained only a small fraction of the full sample of Halo stars observed by that survey. To try to overcome this handicap, we undertook a second analysis, this time with a much broader colour selection, aimed at including K-stars and early M-stars as well as late M-stars selected for the previous sample. The selection criteria are simple colour limits: , ; a faint magnitude limit: ; and a selection of only low extinction sky . Selecting from the high latitude sky () in the 2IDR with these criteria gives a much larger sample of point sources. The challenge now is to be able to extract a stream population with at most a few thousand sources from such a numerous foreground population.
To successfully identify streams with the polecounts method, we need to model out these contaminants. However, the distribution of Galactic sources is not uniform, and it is only approximately symmetric about the Galactic major and minor axes. We found that it was necessary to create a model of the smooth Galactic foreground which was able to follow the variations on a scale of ; smoother models give rise to unacceptably large residuals which dominate the subsequent polecounts. The complex 2IDR window function also makes it difficult to fit an accurate model: e.g., polynomial fits of high enough order to follow the Galactic variations tend to blow up in the unconstrained regions, leaving systematic residuals around the holes.
By trial and error, we managed to construct an acceptable model of the Galaxy by smoothing the data. However, to avoid edge effects around the holes in the 2IDR dataset, the holes needed to be filled before this smoothing operation. The empty regions were filled preferentially with data from the symmetric pixel reflected about , otherwise by data from the pixel reflected about or the pixel reflected about and . After this operation, 8.6% of the sky still lacked data; these remaining holes were filled with a Poisson random deviate drawn from a third order polynomial fit to each longitude line separately. The resulting all-sky image was smoothed with a bi-linear kernel (taking the average of counts within of the median).
An image of the difference between the original dataset and the smoothed model was created and the window function was reinserted into the image. This difference image is now flat to %. The difference image was smoothed again with a bi-linear kernel, but this time, those regions with data on either side of a hole were (for the purposes of the smoothing) made contiguous. After removing this smoothed model, the final dataset is flat to %.
This image of the residuals of the 2IDR from a smoothed model is appropriate for searching for narrow great-circle streams of width up to . Polecounts diagrams were computed for bands of , and . Within a wide band (1.7% of the sky) stars are expected, on average, with variations of counts. The corresponding polecounts diagram had an R.M.S. dispersion counts, close to this Poisson limit. Since wide bands will give rise to wide peaks in the polecounts image, there are “meta-pixels” in that image, so peaks are required to reject most false detections due to random noise. There is a single peak with more than 1800 counts, which appears as an arc in the polecounts diagram near . The feature is clearly not real, however, as the corresponding equatorial band passes through a long narrow gap in the window function that skims the outer bulge of the Milky Way (near ). The polecounts peak disappears if we remove this small region of sky from the analysis, so the peak is clearly an artifact of insufficient accuracy in the smooth Galaxy model in that region.
With very narrow bands, the R.M.S. dispersion of the polecounts image was counts, so streams with a few as 860 stars could, in principle, have been detected. No such peaks were detected, however.
5 Discussion
5.1 Wide streams from disrupted dwarf galaxies
The 2MASS 2IDR data reveal a strong overdensity along the great circle track of the Sgr dwarf galaxy. Indeed, the pole-counts diagram of Figure 4 is very similar to that found by Ibata et al. (2001a) from Halo C-stars. M-giants are potentially older stars than C-stars, and as such they can be useful in the context of analysing the Sgr stream, allowing us to probe the stars which were stripped from the dwarf galaxy at earlier stages in the disruption. To constrain this possibility, the radial velocities of the M-giants needed to be measured.
For bands of width , the Sgr polecounts peak breaks up into several lower peaks, presumably because the orbit is not precisely on a great circle. This could potentially be due to a flattening of the Galactic potential (the Galactic disk clearly provides non-radial forces); an analysis of this effect could be attempted with the full 2MASS dataset.
It is surprising not to have found stream-like structures in the Halo from other dwarf satellites, such as the Magellanic Clouds. Our previous polecount analysis of Halo C-stars provided a hint that the Magellanic Stream had been detected. Despite the better statistics, we have not been able to confirm that tentative detection. It is possible that this reflects a difference in stellar populations between the Sagittarius and Magellanic streams, the latter possibly being richer in C-stars due to younger age. Another explanation is that the current sky coverage excludes most of the region in and around the Magellanic Clouds, this makes the detection of the Magellanic Stream unlikely with the current dataset if the stars are distributed in a similar fashion to the gas in the Magellanic Stream.
Our models of the disruption of the Sgr dwarf suggest that the streams are very long lived, remaining coherent for a large fraction of a Hubble time. However, differential precession can cause a stream to smear out over the sky, until the box orbit is filled up entirely. Two possibilities present themselves. Either the Halo is fairly flattened, contrary to the results of Ibata et al. (2001a) and Chiba & Beers (2001). In this case streams precess quickly, and pole-counts give us a snapshot of accretions that have taken place only very recently, on a timescale of or less (depending on the orbit). If the Halo is close to being spherical, polecounts give us access to much more ancient accretion events. Without a conclusive measurement of the flattening of the Halo, we cannot place strong constraints on the merging rate onto the Milky Way.
However, assuming that the M-giant stellar population in the Sagittarius stream is representative of other accretions, it appears that there has been no other more massive accretion than the Sgr dwarf () since that galaxy was accreted. The timescale for the accretion of the Sagittarius dwarf must be long, of order several Gyrs, as it takes of order – in the simulations (Ibata & Lewis, 1998; Ibata et al., 2001a) for tidal tails to wrap around the Milky Way and appear as a band on the sky.
5.2 Narrow streams from disrupted globular clusters
As we show in Paper 1, the structures of particular interest are stellar streams from low mass systems such as globular clusters. These give fine structures in phase-space which easily become dispersed if there is significant substructure in the Halo. No large scale stream other than that of the Sgr dwarf was identified in the sample of late M-giant stars from the 2MASS 2IDR dataset above the level.
With our late M-giant sample, the detection level corresponds to only 9 stars at the finest band resolution adopted (). The lack of detections reflect the fact that our M-giant selection criteria, which aimed to get rid of disk dwarfs, are very restrictive. A vast number of Halo K (and early M) giants were removed in this process leaving only a small number of Halo stars in the final sample. Applying our selection criteria to the 2MASS data of the massive () globular cluster Omega Centauri (distance ) yields a total of stars outside two core radii, or 5.8 stars correcting for the lack of data in the saturated central regions of the cluster. Only 1 in 2000 stars above the magnitude limit of are kept after the colour-cut (though the stars that are retained are very luminous, and could be detected out to beyond ). So it is not surprising that we have not found globular cluster streams in the first sample, as the tidal stream of a completely disrupted globular cluster of the size of Omega Centauri would have insufficient late M-giant stars to bring the contrast of a polecounts peak above the detection level.
The inclusion of Halo K-giants and early M-giants is needed to obtain high enough to make a useful statement about dark matter clumpiness. Our second analysis, with a sample selected with practically no colour restrictions, aimed to improve the statistics for narrow streams. However, no streams were detected above the level, even though we had the capability of identifying narrow streams with as few as stars with the narrowest band we probed (). For comparison, Omega Centauri would provide a stream of stars in 2MASS, if it were located at a distance of , though the % sky coverage of the region of the 2IDR dataset reduces this number to stars.
The detection of a dynamically cold thin stellar stream in the 2IDR would have called into question the existence of dark matter substructure. Our null detection is much less clear to interpret, however. We can rule out the existence of only very massive globular cluster streams (as massive as Omega Centauri), that are relatively nearby (), and that are confined to very narrow great circle bands (). This may mean that massive globular clusters are rare, or that the Galactic potential is significantly flattened at these radii, or that the potential has evolved substantially since the disruption of these stellar systems.
Future experiments will help solve this question. By reanalysing the full 2MASS dataset, a times larger area of sky can be surveyed for streams (not times larger, since low latitude disk fields will likely be too complex to model). With that data in hand it may be possible to improve the stream detection limits by an order of magnitude, especially if the foreground Galactic component can be more accurately modelled in the absence of the complex 2IDR window function (which we believe was the primary obstacle in not reaching the Poisson noise limit in the polecount analysis). Other purely photometric experiments, such as the VISTA 222see http://www.vista.ac.uk survey or the PRIME 333see http://prime.pha.jhu.edu/primemission.htm mission, will also greatly improve stream detection limits due to improved statistics resulting from a much greater photometric depth than 2MASS. Larger gains will come from the addition of astrometric information. A first step will be to use proper motions derived from photographic plates (provided, for example by the GSC II 444see http://www-gsss.stsci.edu/gsc/gsc2/GSC2home.htm), with which it will become possible to obtain a cleaner Halo sample by requiring that distant Halo stars have proper motions consistent with zero. The analysis of the datasets mentioned until now can provide information on Halo streams only for the restricted case that the Galactic potential is nearly spherical, when streams are spatially-confined bands on the sky. The advent of GAIA (Perryman et al., 2001), with its ability to accurately measure proper motions even for distant Halo stars, will permit the identification of streams even if the Galactic potential is substantially flattened, as the streams will be seen as phase-space clumps.
6 Conclusions
A pole-count analysis of Halo M-giants stars in the Second Incremental Data Release of the 2MASS dataset reveals a strong stream of stars along the orbit of the Sagittarius dwarf galaxy. The pole of the Sagittarius stream is located at exactly the position predicted by our previous analysis of Halo C-stars (Ibata et al., 2001a), confirming the existence of this large-scale stellar stream. This stream appears fairly narrow, in M-giants. The alignment of the narrow stream along a great circle rules out the possibility that the Halo mass distribution is highly flattenned, as shown in Ibata et al. (2001a). Future radial velocity measurements of these M-stars will easily allow us to discriminate stream from Halo or foreground stars. Our conclusion regarding the shape of the dark matter Halo will be strengthed if the stream stars are found to be distributed all around the great circle track.
Our main motive in undertaking this study was to identify kinematically cold streams from low mass systems such as globular clusters, which could be used to trace the substructure of the dark matter Halo. However, no globular cluster streams were identified in the sample of Halo late-type M-giants, though we argue that this is due to insufficient statistics in the sample. Neither were any streams detected in the second sample that contained K and M-giants (as well as numerous foreground stars). In this second sample, nearby () globular cluster streams, of mass similar to that Omega Centauri, and that are closely confined to a great circle () could have been detected. These stringent conditions greatly reduce the chances of detection of any Halo streams. In reality, even if the Halo is spherical, the flattened potential of the Galactic disk will cause some precession, especially to nearby streams. Also, the Sun’s displacement away from the center of the Galactic potential means that only very distant streams can be located precisely on great circles.
Better statistics are needed to allow the detection of globular cluster streams on wider great-circle bands, and deeper datasets are needed to probe more distant orbits. It will certainly be possible to improve this analysis in the near future with the full sky 2MASS catalog, and better dwarf star rejection can be provided by proper motion selection (derived from the GSC-II catalog, for instance). In the longer term, the next generation of IR surveys (e.g., VISTA, PRIME), and the next generation of astrometric surveys (e.g., DIVA, GAIA) will greatly improve the number of faint Halo sources and allow us to identify individual streams from their photometric and kinematic signatures.
References
- Bessel & Brett (1988) Bessell, M. S., Brett, J. M. 1988, PASP 100, 1134
- de Blok et al. (2001) de Blok, W., McGaugh, S., Bosma, A., Rubin, V. C. 2001, ApJ 552, L23
- Van den Bosch et al. (2000) van den Bosch, F., Robertson, B., Dalcanton, J., de Blok, W. 2000, AJ 119, 1579
- Bullock et al. (2000) Bullock, J., Kravtsov, A., Weinberg, D. 2000, ApJ 539, 517
- Chiba & Beers (2001) Chiba, M., Beers, T. C. 2001, ApJ 549, 325
- Cole et al. (1994) Cole, S., Aragon-Salamanca, A., Frenk, C., Navarro, J., Zepf, S. 1994, MNRAS 271, 781
- Côté et al. (2000) Côté, S., Carignan, C., Freeman, K. 2000, AJ 120, 3027
- Dehnen & Binney (1998) Dehnen, W. & Binney, J. 1998, MNRAS 294, 429
- Gnedin & Ostriker (1997) Gnedin, O., Ostriker, J. 1997, ApJ 474, 223
- Hernquist (1993) Hernquist, L. 1993, ApJSupp 86, 389
- Ibata & Lewis (1998) Ibata, R., Lewis, G. 1998, ApJ 500, 575
- Ibata et al. (2001a) Ibata, R., Lewis, G. F., Irwin, M., Totten, E., Quinn, T. 2001a, ApJ 551, 294
- Ibata et al. (2001b) Ibata, R., Irwin, M., Lewis, G., Ferguson, A., Tanvir, N. 2001b, Nature 412, 49
- Ibata, Lewis & Irwin (2002) Ibata, R., Lewis, G. F., Irwin, M. 2002, submitted
- Johnston, Hernquist & Bolte (1996) Johnstone, K. V., Hernquist, L., Bolte, M. 1996, ApJ 465, 278
- van Kampen (2000) van Kampen, E. 2000, astro-ph/0008453
- King (1966) King, I. 1966, AJ 71, 64
- Klypin et al. (1999) Klypin, A., Kravtsov, A., Valenzuela, O., Prada, F. 1999, ApJ 522, 82
- Leon, Meylan & Combes (2000) Leon, S., Meylan, G., Combes, F. 2000, A&A 359, 907
- Marchesini et al. (2001) Marchesini, D., D’Onghia E., Chincarini, G., Firmani C., Conconi, P., Molinari E., Zacchei A. 2001, astro-ph/0107424
- Moore et al. (1999a) Moore, B., Quinn, T., Governato, F., Stadel, J., Lake, G. 1999a, MNRAS 310, 1147
- Moore et al. (1999b) Moore, B., Ghigna, S., Governato, F., Lake, G., Quinn, T., Stadel, J., Tozzi, P. 1999b, ApJ 524, L19
- Moore et al. (2001) Moore, B., Calcaneo-Roldan, C., Stadel, J., Quinn, T., Lake, G., Ghigna, S., Governato, F. 2001, astro-ph/0106271
- Navarro, Frenk & White (1997) Navarro, J., Frenk, C., White, S. 1997, ApJ 490, 493
- Nikolaev & Weinberg (2000) Nikolaev, S., Weinberg, M. D. 2000, ApJ 542, 804
- Odenkirchen et al. (2001) Odenkirchen, M., Grebel, E., Rockosi, C., Dehnen, W., Ibata, R., Rix, H., Stolte, A., Wolf, C., Anderson, J., Bahcall, N., Brinkmann, J., Csabai, I.;., Hennessy, G., Hindsley, R., Ivezić, Z., Lupton, R., Munn, J., Pier, J., Stoughton, C., York, D. 2001, ApJ 548, L165
- Perryman et al. (2001) Perryman, M., de Boer, K., Gilmore, G., Høg, E., Lattanzi, M., Lindegren, L., Luri, X., Mignard, F., Pace, O., de Zeeuw, P. 2001, A&A 369, 339
- Reylé & Robin (2001) Reylé, C., Robin, A. C. 2001, A&A 373, 886
- Schlegel et al. (1998) Schlegel, D., Finkbeiner, D., Davis, M. 1998, ApJ 500, 525
- Shang et al. (1998) Shang, Z. et al. 1998, ApJ 504, 23
- Somerville (2001) Somerville, R. 2001, astro-ph/0107507
- Tully et al. (2001) Tully, B., Somerville, R., Trentham, N., Verheijen, M. 2001, astro-ph/0107538