The Inner Structure of Cold Dark Matter Halos
Abstract
I report on recent progress in our understanding of the structure of CDM halos, and in particular of the inner mass profile of galaxy-sized systems. Numerical simulations have consistently shown that the density profiles of CDM halos steepen monotonically from the center outwards, with slopes shallower than isothermal near the center and steeper than isothermal near the virial radius. Ongoing debate centers on the precise radial dependence of the logarithmic slope, as well as on whether it approaches a well defined asymptotic central value. The latest high-resolution simulations suggest that the circular velocity profile is well approximated by the model proposed by Navarro, Frenk & White (NFW). On the other hand, the radial dependence of the slope of the density profile differs modestly, but significantly, from the model proposed by NFW. As a result, NFW fits tend to underestimate the density at radii just inside the scale radius. Rather than implying a very steep () inner divergent slope, I argue that the data is actually best represented by a model where the density profile becomes increasingly shallow with radius, with little sign of approach to a well-defined asymptotic value. A model where the phase-space density profile is a power law accounts well for these results and suggests that the innermost slope may be as shallow as . These conclusions are supported by a thorough numerical convergence study that elucidates the effect of numerical parameters such as the timestep, gravitational softening, and particle number, on the mass profile of simulated dark matter halos.
Department of Physics and Astronomy, University of Victoria, Victoria, BC, V8P 1A1, Canada
1. Introduction
Cosmological N-body simulations have led to impressive strides in our understanding of structure formation in universes dominated by collisionless dark matter. The impact of such simulations has been greatest in the highly non-linear regime, where analytic calculations offer little guidance. Recently, and as a result of the development of efficient algorithms and of the advent of powerful, massively parallel computer arrays, it has been possible to apply N-body studies to detailed investigations of structure on small scales. These studies can now probe scales comparable to the luminous radii of individual galaxies, thus enabling direct comparison between theory and observation in regions where luminous dynamical tracers are abundant and easiest to observe. Predicting the structure of dark matter halos on kpc and sub-kpc scales, where it can be compared directly with observations of galactic dynamics, is one of the premier goals of N-body experiments, and there has been steady progress in this area over the past few years.
Building upon the early work of Frenk et al (1988), Quinn, Salmon & Zurek (1986), Dubinski & Carlberg (1991) and Crone, Evrard & Richstone (1993), Navarro, Frenk & White (1996, 1997, hereafter NFW) found that, independent of mass and of the value of the cosmological parameters, the density profiles of dark matter halos formed in various hierarchical clustering cosmogonies were strikingly similar. This ‘universal’ structure can be characterized by a spherically-averaged density profile which differs substantially from the simple power-laws, , predicted by early theoretical studies (Gunn & Gott 1972, Fillmore & Goldreich 1984, Hoffmann & Shaham 1985, White & Zaritsky 1992). The profile steepens monotonically with radius, with logarithmic slopes shallower than isothermal (i.e. ) near the center, but steeper than isothermal () in the outer regions.
NFW proposed a simple formula,
| (1) |
which describes the density profile of any halo with only two parameters, a characteristic density contrast111I use the term ‘density contrast’ to denote densities expressed in units of the critical density for closure, . I express the present value of Hubble’s constant as km s-1 Mpc-1, , and a scale radius, . Note that there is no well defined value for the central density of the dark matter, which can in principle climb to arbitrarily large values near the center. This is an important point, especially because there have been a number of reports in the literature arguing that the shape of the rotation curves of many disk galaxies rules out steeply divergent dark matter density profiles (Flores & Primack 1994, Moore 1994, McGaugh et al 1998, de Blok et al 2001).
The results of NFW have been confirmed by a number of subsequent studies (see, e.g., Cole & Lacey 1996, Huss, Jain & Steinmetz 1999, Jing & Suto 2000), although there is some disagreement about the innermost value of the logarithmic slope. Moore et al. (1998), Ghigna et al. (2000), and Fukushige & Makino (1997, 2001) have argued that density profiles diverge near the center with logarithmic slopes steeper than the asymptotic value of in NFW’s formula. Since steep inner slopes are apparently disfavored by rotation curve data it is important to establish this result conclusively; if confirmed, it may offer a way to falsify the CDM paradigm on small scales.
Unfortunately, observational constraints are strongest just where theoretical predictions are least trustworthy. For example, the alleged disagreement between observed rotation curves and cuspy dark halo models is most evident in sub- galaxies on scales of kpc or less. For typical circular speeds of km s-1, this corresponds to regions where the density contrast exceeds . Orbital times in these regions are of order of the age of the universe, implying that N-body codes must be able to follow particles accurately for several thousand orbits. Few cosmological codes have been tested in a systematic way under such circumstances. Extreme care is thus needed to separate numerical artifacts from the true predictions of the Cold Dark Matter model.
Furthermore, there are no simulations (with adequate resolution) of dark matter halos with masses comparable to the dwarf galaxies where the disagreement between theory and observation is most evident. So far, published work has relied upon extrapolation of results obtained for massive galaxy halos and galaxy clusters, hardly an ideal procedure for assessing the viability of the ruling CDM paradigm on small scales. In order to validate or ‘rule out’ the CDM cosmogony one must be certain that model predictions on the relevant scales are accurate, robust, and free of systematic numerical uncertainties.
2. Numerical Convergence Criteria
Motivated by this state of affairs, we have undertaken a large series of numerical simulations designed to clarify the role of numerical parameters on the structure of simulated cold dark matter halos. What regions of a simulated dark matter halo in virial equilibrium can be considered reliably resolved? Our tests explore the influence of the gravitational softening, the time-stepping algorithm, the starting redshift, the accuracy of force computations, and the number of particles on the spherically-averaged mass profile of a galaxy-sized halo in the CDM cosmogony. A thorough discussion of the tests is presented in Power et al (2001); I summarize below a list of conditions that must be satisfied in order to consider the mass profile reliably resolved at a given radius:
-
•
The timestep must be substantially shorter than the orbital timescale: , where is the total number of timesteps, is the circular orbit timescale, and is the virial radius, where the mean density contrast is . This criterion applies provided that the gravitational softening spline scalelength, , is chosen to ensure that particle discreteness effects are negligible, , where is the number of particles within the virial radius. Smaller softenings require substantially smaller timesteps for convergence.
-
•
Accelerations do not exceed a characteristic value imprinted by the circular speed of the halo, , and by the softening scale: , with .
-
•
Enough particles are enclosed so that the collisional relaxation timescale, , is comparable to the age of the universe, . Empirically, we find that regions where are adequately resolved. ( is the enclosed number of particles and is the usual Coulomb logarithm.)
Convergence also requires that at the initial redshift, , the linear rms fluctuations on the smallest resolved mass scale (the particle mass ) is , and that force calculations are highly accurate. Poor spatial, time, or force resolution leads generally to systems with artificially low central density, but may also result in the formation of artificially dense central cusps. This feature must be monitored carefully in hierarchical clustering simulations, since cusps formed in poorly-resolved high-redshift progenitors may survive merging and compromise the inner structure of present-day systems.
The most stringent requirement for convergence is that imposed on the particle number by the collisional relaxation criterion, which implies that in order to estimate accurate circular velocities at radii as small as of , where the density contrast may reach , the region must enclose at least particles (or more than a few times within the virial radius). We can use these criteria to identify regions of simulated dark halos where the mass profiles are unlikely to be affected by numerical artifacts.
3. Phase-Space Density Profiles
As discussed in §1, there is at present no broad consensus regarding how steep the innermost slope of dark matter density profiles is, or even whether there is a well-defined value for the asymptotic innermost slope. Unfortunately, the results of the previous section make it clear that it will take extraordinary computational effort to reach a robust resolution of the controversy. What is required is a statistically significant sample of galaxy-sized halos simulated with sub-kpc resolution; this is an extremely onerous computational task that will stretch the capabilities of the most powerful massively parallel computers. Steps in this direction are currently being taken, but it will take some time until these efforts yield conclusive results.
From the theoretical point of view, a number of plausible arguments have been advanced in order to try and explain the innermost behaviour of dark matter density profiles from stellar dynamical principles. These efforts, however, tend to give non-unique results and have so far been unable to explain the remarkable similarity in the structure of dark matter halos of widely different mass formed in a variety of cosmogonies (Evans & Collett 1997, Syer & White 1998, Nusser & Sheth 1999, Lokas & Hoffman 2000).
We have recently explored an empirical alternative to analytic efforts addressed at estimating the innermost slope of the density profile (Taylor & Navarro 2001, hereafter TN). Our approach exploits the similarity between the phase-space density profiles (defined here as the ratio of density to velocity dispersion cubed, , measured in spherical shells) of CDM halos and of the self-similar solution for spherical collapse in an expanding universe found by Bertschinger (1985). This offers an attractive scenario for understanding the shape of halo density profiles as well as a powerful tool for estimating their slope near the center.
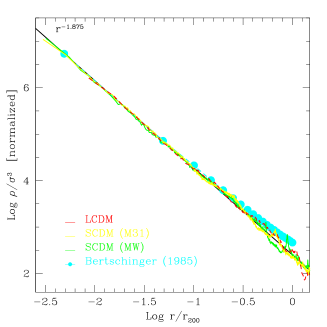
Figure 1a shows the spherically-averaged phase-space density profile of three simulated CDM halos. Two of these halos have been identified in simulations of the former “standard” CDM cosmogony (SCDM, ) and have circular velocities of and km s-1, respectively. These two halos are part of the “Local Group” simulation reported by Moore et al. (1999). The third halo has a circular velocity of km s-1 and was run in the currently popular CDM cosmogony (). Solid (dashed) lines are used for the SCDM (CDM) halos. For ease of comparison, we have chosen to normalize so that all three curves coincide at . All three systems have particles within and are amongst the highest resolution simulations available at present. The important point illustrated by Figure 1a is that, over more than two decades in radius, the phase-space density profile is very well approximated by a power law of slope (solid straight line). This is quite remarkable, given that both the density profiles (shown in Figure 1b) and the velocity dispersion profiles of these halos deviate substantially from simple power laws.
Also remarkable is that this power-law coincides with the self-similar solution derived by Bertschinger (1985) for secondary infall onto a spherical perturbation in an unperturbed Einstein-de Sitter universe: Bertschinger’s solution is plotted with solid circles in Figure 1. The solution corresponds to the self-similar equilibrium configuration of a gas formed by spherical accretion onto a point-mass perturber in an otherwise uniform Einstein-de Sitter universe. The quantity shown by the solid circles in Figure 1a, , is roughly equivalent to the phase-space density ( is the local pressure). As discussed by Bertschinger, this solution is the most appropriate to compare with our numerical results for CDM halos, given that the velocity dispersion tensor in this case is only mildly anisotropic. Radii are normalized assuming that equals the shock radius of the self-similar solution, which corresponds to roughly one-third of the turnaround radius. The vertical normalization is arbitrary and has been chosen to match the N-body results. Taking to be a measure of the local ‘entropy’ of the system, Figure 1a shows that CDM halos have the same radial entropy stratification as the simple spherical collapse solution. It is possible that this power-law stratification is a fundamental property which underlies the similarity of structure of cold dark matter halos.
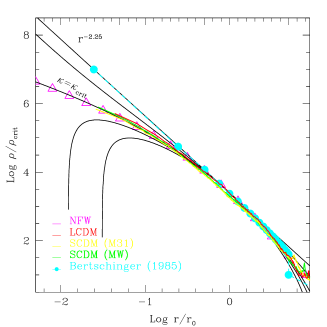
Density profiles consistent with the power-law phase-space density profile shown in Figure 1a can be obtained by assuming hydrostatic equilibrium. The isotropic Jeans equation admits a family of solutions for the density profile under the constraint . The family is controlled by a single parameter, which can be expressed in terms of the ratio of the circular velocity to the 1-D velocity dispersion at , the radius where the circular velocity peaks (). For , the family includes a power-law, , with , which corresponds to Bertschinger’s spherical infall solution. As increases, the density profiles become increasingly curved, although they still approach the steep power-law divergent behaviour near the center (see, e.g., second curve from top in Figure 1b). For greater than some ‘critical’ value, , the density profiles become unphysical, vanishing at a finite radius near the center.
The “critical” density profile () corresponds to the maximum value of consistent with a non-vanishing density profile at the center and, as shown in Figure 1b, describes the N-body results much better than a power law. Interestingly, over approximately three decades in radius, the shape of the NFW density profile is very similar to the ‘critical’ solution alluded to above.
The meaning of the critical solution may be understood by considering the phase-space density distribution corresponding to the different solutions. The phase-space density distribution function is broadest for the power-law solution () and gets increasingly narrower as increases; the critical solution () corresponds then to the most sharply peaked phase-space density distribution compatible with a monotonic density profile. In other words, the critical solution may be interpreted as a “maximally mixed” configuration where the phase-space density is as uniform as possible across the system.
This leads to the following interpretation of the origin of the NFW profile. Gravitational assembly of CDM halos leads to a simple power-law radial stratification of the phase-space density. If spherical symmetry is imposed, as in the case treated by Bertschinger (1985), the collapse of each radial mass shell generates different “entropies” (phase-space densities) as they settle into virial equilibrium, leading to steeply cusped power-law profiles with slope . On the other hand, when the assumption of spherical symmetry is released and the collapse proceeds through many stages of hierarchical merging, mass shells are continuously “mixed” and the profiles tend to the critical solution: that corresponding to the most uniform entropy distribution compatible with a monotonic (non-hollowed) density profile and with the power-law entropy stratification constraint.
4. NFW vs ‘critical’ solution
As discussed above, the ‘critical’ density profile resembles the model proposed by NFW over a large dynamic range in radius. Despite this similarity, there are important differences between the two profiles, one of the most notable being that the critical solution tends to an asymptotic central slope of rather than to as in NFW’s fitting formula. A simple approximation to the radial dependence of the slope of the ‘critical’ density profile is given by
| (2) |
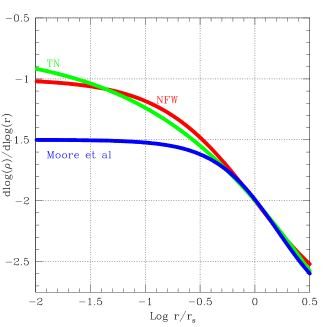
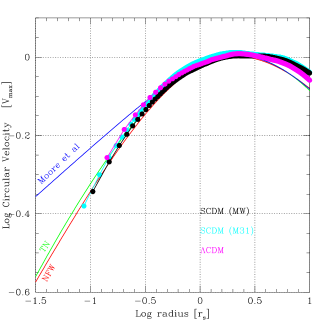
which is accurate to for . Here is the radius where the logarithmic slope of the density profile equals . This should be compared with for NFW, where , or with the profile proposed by Moore et al (1998), . The comparison is shown in Figure 2a. The critical profile (labeled ‘TN’ in this figure) is overall similar to NFW, although it becomes shallower inwards more gradually than NFW. For the critical solution is shallower than NFW, and approaches slowly the asymptotic value of .
These differences are reflected mainly in the inner regions, as illustrated in Figure 2b. Here the density profile corresponding to the three models are compared with the simulations222Model profiles in Figure 2b have been fitted only to the outer regions of the simulated halos in order to emphasize the differences between models. Quantitatively, results vary depending of the radial range chosen for the fit, but the trends described here remain.. The three models agree very well at radii exceeding , but differ systematically within . Although the critical solution predicts densities larger than NFW for r just inside , the situation eventually reverses for radii smaller than , outside the range plotted in Figure 2b.
Interestingly, the profiles of simulated halos exhibit similar deviations from NFW fits over the same radial range: the three curves connecting solid circles, corresponding to the CDM halos alluded to in §3, show a clear excess over the NFW fit. Such excess has been noted by Moore et al (1998), Ghigna et al (2000), and Fukushige & Makino (1997, 2001), who interpret it as a signature of very steep () central divergent slopes. The modification to the NFW formula proposed by Moore et al (1998), where the innermost slope is rather than , indeed appears to describe the simulation results better than the NFW formula in the range (see the top curve labeled ‘Moore et al’ in Figure 2a).
However, and in light of the discussion in §3, these systematic deviations from NFW fits do not necessarily signal the onset of a very steep central slope, but rather may reflect the more gradual radial dependence of the logarithmic slope of the critical solution (Figure 2a). This interpretation seems to find support in the simulations: the profiles of the three simulated halos are significantly shallower than the Moore et al fit near the center. One may want to dismiss this feature as an artifact of limited numerical resolution, but application of our convergence criteria (§2) to their own data suggest that the deviations are genuine and point to inner slopes significantly shallower than , just as expected from TN’s critical solution.
Finally, Figure 3a compares the circular velocity profiles of the same CDM halos with the predictions of the three models considered in Figure 2. The cumulative mass profiles of TN’s critical solution and NFW are essentially indistinguishable; the different radial dependence of the density profile in the two models roughly compensate, and lead to almost identical circular velocity profiles that are in very good agreement with the results of the simulations. As expected from the discussion of Figure 2a, the Moore et al model significantly overestimates the dark mass near the center compared with the simulations.
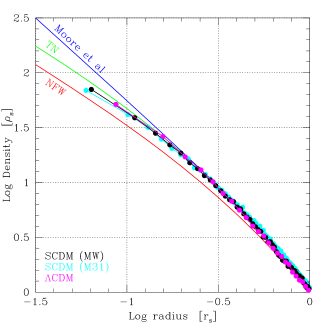
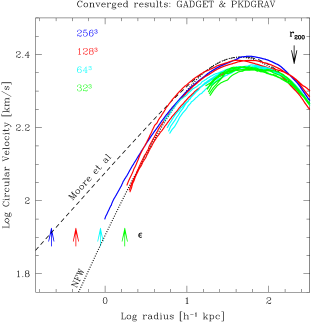
This result is confirmed by a further simulation of a galaxy-sized CDM halo, whose density profile is shown in Figure 3b. The profiles correspond to the halo analyzed by Power et al (2001) for the convergence tests described in §2. These tests vary the softening, timestep, and number of particles and show that extremely high numerical resolution is needed in order to discriminate between the three models. The highest resolution halo in Figure 3b (which has more than 3 million particles within ) has a circular velocity profile which agrees well with NFW (and TN’s critical solution) but is much shallower near the center than expected from Moore et al’s fitting formula.
Can these results be used to place meaningful constraints on the asymptotic inner slope? At kpc, the smallest radius resolved in the highest-resolution run shown in Figure 3b, both the local and cumulative density profiles are robustly determined: , and . These values can be combined with the requirement of mass conservation to place an upper limit to the inner asymptotic slope of the density profile, . In other words, there is not enough mass within to support a power-law density profile with slope steeper than . We note that this conclusion depends sensitively on our ability to resolve the innermost kpc. If were just two or three times larger the same exercise would not be able to rule out slopes as steep as .
5. Summary and Discussion
In summary, a number of interesting features emerge from the analysis of four very high-resolution (million-particle class) simulations of galaxy-sized CDM halos.
-
•
The spherically-averaged, phase-space density profiles of CDM halos are very well approximated by a power law, . The slope of this power law is consistent with the self-similar solution for spherical secondary infall derived by Bertschinger (1985).
-
•
The circular velocity profiles of simulated CDM halos agree well with the model proposed by NFW down to the smallest resolved scales.
-
•
On the other hand, the shape of the density profiles of simulated CDM halos differs modestly, but significantly, from the model proposed by NFW. As a result, NFW fits tend to underestimate the density just inside the scale radius , as pointed out by Moore et al (1998), Ghigna et al (2000), and Fukushige & Makino (1997, 2001).
-
•
There is no obvious evidence for convergence to a steep asymptotic slope over the radial range probed by the simulations. Density profiles get increasingly shallow near the center, with innermost slopes significantly shallower than .
-
•
A maximally-mixed (‘critical’) model where the phase-space density profile is assumed to be a power law of radius accounts for these features and predicts that the slope of the density profile should gradually approach near the center.
The power-law behaviour of the phase-space density thus offers a natural way to gain insight into the structure of dark matter halos at radii where simulations become increasingly difficult and expensive, but also where observational constraints are strongest. Provided that the velocity dispersion tensor remains nearly isotropic, the “critical” solution provides a clear prediction as to the behaviour of the logarithmic slope of the density profile: it should become progressively shallower towards the center, converging to a value of .
This is interesting, because slopes shallower than appear to be consistent with the recent reanalysis of the rotation curve dataset by van den Bosch et al. (2000) and by van den Bosch & Swaters (2001). It is important to mention, however, that a shallow central slope does not guarantee consistency with observations, which constrain the detailed radial dependence of the density profile slope as well. Our results do, however, offer a clear prediction to extrapolate the mass profiles to regions that are very difficult to probe numerically. Is the extrapolation of the power-law behaviour to very small radii warranted? This question ultimately will have to be answered by direct numerical simulation, although there is no obvious a priori reason why a power law scaling that is valid for over two decades in radii should break down nearer the center.
We note that these conclusions are at odds with the proposal of Moore et al (1998) and Ghigna et al. (2000) that the innermost slopes of CDM halos converge to a value not shallower than about . However, it should be emphasized that their conclusion was based on the simulation of a single halo simulated in a standard CDM universe (SCDM) and on a significantly different mass regime (galaxy clusters) than probed here. Thus the possibility remains that this particular system may not be representative of the general population or that the density profiles of clusters are steeper than those of galaxy-sized halos. Confirming which of these possibilities holds will require a statistically significant sample of halos simulated with resolution comparable to the systems used here. Finally, it is also possible that the cluster simulated by Moore et al. (1998) and Ghigna et al. (2000) differs from the galaxy-sized halos we present here in other, more subtle ways. For example, it may be significantly more triaxial than the systems analyzed here, or perhaps its velocity dispersion tensor is very anisotropic, in conflict with the assumptions of this work. Again, a detailed reanalysis of the discrepant system, extended to a statistically meaningful sample, appears necessary in order to explain conclusively this discrepancy.
The good agreement between the ‘critical’ solution and the mass profiles of simulated halos suggests that the structure of CDM halos is determined by a radial stratification of phase-space density similar to that established through collapse onto a point mass perturbation in an unperturbed expanding universe, and by the uniformization of phase-space density that occurs presumably as a result of the many merger and satellite accretion events that characterize the assembly of a CDM halo. This identification leaves a couple of important questions unanswered: (i) why should the phase-space density be a power law of radius?, and (ii) why is the exponent the same as in Bertschinger’s self-similar solution?. Although we have no clear answer to these questions at this point, our results suggest that explaining the origin of the structural similarity of CDM halos pointed out by Navarro, Frenk & White may entail unraveling why the radial stratification of phase-space density in CDM halos is the same power-law generated by the simple spherical collapse model. Discovering a mechanism that achieves this may provide a simple explanation for the universal structure of cold dark matter halos.
Acknowledgments.
I am grateful to my collaborators: Carlos Frenk, Adrian Jenkins, Chris Power, Tom Quinn, Volker Springel, Joachim Stadel, James Taylor, and Simon White, for allowing me to report our results here, and also to J.Makino, T.Fukushige and P.Hut for organizing a very enjoyable meeting. Cool talks, fresh sushi, cold Sapporo, great company: all seemed a perfect antidote for a hot July in Tokyo and Kyoto. Thanks as well to B.Moore, S.Ghigna, G.Lake, and F.Governato for sharing with me data from their ‘Local Group’ simulations. This work has been supported by various grants from NSERC and CFI.
References
- 1
- Bertschinger(1985) Bertschinger, E. 1985, ApJS, 58, 39
- Cole & Lacey(1996) Cole, S. & Lacey, C. 1996, MNRAS, 281, 716
- Crone, Evrard, & Richstone(1994) Crone, M. M., Evrard, A. E., & Richstone, D. O. 1994, ApJ, 434, 402
- de Blok, McGaugh, Bosma, & Rubin(2001) de Blok, W. J. G., McGaugh, S. S., Bosma, A., & Rubin, V. C. 2001, ApJ, 552, L23
- Dubinski & Carlberg(1991) Dubinski, J. & Carlberg, R. G. 1991, ApJ, 378, 496
- Evans & Collett(1997) Evans, N. W. & Collett, J. L. 1997, ApJ, 480, L103
- Fillmore & Goldreich(1984) Fillmore, J. A. & Goldreich, P. 1984, ApJ, 281, 1
- Flores & Primack(1994) Flores, R. A. & Primack, J. R. 1994, ApJ, 427, L1
- Frenk, White, Davis, & Efstathiou(1988) Frenk, C. S., White, S. D. M., Davis, M., & Efstathiou, G. 1988, ApJ, 327, 507
- Fukushige & Makino(1997) Fukushige, T. & Makino, J. 1997, ApJ, 477, L9
- Fukushige & Makino(2001) Fukushige, T. & Makino, J. 2001, ApJ, 557, 533
- Ghigna et al.(2000) Ghigna, S., Moore, B., Governato, F., Lake, G., Quinn, T., & Stadel, J. 2000, ApJ, 544, 616
- Gunn & Gott(1972) Gunn, J. E. & Gott, J. R. I. 1972, ApJ, 176, 1
- Hoffman & Shaham(1985) Hoffman, Y. & Shaham, J. 1985, ApJ, 297, 16
- 2 Huss A., Jain B., Steinmetz M., 1999, MNRAS, 308, 1011
- Jing & Suto(2000) Jing, Y. P. & Suto, Y. 2000, ApJ, 529, L69
- Łokas & Hoffman(2000) Łokas, E. L. & Hoffman, Y. 2000, ApJ, 542, L139
- McGaugh & de Blok(1998) McGaugh, S. S. & de Blok, W. J. G. 1998, ApJ, 499, 41
- de Blok, McGaugh, Bosma, & Rubin(2001) de Blok, W. J. G., McGaugh, S. S., Bosma, A., & Rubin, V. C. 2001, ApJ, 552, L23
- Moore(1994) Moore, B. 1994, Nature, 370, 629
- 3 Moore B., Governato F., Quinn T., Stadel J., Lake G., 1998, ApJ, 499, L5
- 4 Moore B., Ghigna S., Governato F., Lake G., Quinn T., Stadel J., Tozzi P., 1999, ApJ, 524, L19
- 5 Navarro J.F., Frenk C.S., White S.D.M., 1996, ApJ, 462, 563
- 6 Navarro J.F., Frenk C.S., White S.D.M., 1997, ApJ, 490, 493
- Nusser & Sheth(1999) Nusser, A. & Sheth, R. K. 1999, MNRAS, 303, 685
- et al. 2001 Power, C., Navarro, J.F., Jenkins, A., Frenk, C.S., White, S.D.M., Springel, V., Stadel, J., Quinn, T.R. 2001, ApJS, in preparation.
- Quinn, Salmon, & Zurek(1986) Quinn, P. J., Salmon, J. K., & Zurek, W. H. 1986, Nature, 322, 329.
- Syer & White(1998) Syer, D. & White, S. D. M. 1998, MNRAS, 293, 337
- Taylor & Navarro(2001) Taylor, J.E., & Navarro, J.F. 2001, ApJ, in press.
- van den Bosch & Swaters(2001) van den Bosch, F. C. & Swaters, R. A. 2001, MNRAS, 325, 1017
- 7 van den Bosch F.C., Robertson B.E., Dalcanton J.J., de Blok W.J.G., 2000, AJ, 119, 1579
- White & Zaritsky(1992) White, S. D. M. & Zaritsky, D. 1992, ApJ, 394, 1.