Observations of H in the Diffuse Interstellar Medium
Abstract
Surprisingly large column densities of H have been detected using infrared absorption spectroscopy in seven diffuse cloud sightlines (Cygnus OB2 12, Cygnus OB2 5, HD 183143, HD 20041, WR 104, WR 118, and WR 121), demonstrating that H is ubiquitous in the diffuse interstellar medium. Using the standard model of diffuse cloud chemistry, our H column densities imply unreasonably long path lengths ( 1 kpc) and low densities ( 3 cm-3). Complimentary millimeter-wave, infrared, and visible observations of related species suggest that the chemical model is incorrect and that the number density of H must be increased by one to two orders of magnitude. Possible solutions include a reduced electron fraction, an enhanced rate of H2 ionization, and/or a smaller value of the H dissociative recombination rate constant than implied by laboratory experiments.
1 Introduction
The H molecular ion has long been considered to play an important role in the chemistry of dense molecular clouds, as it initiates the network of ion-neutral reactions (Herbst and Klemperer, 1973; Watson, 1973) that is responsible for the wealth of molecules observed by infrared and radio astronomers. However, H has not been considered to be an important species in diffuse clouds, because it is thought to be destroyed rapidly by dissociative recombination with electrons, which are abundant in diffuse clouds. For the purposes of the present study, we do not make a distinction between diffuse and translucent clouds, but simply use “diffuse” to indicate sightlines where CO is not the dominant reservoir of carbon (in contrast to dense clouds).
The detection of H in the diffuse interstellar medium toward the Galactic Center (Geballe et al., 1999) and toward the visible star Cygnus OB2 12 (McCall et al., 1998a) with similar column densities to those of dense clouds (McCall et al., 1999) was therefore quite surprising. These observational results imply either a very long pathlength (hundreds of parsecs) of absorbing material, or a serious problem with the standard model of diffuse cloud chemistry. Various attempts have been made to explain the abundance of H toward Cygnus OB2 12 while preserving the standard model of the chemistry, either by adjusting all parameters to optimize H (Cecchi-Pestellini and Dalgarno, 2000) or by postulating an additional ionization source for H2 molecules peculiar to the neighborhood of the Cygnus OB2 association (Black, 2000).
We have conducted a small survey of twelve diffuse cloud sources with the aim of determining whether the sightline toward Cygnus OB2 12 is unique, or whether high column densities of H are common in diffuse clouds. As a result of this survey, we have detected H in seven diffuse cloud sources (Cygnus OB2 12, Cygnus OB2 5, HD 183143, HD 20041, WR 104, WR 118, and WR 121), and obtained upper limits toward five other sources (HD 194279, HD 168607, P Cygni, Ori, and Oph). For Cygnus OB2 12 and 5 and HD 181343, we have also obtained infrared and radio spectra of CO, as well as high-resolution visible spectra of relevant atoms and molecules. We have also obtained infrared CO spectra towards WR 104 and WR 108.
These results demonstrate the ubiquity of H in diffuse clouds, and suggest that there is a “global” problem with the current models. In this respect, H represents a major problem in diffuse cloud chemistry, reminiscent of the Diffuse Interstellar Bands and CH+.
2 Observations and Data Reduction
The stellar parameters of our targets are listed in Table 1, and a summary of the observations is provided in Table 2. The (1,1)l line of H at 3.715 m was observed using the Phoenix spectrometer on the Mayall 4-meter telescope at Kitt Peak National Observatory (KPNO). The H observations were performed in three runs (July 1998, June 2000, and March 2001). The CGS4 facility spectrometer on the United Kingdom Infrared Telescope (UKIRT) was used in July 2000 and May 2001 to study the (1,0)–(1,1)u doublet of H near 3.668 m. The three observed H rotation-vibration transitions belong to the fundamental band of the degenerate bending mode, and arise from the lowest allowed rotational states (,) = (1,1) and (1,0). The old notation [e.g., (1,1)+] has been superseded by a more flexible notation [e.g., (1,1)u] which uses and in place of and [for a complete description of the new standard notation for H, see McCall (2000) or McCall and Oka (2000)].
Infrared spectra of portions of the fundamental (=1-0) and overtone (=2-0) infrared bands of CO were also obtained. The fundamental band was studied toward Cygnus OB2 12 and Cygnus OB2 5 with Phoenix in July 1999 and June 2000, and toward HD 183143, WR 104, and WR 118 with CGS4 in May 2001. The overtone band of CO was searched for with Phoenix toward HD 183143 in June 1997 and toward Cygnus OB2 12 in July 1999.
All the infrared data were reduced using the procedure outlined in McCall et al. (1999), which is described in more detail in McCall (2001). Object spectra were ratioed by (scaled) standard spectra in order to remove the many strong atmospheric absorption lines in these regions. The wavelength calibration was achieved using telluric absorption lines, and is estimated to be accurate to roughly 2 km/s. The resolving power of the Phoenix spectrometer was roughly 40,000 until 1998, and approximately 60,000 during 1999–2001. The CGS4 spectrometer was used with the long camera, yielding a resolving power of 40,000.
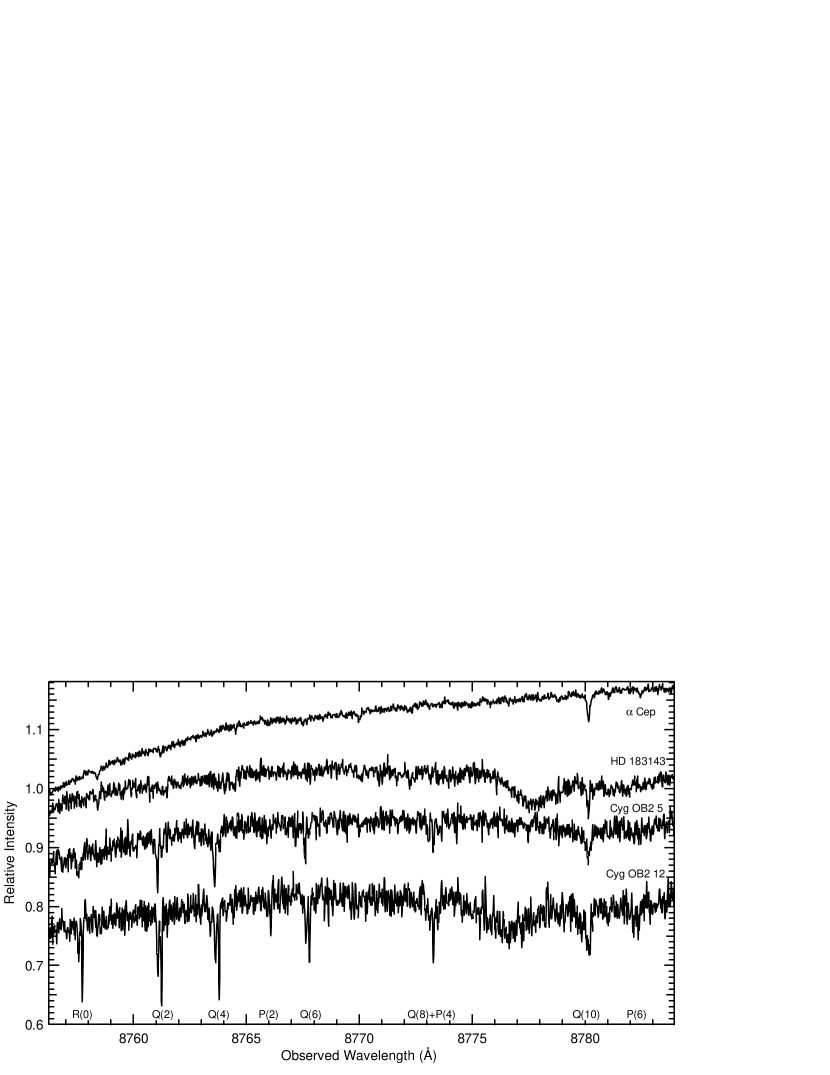
High resolution visible spectra of atoms and molecules of interest were obtained using the Coudé spectrometer on the Smith 2.7-m telescope at McDonald Observatory. A total of three echelle settings were used. The first covered the K i line at 7699 Å and the CN A-X =2-0 line at 7875 Å. The second covered the C2 A-X =2-0 band near 8760 Å. These two echelle settings were used with the F1E2 configuration and the 0.2” slit, which yielded a resolving power of about 200,000. The third echelle setting covered Ca i at 4227 Å, Ca ii at 3934 Å, CH at 4300 Å, CH+ at 4232 Å, and CN B-X =0-0 near 3874 Å. This setting was used with the F1E1 configuration and the 0.6” slit, to yield a resolving power of approximately 120,000. The McDonald data were reduced using standard IRAF routines (ccdproc and doecslit). It was not generally necessary to ratio the visible spectra by standard stars, due to the weakness and paucity of atmospheric absorption lines in the regions of interest. Wavelength calibration was achieved using comparison spectra of a Th-Ar lamp, and is estimated to be good to about 0.01 Å in all cases.
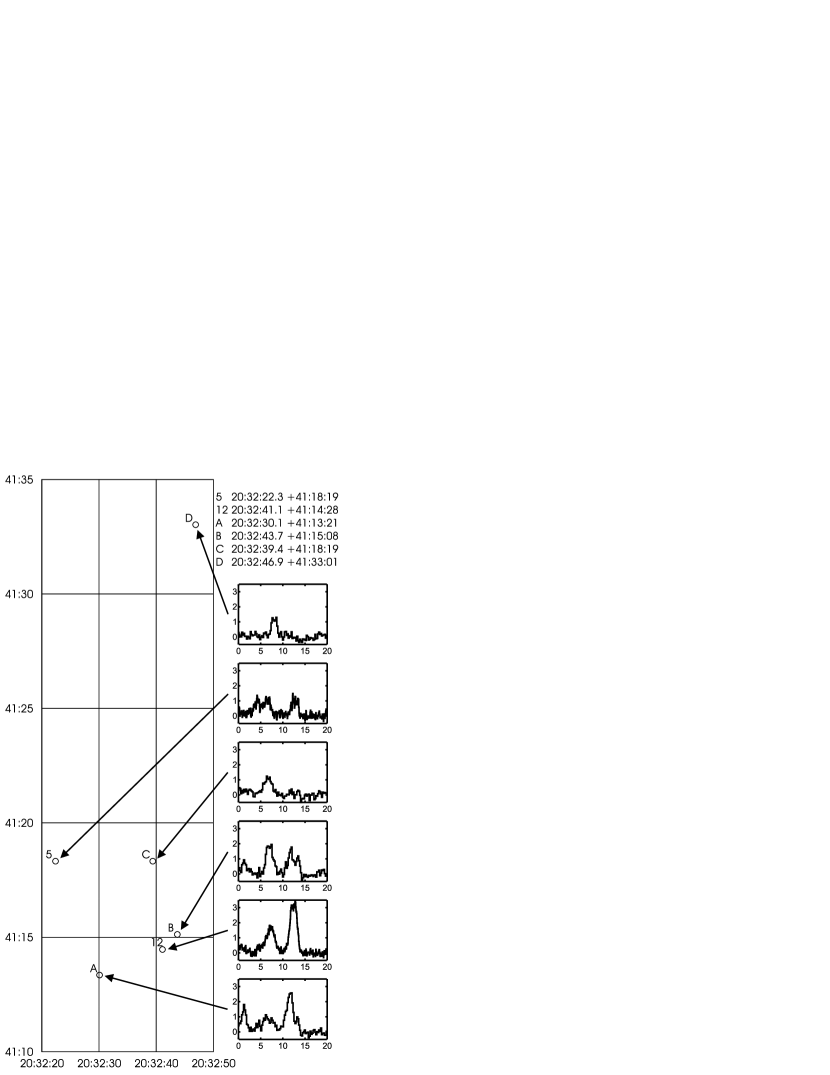
Rotational spectra of CO in the Cygnus OB2 association were obtained at the Nobeyama Radio Observatory (NRO) for =1-0, and the Caltech Submillimeter Observatory (CSO) for =2-1 and 3-2. The CSO spectra were obtained using position switching with an “off” position of 30’ south. This position has significant 12CO emission, but no detectable 13CO emission compared with a more distant off position, which is important as the 13CO data is used in the interpretation of the infrared CO lines. The NRO spectra were obtained using position switching with an off position of , which was found to be more free of CO emission. CO spectra toward HD 183143 were also obtained at the James Clerk Maxwell Telescope (JCMT) for =2-1, and at NRO for =1-0, using frequency switching. In all cases, data were reduced using the standard procedures.
3 Results
3.1 H Spectra
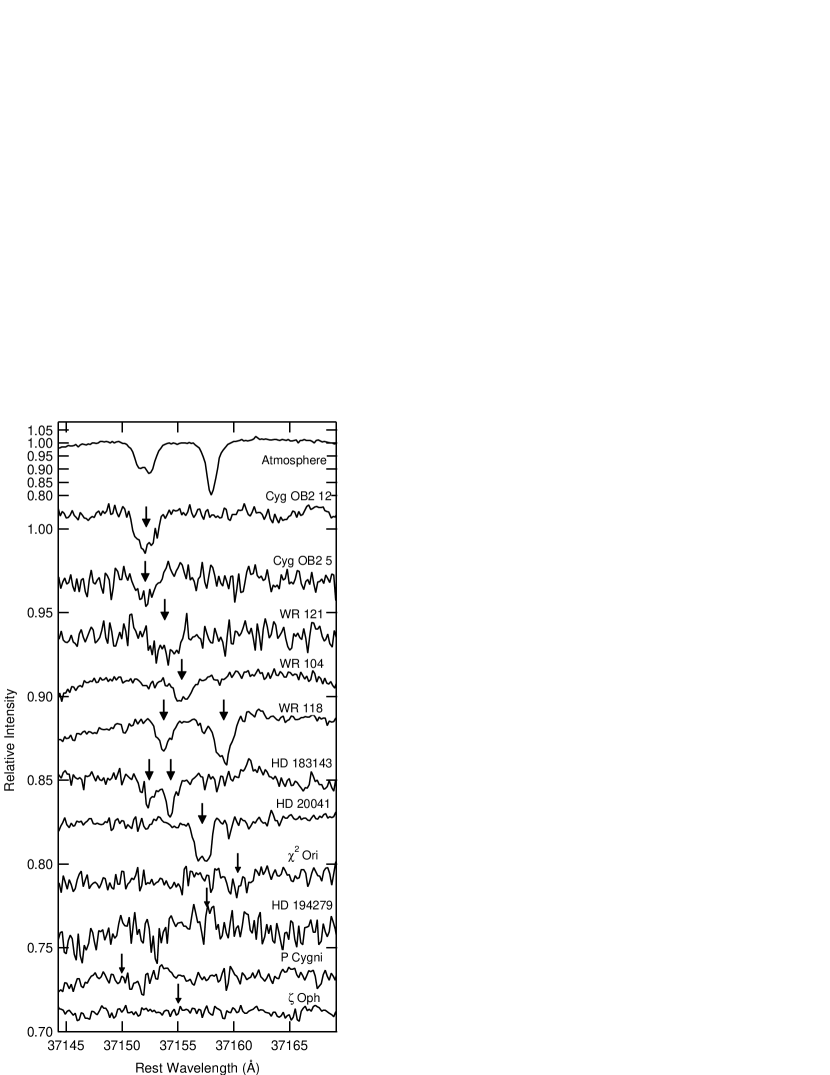
In our 1998 observing run at Kitt Peak, we detected H for the first time toward Cygnus OB2 5, which lies approximately 6’ (3 pc at 1.7 kpc) away from Cygnus OB2 12. Although the H (1,1)l line was unfortunately Doppler shifted under the telluric CH4 feature near 37152 Å, we are confident that the detection is secure, because the other telluric CH4 line (near 37158 Å) is removed very effectively by ratioing with a standard star, and because we observed a similar H feature in Cygnus OB2 12 at the same velocity with an equivalent width consistent with our earlier observations (McCall et al., 1998a). Our Kitt Peak H observations are summarized in Figure 1.
Our 1998 run also yielded detections of H toward the Wolf-Rayet stars WR 121, WR 104, and WR 118. The source WR 118 is interesting in that it shows two H components, which have similar (though not the same) spacing as the two telluric CH4 lines. Consequently, the scaling and ratioing by the standard star was performed by choosing parameters which minimized the residuals of CH4 lines elsewhere in the spectrum (not shown in the figure). It is worth noting that the inferred velocities of the peaks (+5 and +48 km/s) would occur at heliocentric distances of 0.5 and 3 kpc, respectively, assuming a flat Galactic rotation curve with = 220 km/s, = 8 kpc, and = 21∘.80. These distances do not exceed the estimated distance to the source ( = 14, or 6.3 kpc) obtained from the observed V magnitude of 22, the visual extinction = 12.8 from van der Hucht et al. (1996), and the absolute magnitude = -4.8 for WC9 stars (Smith, Shara, and Moffat, 1990).
Finally, our 1998 Kitt Peak run yielded a non-detection toward HD 194279, toward which CH is observed with a heliocentric velocity of -11.8 km/s (G. Galazutdinov, private communication). This source, along with the Wolf-Rayet stars, was chosen for study because the 3.4 m aliphatic carbon feature (a signature of diffuse clouds) had been detected by Pendleton et al. (1994).
Our June 2000 run at Kitt Peak yielded the first detection of H toward a more traditional diffuse cloud source, HD 183143. Two components of H were seen, in agreement with the visible spectra of other molecules (see below), although the blue component was somewhat affected by the telluric CH4 line. During this run, we also obtained non-detections toward P Cygni [which has an LSR velocity of CH+ of -9 km/s (Hobbs, 1973)] and toward Oph [which has an LSR velocity of CO of -0.79 km/s (Lambert, Sheffer, and Crane, 1990)]. Our March 2001 run at Kitt Peak yielded a detection of H toward the least reddened star to date, HD 20041. We also obtained an upper limit of H absorption towards Ori.
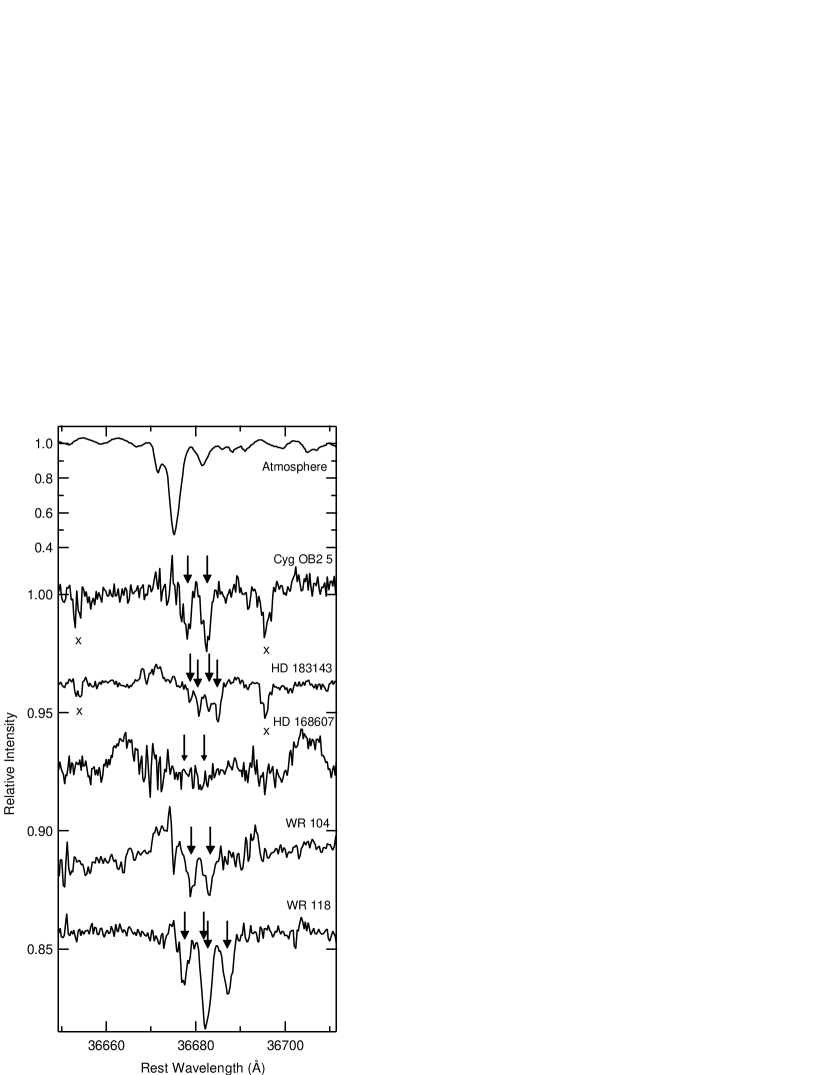
Our run at UKIRT in July 2000 (see Figure 2) confirmed the detections of H toward Cygnus OB2 5 and HD 183143. In the case of HD 183143, the two-component velocity structure is very clear. For both the Cygnus OB2 5 and HD 183143 observations, instrumental artifacts were present in the “negative” spectrum — these features changed in intensity (and sometimes disappeared) depending on exactly which rows of the array were extracted, while the H features were consistently present. We also obtained a non-detection toward HD 168607 [which has a heliocentric CH velocity of 22 km/s (Gredel, 1999)].
In May 2001 at UKIRT, we confirmed the detections of H toward the Wolf-Rayet stars WR 104 and WR 108 by using the (1,1)u–R(1,0) doublet. The separation of the two velocity components toward WR 118 is comparable to the spacing between the two H transitions, so that the (1,0) of the blue component and the (1,1)u of the red component are overlapped.
3.2 CO towards the Cygnus OB2 Association
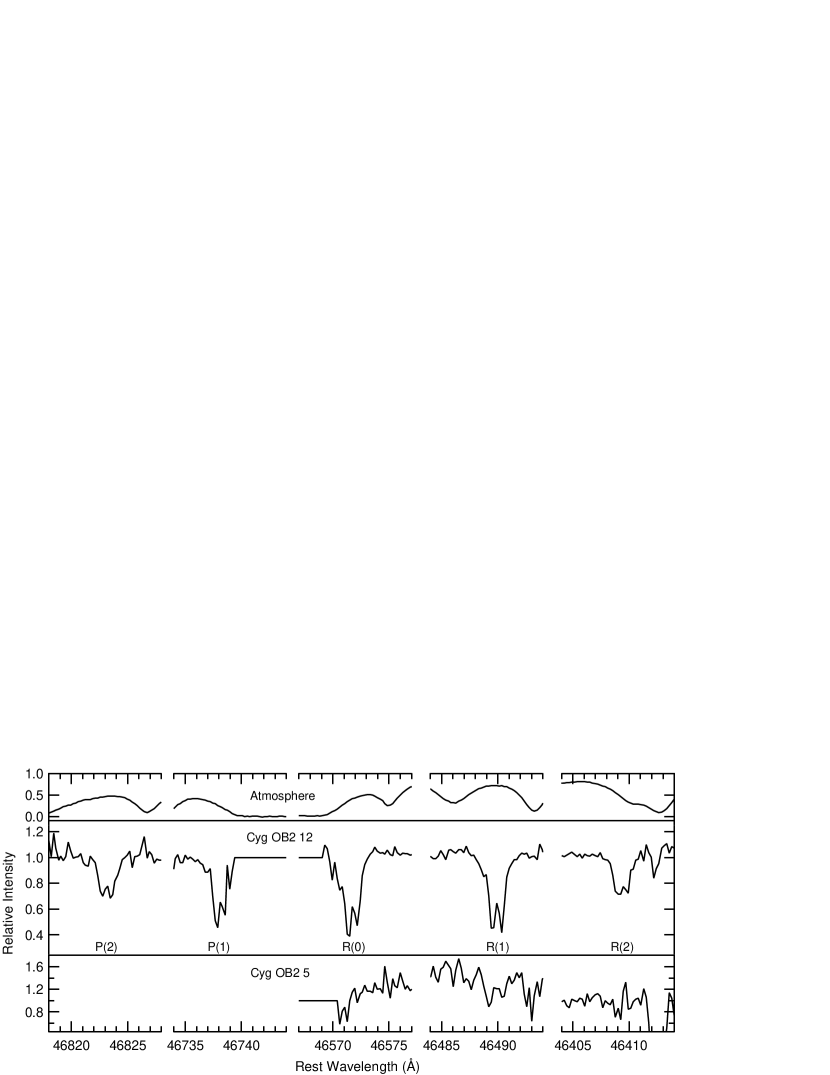
A brief look at the high resolution infrared spectrum of CO toward Cygnus OB2 12 and Cygnus OB2 5 was obtained during test and engineering time with Phoenix at Kitt Peak in July 1999. Followup observations with longer integration time in June 2000 yielded higher signal-to-noise spectra, displayed in Figure 3. The observations of Cygnus OB2 12 clearly show the two closely-spaced ( 5 km/s) velocity components observed in the mm-wave spectrum from JCMT (Geballe et al., 1999). The infrared lines suggest a CO excitation temperature of 10 K toward Cygnus OB2 12, but this should not be taken as an indication of the kinetic temperature of the gas due to the effect of spontaneous emission (Geballe et al., 1999). The infrared CO line parameters are listed in Table 4. We have adopted the transition dipole moments of Huré and Roueff (1996).
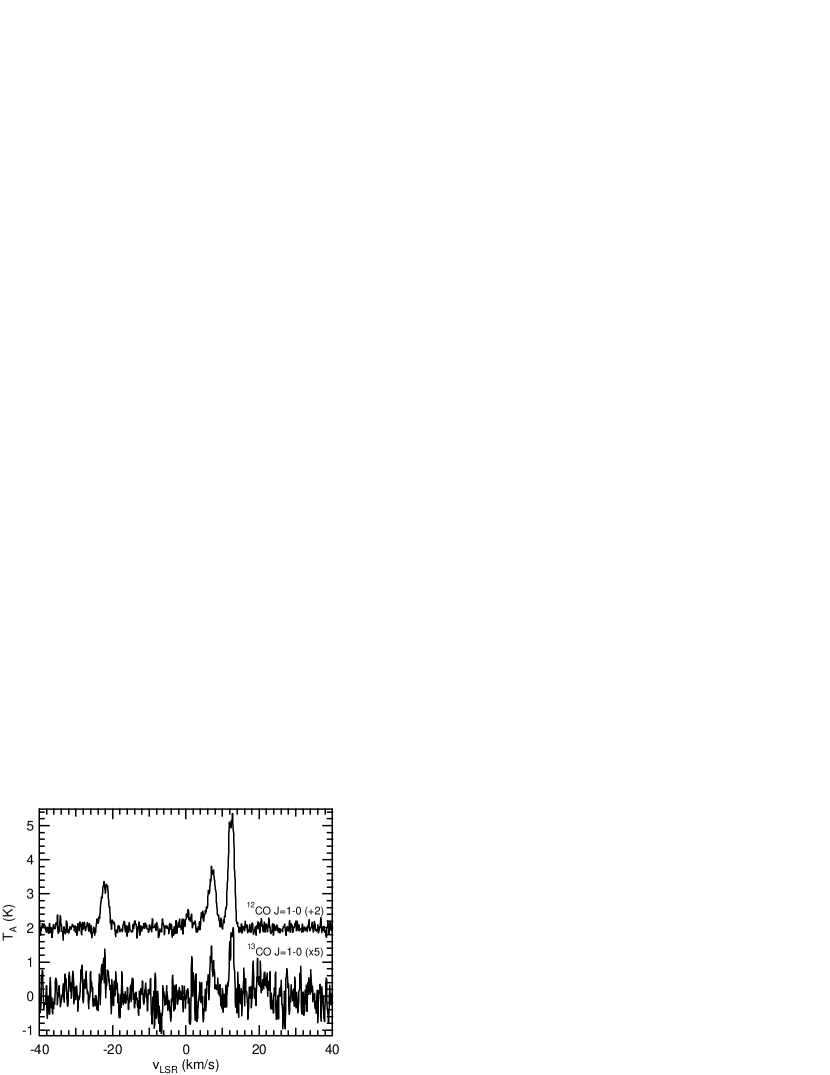
The signal-to-noise ratio of the Cygnus OB2 12 spectrum is clearly not high enough to rely on the measured equivalent widths of the individual components, particularly because of the contamination of the telluric lines. However, we can estimate the column density of CO by assuming that the true equivalent widths of the two components have the same ratio as the integrated areas of the components in the 13CO emission spectrum, and by adopting the -values of the 13CO in estimating the saturation corrections. This analysis was performed with the high-quality 13CO spectrum obtained at CSO (shown in Figure 4; the mm-wave line parameters are listed in Table 5). We assume that the 7 km/s peak carries 0.39 of the equivalent width (and has =0.75 km/s), and that the 12 km/s peak carries 0.61 of the equivalent width (and has =0.88 km/s). With these assumptions we estimate a total CO column density of cm-2 in front of Cygnus OB2 12. This estimate is considerably higher than the estimate of cm-2 given in Geballe et al. (1999), but still much lower than the total column density of carbon ( cm-2) inferred from the color excess.
We have also obtained an upper limit on the CO column density toward Cygnus OB2 12, based on our failure to detect the =2-0 overtone with Phoenix. The upper limit on the =2-0 features yield an upper limit (3) of N(CO) cm-2. This suggests that at most about 10% of the carbon along the line of sight to Cygnus OB2 12 can be in the form of CO, and that this sightline does not consist of dense clouds.
Using the 13CO data from CSO for =2-1 and from NRO for =1-0 (see Figure 5), we performed an analysis using an LVG code to calculate the statistical equilibrium, assuming a temperature of about 30 K (consistent with the C2 analysis of §3.5 and the H analysis of §4.2). If the density ( cm-3) derived from the analysis of C2 toward Cygnus OB2 12 is assumed, the 13CO column density, is determined uniquely by matching the observed line emission. The results are cm-2 for the 7 km/s component and cm-2 for the 12 km/s component. The sum of these, cm-2, would imply a total column density of CO of 2.3– cm-2 for isotope ratios of 50–100; this column density is about twice that inferred from the infrared CO absorption lines. If, on the other hand, we enforce agreement with the column density from the infrared absorption, and assume an isotope ratio of 100, the 13CO data indicate somewhat higher densities: cm-3 for the 7 km/s component, and cm-3 for the 12 km/s component. While these densities are somewhat higher than inferred from C2, it would not be surprising to have density variations, with the 13CO data probing the denser gas, and the C2 probing somewhat less dense gas.
The line of sight toward Cygnus OB2 5 appears to have considerably less CO than that toward Cygnus OB2 12, based both on the marginal detections in the infrared spectrum (Figure 3) as well as the CSO 13CO spectra (Figure 4). Therefore we expect that this sightline is also dominated by diffuse cloud material, although because of the low signal-to-noise of the infrared spectrum it is difficult to estimate the CO column density.
3.3 CO towards HD 183143
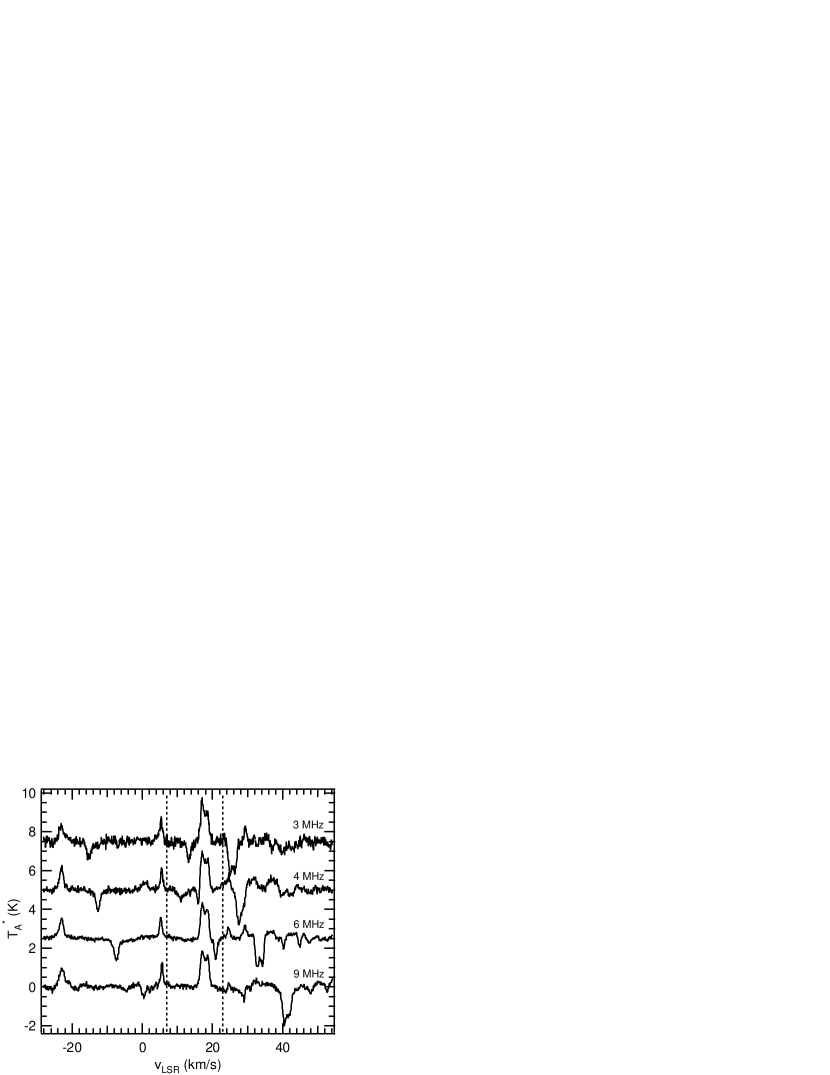
To check for the presence of CO in this sightline, we obtained rotational spectra of the =2-1 line (at JCMT) and the =1-0 line (at NRO). The JCMT results (frequency-switched at 8 MHz and 16 MHz) are shown in Figure 7. While the =2-1 spectrum of Cygnus OB2 12 showed nearly 2 K of emission at the H velocity, the spectrum of HD 183143 shows no emission at the correct velocities in excess of 0.1 K. The NRO results are shown in Figure 8, and provide an upper limit of 0.2 K for the =1-0 emission at the observed H velocities. The closest reasonable velocity component is at +25 km/s, and is only about 0.5 K. In contrast, Cygnus OB2 12 shows 3 K of emission.
During our May 2001 UKIRT run, we obtained an absorption spectrum of the -branch of the CO =1-0 fundamental band. This spectrum (see Figure 9 and Table 4) shows weak absorptions near 25 km/s, in agreement with the radio spectra. Because of the fairly small (geocentric) Doppler shift ( 11 km/s) at the time of the observation, it is difficult to accurately measure the column density, but it is clear that the total CO column density is less than cm-2. A previously obtained Phoenix spectrum of the =2-0 overtone band (from June 1997) provides a less stringent upper limit on the total CO column density of cm-2.
Both the radio and infrared results demonstrate that there is very little (if any) CO associated with the H toward HD 183143.
3.4 CO towards WR 104 and WR 118
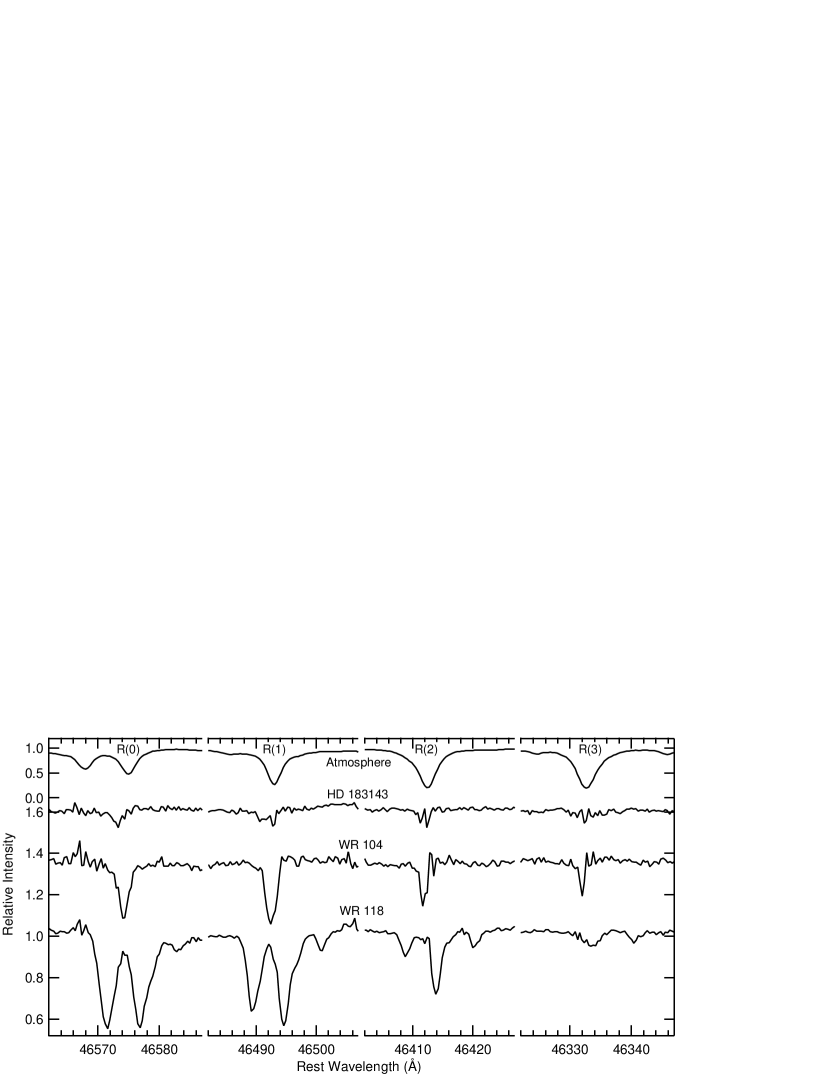
At UKIRT in May 2001, we obtained spectra of the CO fundamental band toward the Wolf-Rayet stars WR 104 and WR 118. The spectra are shown in Figure 9 and the line parameters are listed in Table 4. WR 104 shows a single velocity component centered at 21 km/s — surprisingly, this is different from the velocity of the H ( 10 km/s)! WR 118 has a very complicated velocity structure, which we have fit with four Gaussian components. The lowest velocity component at 10 km/s may be associated with the H component at 5 km/s, and the blended components near 40–55 km/s are consistent with the second H component at 48 km/s.
Without any radio spectra of these sources, it is difficult to attempt saturation corrections, so we have simply listed in Table 4 the column densities in the limit that the lines are optically thin. In this limit, WR 104 has N(CO) cm-2 and WR 118 has N(CO) cm-2 (in the =0–3 levels).
3.5 C2 Spectra
The C2 A-X =2-0 band was clearly detected toward Cygnus OB2 12 at McDonald, as shown in Figure 10. Each line appears as a clear doublet with a separation comparable to that of the CO, except for the (8) line which is blended with (4). The equivalent widths were measured separately for the two velocity components, except for the (8) + (4) blend, for which only the total equivalent width could be measured. The contribution of (4) was estimated from the strength of (4), which permitted an estimate of the (8) equivalent width for the sum of the two velocity components. The (10) line was contaminated by an atmospheric H2O absorption line, and the spectra were ratioed by that of Cep in order to remove the contribution of the telluric line. The derived C2 line parameters (for each component separately, as well as for the total profile) for Cygnus OB2 12 are listed in Table 6. Column densities have been determined assuming the lines are optically thin, using the oscillator strength of van Dishoeck (1983).
Using the method of van Dishoeck and Black (1982), and assuming the scaling factor for the radiation field and the C2–H2 collisional cross-section cm2, we can estimate the number density of collision partners, as well as the kinetic temperature . This analysis is performed by calculating the rotational distribution for a grid of points on the (,) plane, then finding the best fit to the column densities () derived from the observed spectrum. The advantage of this method is that it yields the range of values of (,) that are consistent with the observations, given the uncertainties in the measurements. A web-based “C2 calculator” is available at http://dib.uchicago.edu/c2
For the 7 km/s component, we obtain a best fit value of (,)=(220 cm-3, 40 K), and for the 12 km/s component we obtain (210 cm-3, 30 K). Using the total column densities rather than those of the individual components yields (200 cm-3, 30 K). These values are fairly well constrained by the observational data — it is exceedingly unlikely (i.e. it requires more than a 3 error in at least one of the measurements) that the density is outside the range 150–600 cm-3 or that the temperature is outside the range 25–55 K.
The spectrum of Cygnus OB2 5 also shows a hint of the doublet structure, but the signal-to-noise of the spectrum is not sufficient to reliably measure the equivalent widths of the individual components. Therefore we have measured only the total equivalent widths, which are reported in Table 7. An analysis of the rotational excitation (while very uncertain) suggests that the density exceeds 800 cm-3 and that the temperature lies in the range 60–90 K. According to Gredel and Münch (1994), chemical models predict a sudden decrease in C2 abundance at densities above 103.5 cm-3. Taken with our (uncertain) results, this suggests that the density in the region where C2 is found is in the range 800–3000 cm-3.
In agreement with the results of Gredel (1999), we saw absolutely no trace of C2 towards HD 183143. Assuming the (2) line would have a width of 5 km/s, the 3 limit on the equivalent width is about 1.7 mÅ, which corresponds to a column density of N(=2) cm-2 (comparable to Gredel’s upper limit), which is more than ten times less than that of Cygnus OB2 12!
3.6 Other Visible Spectra
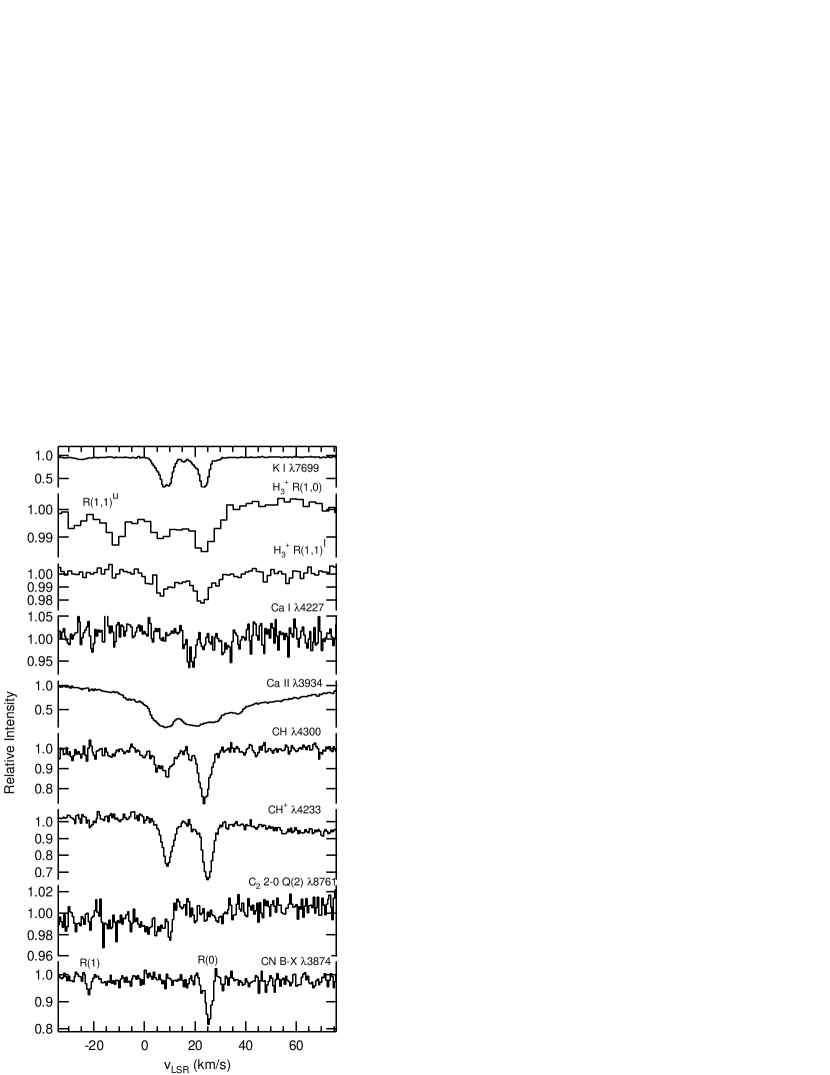
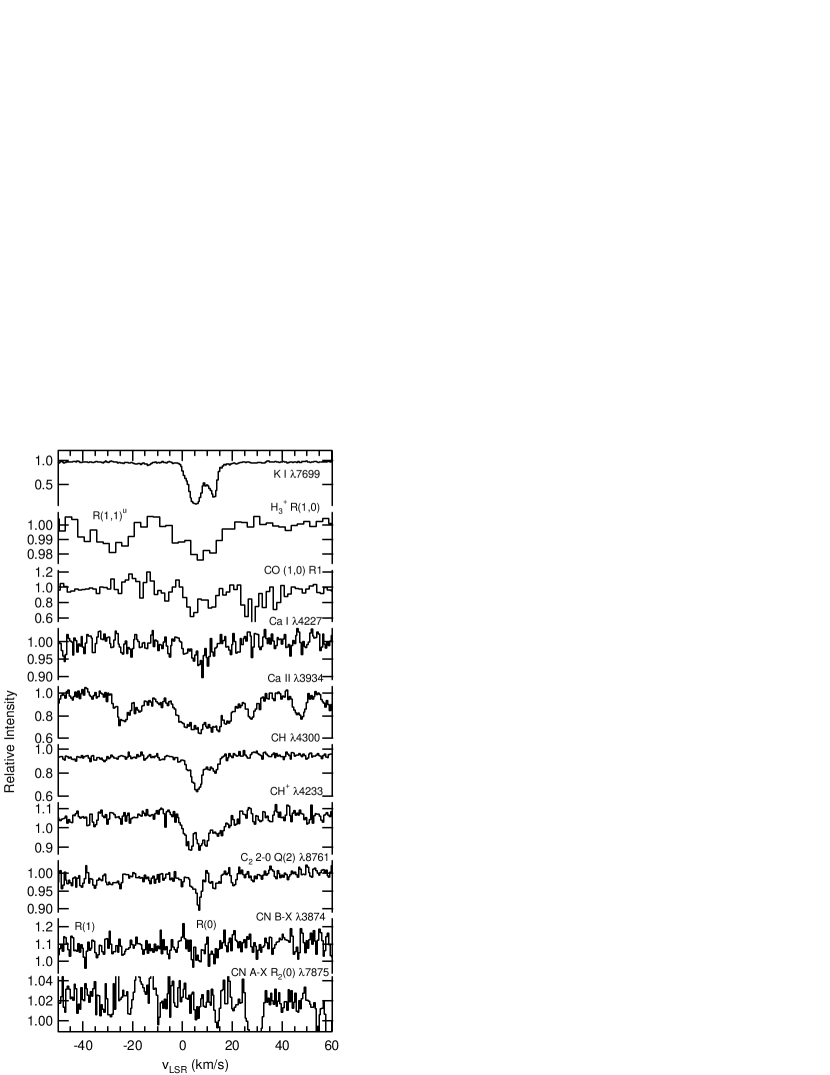
The results of our high resolution visible spectroscopy are shown in Figure 11 (HD 183143), Figure 12 (Cygnus OB2 5), and Figure 13 (Cygnus OB2 12). These figures are plotted in velocity (with respect to the local standard of rest), and also display the infrared measurements of H and CO.
CH appears as a doublet in Cygnus OB2 5, with velocities consistent with the infrared CO measurements. CH also appears as a doublet in HD 183143, with remarkably similar velocity structure to the H. The blue wavelength (4300 Å) of the CH transition made it inaccessible in the case of Cygnus OB 12 (which is very heavily reddened), but it may be possible to detect the line with a larger telescope such as the Hobby-Eberly Telescope. The line parameters of CH (as well as CH+ and CN) are listed in Table 8. The CH column densities have been derived using the curve of growth of van Dishoeck and Black (1989), assuming =1 km/s.
It is interesting to compare the observed CH column densities with those which would be predicted from the empirical relation between H2 and CH (Magnani and Onello, 1995):
For HD 183143, E(B-V)=1.2, so N [assuming the standard gas-to-dust conversion factor (Bohlin, Savage, and Drake, 1978)], and (if 2N(H2)/[N(H)+2N(H2)] = 2/3) N(H2) cm-2. From the empirical relation, one would then predict N(CH) , roughly twice the observed value. For Cygnus OB2 5, with E(B-V) = 2.1, we estimate N(H2) and therefore N(CH) cm-2, over three times the observed value. Assuming our choice of -value is not too large, this suggests that these two sources may be somewhat different chemically from the usual diffuse cloud sources used to develop the empirical relation. However, this discrepancy may not indicate a drastic departure in chemical conditions, as other sources with lower color excess have been observed with similar departures from the empirical relations (Danks, Federman, and Lambert, 1984). The CH discrepancy can be reduced by adopting a lower value of , but this would decrease (H), exacerbating the problems discussed in §4.2.
Another interesting molecule is CN: it is observed (marginally) as a doublet in both Cygnus OB2 12 (A-X) and in Cygnus OB2 5 (A-X and B-X). However, only one component (at v km/s) is observed toward HD 183143 — whereas H, CH, and CH+ all show two velocity components! The R(1) line is also detected toward HD 183143, and the population of the and levels are consistent with the temperature of the cosmic microwave background.
Finally, it is worth noting that, at least in the case of Cygnus OB2 12 (Figure 13), the velocity profile of H appears more similar to that of K i than to C2, CN, or CO. This could be because these three molecules are concentrated in the denser regions of the sightline, whereas H (and K i) may exist over a larger path length.
4 Discussion
4.1 Model of H Chemistry in Diffuse Clouds
The formation of H, in dense or diffuse clouds, begins with the (cosmic ray induced) ionization of H2 to form H. The generally assumed rate of ionization is s-1, so that the average H2 gets ionized roughly once every 109 years. Once ionized, the H quickly reacts with another H2 to form H and an H atom. This ion-neutral reaction proceeds with the Langevin rate constant of cm3 s-1, so that in a medium of H2 density 100 cm-3, the average H must wait about 2 months to react to form H. Clearly the initial ionization is the rate-limiting step, so we can say that H is formed at a rate of n(H2).
The destruction of H is very different in diffuse clouds, compared to dense clouds. In dense clouds, the dominant destruction path is an ion-neutral reaction with CO, with a rate constant of cm3 s-1. In diffuse clouds, electrons are very abundant (due to photoionization of C), so dissociative recombination dominates, with a rate constant of cm3 s-1 (Sundström et al., 1994).
Although the electrons produced by photoionization are probably formed at a high temperature (photons are available at energies up to 13.6 eV, and the ionization potential of C is only 11.3 eV), they will be quickly thermalized by collisions with H2. Such collisions will occur with a Langevin rate constant (which scales as , where is the reduced mass) of cm3 s-1; in a medium with n(H2) = 100 cm-3, an electron experiences such a collision about once per day. The lifetime of the electron is limited by radiative recombination with C+ ions, which occurs with a rate constant of cm3 s-1 (Aldrovandi and Pequignot, 1973) at the low temperatures (30 K) of diffuse clouds. If n(C+) = 10-2 cm-3, the average electron lifetime is about 105 years. Evidently the electrons will be very quickly thermalized to the kinetic temperatures of the clouds. The H electron recombination rate constant is then cm3 s-1, and the destruction rate of H can be given as (H) ().
To calculate the number density of H (McCall et al., 1998a; Geballe et al., 1999), we make the steady-state approximation that the rates of formation and destruction are equal. Thus,
which can be rearranged to give
The chemistry of H is unique in the sense that the number density of H is not dependent upon the number density of the cloud, but only on the ratio of the number densities of molecular hydrogen and electrons (as well as the ratio of two constants ). We can further simplify the above equation by considering , the fraction of protons in H2, writing . Since most electrons are formed from the ionization of carbon, we can also write , where is the fraction of carbon in un-ionized (neutral or molecular) form. Finally, the gas-phase ratio of carbon atoms to hydrogen atoms is usually defined as . Putting this all together, we find
| (1) |
Adopting the values s-1, cm3 s-1, , , and (Cardelli et al., 1996; Sofia et al., 1997), we obtain
| (2) |
The validity of the steady-state approximation can be checked by comparing the timescale needed to reach steady-state with other relevant timescales. The timescale needed to achieve steady-state is approximately the steady state number density of H divided by the formation rate, or , which for n(H2) = 100 cm-3 is about one year — clearly much shorter than other relevant timescales!
4.2 Inferred Cloud Parameters
One cloud parameter can be determined from the H observations independent of the chemical model — the kinetic temperature of the gas. This is possible because the ortho (=1, =0) and para (=1, =1) levels of H are efficiently thermalized together through proton hop and proton exchange reactions with H2 (McCall et al., 1998b). These reactions occur with the Langevin rate constant of cm3 s-1, so that the average H experiences such a reaction about every two months (assuming (H2) = 100 cm-3). The lifetime of the average H can be estimated from the dissociative recombination rate and the number density of electrons cm-3 to be about 4.5 years, considerably longer than the thermalization timescale. Therefore, we can use the Boltzmann expression
to estimate the kinetic temperature from the observed ortho:para ratio (in this equation, the values are the statistical weights). For Cygnus OB2 12, we obtain T=274 K (McCall et al., 1998a); for Cygnus OB2 5, 4713 K; for HD 183143, 313 K; for WR 104, 3810 K; and for the +48 km/s component of WR 118, 403 K. [We cannot estimate the ortho:para ratio for the low velocity component toward WR 118 due to the overlapping of the lines.]
Given our calculated number density of H from the chemical model, we can now estimate the path length of absorption, using the relation . Once the path length has been calculated, we can then estimate the average number density of collision partners along the path length as , where (H2) and (H) can be estimated from the color excess and an assumed value of (2/3). The results of this analysis are given in Table 9.
In most cases, the derived pathlengths are a substantial fraction of the estimated distance to the star, which seems difficult to accept. In addition, the derived average number densities (for the sources in which H was detected) are in the range 1–5 cm-3, which seems unreasonably low. These densities are nearly two orders lower than the densities typically derived from the rotational excitation of C2. In addition, these densities are so low that a substantial fraction of H2 should be photodissociated, meaning that our value of should be lowered, which would in turn make the H number density even smaller, the path lengths even longer, and the average density even lower.
It seems clear that there is a serious problem with the model, and that (H) must be larger (probably by at least one order of magnitude) than we have calculated. In the next subsection, we explore possible solutions to this problem.
4.3 Possible Solutions
The equation for the number density of H
| (3) |
contains five parameters: the H2 ionization rate (), the dissociative recombination rate (), the fraction of protons in molecular form (), the fraction of carbon atoms that are not ionized (), and the gas phase carbon fraction (). We now consider each one of these parameters in more detail.
The fraction of protons in molecular form () has been assumed to have the value 2/3, which is the largest value found in the studies of molecular and atomic hydrogen by Copernicus, IUE, and FUSE. The maximum value of is 1, so even making this adjustment (as is done in the model of Cecchi-Pestellini and Dalgarno (2000)) will only increase (H) by a factor of 1.5 — hardly enough to fix the problem. In addition, increasing the value of would increase the discrepancy between inferred and measured (CH), as discussed in §3.6.
The gas phase carbon fraction () has been taken to be based on ultraviolet observations of classical diffuse clouds (Cardelli et al., 1996; Sofia et al., 1997). Lowering this value (for instance, by assuming that a larger fraction of the carbon is depleted onto grains) would reduce the number density of electrons and therefore increase the number density of H. However, there is no astronomical evidence to support the magnitude of depletion necessary to mitigate the H problem.
The fraction of carbon that is not ionized () has been assumed to be near zero. It is conceivable that a substantial fraction of the carbon could be in the form of neutral C atoms (rather than C+), and there is no observational evidence (in these particular sightlines) that requires most of the carbon to be ionized. However, most chemical models of translucent clouds (see, for example, Figure 9 of van Dishoeck and Black (1988)) suggest that when the optical depth has increased to the point where (C)=(C+), over 10% of the carbon atoms are already in the form of CO. Taken along with our observations of a low column density of CO in these sightlines, this suggests that must be less than 0.5, and thus could contribute at most a factor of 2 towards increasing the H number density.
However, other models (e.g. Federman and Huntress (1989)) suggest that the abundance of C+ in an cloud may be 15 times lower than in an cloud. If we adopt this model, then it is possible that , which would increase (H) by one order of magnitude. Given the differences between the models, we hesitate to rely on them too much, in the absence of observational evidence. The best determination of the value of would come from an observation of the C+ transitions at 1334 and 2325 Å using the Hubble Space Telescope.
Along the same lines, one might speculate about the possibility of an “electron sink” in these sightlines, so that C could still be ionized but the free electron abundance would be low. The best candidate mechanism for removing electrons from the gas is probably attachment to grains or large molecules (e.g., Lepp and Dalgarno (1988)). However, because the number density of large molecules or grains is orders of magnitude lower than the number density of electrons (since these molecules or grains form from elements with cosmic abundance less than or equal to that of carbon, and each molecule or grain contains many atoms), this process could not effect the removal of a significant fraction of the electrons from the gas phase.
The H2 ionization rate () has been assumed to be s-1, but this value is not terribly well constrained. Cecchi-Pestellini and Dalgarno (2000) assume in order to increase the H number density, and values as high as have been derived from analysis of the chemistry leading to OH in diffuse clouds (van Dishoeck and Black, 1986). While the flux of high energy ( 100 MeV) cosmic rays can be constrained by observations in the interplanetary medium, the flux of lower energy cosmic rays is essentially unconstrained, due to the influence of the Sun. If the cosmic ray spectrum is assumed not to roll off too rapidly below 100 MeV, it is conceivable that might be as high as s-1 (Hayakawa, Nishimura, and Takayanagi, 1961). A large flux of low energy cosmic rays might increase the H number density in diffuse clouds while not seriously affecting the situation in dense clouds, into which the low energy cosmic rays could not penetrate.
Other sources of H2 ionization have also been suggested. Black (2000) has suggested that X-rays from the luminous stars in the Cygnus OB2 association could increase the effective and therefore (H). While this suggestion might solve the problem for the sightlines toward Cygnus OB2, our observations of high (H) toward several other sources imply that a more general solution is needed. Black (2000) has also suggested that ultraviolet photoionization of H2 might contribute. However, photoionization of H2 requires photons with energies above 15.4 eV, which will ionize H atoms. While Black suggests that such photons could escape the H ii region near the Cygnus OB2 giants, it seems unlikely that they could penetrate the boundaries of diffuse clouds, where H atoms are abundant. Furthermore, our new detections of H again suggest that the sightlines toward the Cygnus OB2 association are not unique.
The last parameter in the equation for the H number density is the dissociative recombination rate (). In this work, we have adopted the value of cm3 s-1 derived from storage ring experiments (Sundström et al., 1994). However, the value of this constant has been the matter of great controversy over the past two decades — other experimental techniques currently yield a value of that is about one order of magnitude lower (for a review of the field, see Larsson (2000)). It has been suggested that the discrepancy might be due to stray fields present in the storage ring experiments, and that the recombination rate under interstellar conditions could be quite low. To make matters worse, attempts to theoretically calculate the recombination rate yield rates more than an order of magnitude smaller than the smallest values obtained in experiments (Orel, Schneider, and Suzor-Weiner, 2000), but it should be noted that the theory of this recombination process is not yet mature. Given the present uncertainty in the true value of , it is possible that the problem of diffuse cloud H may be solved on this front.
4.4 Observational Tests
The resolution of the mystery of diffuse cloud H will most likely come from further observational work. First we must determine with certainty whether the unexpectedly high number density of H is a “local” problem (i.e., due to special conditions in these particular sightlines, or this class of sightlines), or if it is a “global” problem. The present observational situation is summarized in Figure 14, which plots the observed H column density (or the upper limit, denoted by a bar to zero) versus the color excess E(B-V). In addition to the present observations, the detection of H toward the Galactic Center source GC IRS 3 (Geballe et al., 1999) has been added (the H column density plotted is that of the narrow component attributed to diffuse clouds by (Geballe et al., 1999), and the adopted color excess is that attributed to diffuse clouds by (Whittet et al., 1997)). Keeping in mind that
| (4) |
the plot is not inconsistent with a constant (H) and small variations (of a factor of a few) in the average density . Therefore at this stage there is no strong evidence that the “local” parameters (, , and ) are any different in the detection sources than they are in the non-detections such as Oph.
However, this inference needs to be tested directly by observations. This can be achieved by detecting H along a line of sight with lower E(B-V) which can be studied by FUSE and HST. Once the column densities of H, H i, H2, C i, C ii, CO, and CH are obtained for a single sightline, the influence of the “local” parameters will be directly determined.
Assuming that these parameters are found to have their canonical values, we will be left with the ratio . Absent a speedy resolution from the experimenters or theorists in the field of dissociative recombination, further insight into these two constants can perhaps best be obtained through an observational survey of H in more heavily reddened lines of sight. The rate of H destruction is controlled by (which depends on the optical depth in the ultraviolet), whereas the rate of H formation is controlled by (which, with a given incident cosmic ray spectrum, depends on the stopping power of the cloud as a function of cosmic ray energy). Therefore, a detailed study of the diffuse-to-dense cloud transition, along with chemical models, could help constrain the values of and . The highly-reddened, early-type subset of the Stephenson catalog recently compiled by Rawlings, Adamson, and Whittet (2000) may serve as a good starting point for such a study.
5 Conclusions
The H molecular ion has now been definitely detected in seven diffuse cloud lines of sight, suggesting that its unexpectedly high abundance is not due to the peculiarities of a particular region (the Cygnus OB2 association), but rather a general feature of the diffuse interstellar medium. H is observed in clouds with and without CO, C2, and CN, confirming that the chemistry that leads to H is completely decoupled from that which is responsible for these heavier diatomics. The most likely explanation for the high H abundance is a larger than expected ratio — due either to a larger flux of low-energy cosmic rays or to a lower value of in interstellar conditions. The possibility of a lower than expected electron density has not been ruled out, and should be directly tested by finding H in a less reddened source.
References
- Aldrovandi and Pequignot (1973) Aldrovandi, S. M. V. and Pequignot, D. 1973, A&A, 25, 137
- Black (2000) Black, J. H. 2000, Phil. Trans. R. Soc. Lond., A358, 2515
- Bohlin, Savage, and Drake (1978) Bohlin, R. C., Savage, B. D., and Drake, J. F. 1978, ApJ, 224, 132
- Cardelli et al. (1996) Cardelli, J. A., Meyer, D. M., Jura, M., and Savage, B. D. 1996, ApJ, 467, 334
- Cecchi-Pestellini and Dalgarno (2000) Cecchi-Pestellini, C. and Dalgarno, A. 2000, MNRAS, 313, L6
- Danks, Federman, and Lambert (1984) Danks, A. C., Federman, S. R., and Lambert, D. L. 1984, A&A, 130, 62
- Davis et al. (1986) Davis, S. P., Shortenhaus, D., Stark, G., Phillips, J. G., and Engleman, R., Jr., 1986, ApJ, 303, 892
- Federman and Huntress (1989) Federman, S. R. and Huntress, W. T., Jr. 1989, ApJ, 338, 140
- Geballe et al. (1999) Geballe, T. R., McCall, B. J., Hinkle, K. H., and Oka, T. 1999, ApJ, 510, 251
- Gredel (1999) Gredel, R. 1999, A&A, 351, 657
- Gredel and Münch (1994) Gredel, R. and Münch, G. 1994, A&A, 285, 640
- Hayakawa, Nishimura, and Takayanagi (1961) Hayakawa, S., Nishimura, S., and Takayanagi, T. 1961, PASJ, 13, 184
- Herbst and Klemperer (1973) Herbst, E. and Klemperer, W. 1973, ApJ, 185, 505
- Hobbs (1973) Hobbs, L. M. 1973, ApJ, 181, 79
- Huré and Roueff (1996) Huré, J. M. and Roueff, E. 1996, A&AS, 117, 561
- Lambert, Sheffer, and Crane (1990) Lambert, D. L.,, Sheffer, Y., and Crane, P. 1990, ApJ, 359, L19
- Lamers, de Groot, and Cassatella (1983) Lamers, H. J. G. L. M., de Groot, M., and Cassatella, A. 1983, A&A, 128, 299
- Larsson (2000) Larsson, M. 2000, Phil. Trans. R. Soc. Lond., A358, 2433
- Larsson and Siegbahn (1983) Larsson, M. and Siegbahn, P. E. M. 1983, Chem. Phys., 76, 175
- Larsson, Siegbahn, and Ågren (1983) Larsson, M., Siegbahn, P. E. M., and Ågren, H. 1983, ApJ, 272, 369
- Lepp and Dalgarno (1988) Lepp, S. and Dalgarno, A. 1988, ApJ, 335, 769
- Magnani and Onello (1995) Magnani, L. and Onello, J. S. 1995, ApJ, 443, 169
- McCall et al. (1998a) McCall, B. J., Geballe, T. R., Hinkle, K. H., and Oka, T. 1998a, Science, 279, 1910
- McCall et al. (1998b) McCall, B. J., Hinkle, K. H., Geballe, T. R., and Oka, T. 1998b, Faraday Discussions, 109, 267
- McCall et al. (1999) McCall, B. J., Geballe, T. R., Hinkle, K. H., and Oka, T. 1999, ApJ, 522, 338
- McCall (2000) McCall, B. J. 2000, Phil. Trans. R. Soc. Lond., A358, 2385
- McCall and Oka (2000) McCall, B. J. and Oka, T. 2000, J. Chem. Phys., 113, 3104
- McCall (2001) McCall, B. J. 2001, Spectroscopy of H in Laboratory and Astrophysical Plamsas, Ph. D. thesis, University of Chicago [available online at http://h3plus.uchicago.edu]
- Orel, Schneider, and Suzor-Weiner (2000) Orel, A. E., Schneider, I. F., and Suzor-Weiner, A. 2000, Phil. Trans. R. Soc. Lond., A358, 2445
- Pendleton et al. (1994) Pendleton, Y. J., Sandford, S. A., Allamandola, L. J. Tielens, A. G. G. M., and Sellgren, K. 1994, ApJ, 437, 683
- Perryman et al. (1997) Perryman, M. A. C., Lindegren, L., Kovalevsky, J., Hoeg, E., Bastian, U., Bernacca, P. L., Crézé, M., Donati, F., Grenon, M., Grewing, M., van Leeuwen, F., van der Marel, H., Mignard, F., Murray, C. A., Le Poole, R. S., Schrijver, H., Turon, C., Arenou, F., Froeschlé, M., and Petersen, C. S. 1997, A&A, 323, L49
- Racine (1968) Racine, R. 1968, AJ, 73, 233
- Rawlings, Adamson, and Whittet (2000) Rawlings, M. G., Adamson, A. J., and Whittet, D. C. B. 2000, ApJS, 131, 531
- Schulte (1958) Schulte, D. H. 1958, ApJ, 128, 41
- Smith, Shara, and Moffat (1990) Smith, L. F., Shara, M. M., and Moffat, A. F. J. 1990, ApJ, 358, 229
- Snow, York, and Welty (1977) Snow, T. P., York, D. G., and Welty, D. E. 1977, AJ, 82, 113
- Sofia et al. (1997) Sofia, U. J., Cardelli, J. A., Guerin, K. P., and Meyer, D. M. 1997, ApJ, 482, L105
- Sundström et al. (1994) Sundström, G., Mowat, J. R., Danared, H., Datz, S., Broström, L., Filevich, A., Källberg, A., Mannervik, S., Rensfelt, K. G., Sigray, P., af Ugglas, M., and Larsson, M. 1994, Science, 263, 785
- Torres-Dodgen, Carroll, and Tapia (1991) Torres-Dodgen, A. V., Carroll, M., and Tapia, M. 1991, MNRAS, 249, 1
- van der Hucht et al. (1996) van der Hucht, K. A., Morris, P. W., Williams, P. M., Setia Gunawan, D. Y. A., Beintema, D. A., Boxhoorn, D. R., de Graauw, Th., Heras, A., Kester, D. J. M., Lahuis, F., Leech, K. J., Roelfsema, P. R., Salama, A., Valentijn, E. A., and Vandenbussche, B. 1996, A&A, 315, L193
- van Dishoeck (1983) van Dishoeck, E. F. 1983, Chem. Phys., 77, 277
- van Dishoeck and Black (1982) van Dishoeck, E. F. and Black, J. H. 1982, ApJ, 258, 533
- van Dishoeck and Black (1986) van Dishoeck, E. F. and Black, J. H. 1986, ApJS, 62, 109
- van Dishoeck and Black (1988) van Dishoeck, E. F. and Black, J. H. 1988, ApJ, 334, 771
- van Dishoeck and Black (1989) van Dishoeck, E. F. and Black, J. H. 1989, ApJ, 340, 273
- Watson (1973) Watson, W. D. 1973, ApJ, 183, L17
- Wegner (1994) Wegner, W. 1994, MNRAS, 270, 229
- Whittet et al. (1997) Whittet, D. C. B., Boogert, A. C. A., Gerakines, P. A., Schutte, W., Tielens, A. G. G. M., de Graauw, T., Prusti, T., van Dishoeck, E. F., Wesselius, P. R., and Wright, C. M. 1997, ApJ, 490, 729


| Name | V | E(B-V) | Spectral Type | Distance (pc) |
|---|---|---|---|---|
| WR 118 | 22.0 | 4.13aaFrom Pendleton et al. (1994), assuming = / E(B-V) = 3.1. | WC9 | 6300bbSmith, Shara, and Moffat (1990). |
| Cyg OB2 12 | 11.4 | 3.35ccFrom Schulte (1958). | B5Iab | 1700ddTorres-Dodgen, Carroll, and Tapia (1991). |
| WR 104 | 13.5 | 2.10aaFrom Pendleton et al. (1994), assuming = / E(B-V) = 3.1. | WC9 | 1300bbSmith, Shara, and Moffat (1990). |
| Cyg OB2 5 | 9.2 | 1.99ccFrom Schulte (1958). | O7e | 1700ddTorres-Dodgen, Carroll, and Tapia (1991). |
| WR 121 | 11.9 | 1.68aaFrom Pendleton et al. (1994), assuming = / E(B-V) = 3.1. | WC9 | 1690bbSmith, Shara, and Moffat (1990). |
| HD 168607 | 8.25 | 1.61eeFrom Snow, York, and Welty (1977). | B9Ia | 1100ffOur estimate (spectroscopic parallax). |
| HD 183143 | 6.9 | 1.28eeFrom Snow, York, and Welty (1977). | B7Ia | 1000ffOur estimate (spectroscopic parallax). |
| HD 194279 | 7.1 | 1.22eeFrom Snow, York, and Welty (1977). | B1.5Ia | 1100ffOur estimate (spectroscopic parallax). |
| HD 20041 | 5.8 | 0.70ggRacine (1968). | A0Ia | 1400ffOur estimate (spectroscopic parallax). |
| P Cygni | 4.8 | 0.63hhFrom Lamers, de Groot, and Cassatella (1983). | B2pe | 1800hhFrom Lamers, de Groot, and Cassatella (1983). |
| Ori | 4.6 | 0.44iiFrom the intrinsic color of Wegner (1994). | B2Iae | 1000ffOur estimate (spectroscopic parallax). |
| Oph | 2.6 | 0.32eeFrom Snow, York, and Welty (1977). | O9V | 140jjFrom Hipparcos catalog (Perryman et al., 1997). |
| Date (UT) | Observatory | Species | Transition | Object | Standard | Time (min) |
|---|---|---|---|---|---|---|
| Jun 25, 1997 | KPNO | CO | =2-0 | HD 183143 | Lyr | 60 |
| Jul 3, 1998 | KPNO | H | (1,1)l | Cyg OB2 12 | Cyg | 30 |
| Jul 3, 1998 | KPNO | H | (1,1)l | Cyg OB2 5 | Cyg | 164 |
| Jul 4, 1998 | KPNO | H | (1,1)l | WR 104 | Lyr | 35 |
| Jul 4, 1998 | KPNO | H | (1,1)l | WR 121 | Lyr | 112 |
| Jul 4, 1998 | KPNO | H | (1,1)l | WR 118 | Cyg | 46 |
| Jul 4, 1998 | KPNO | H | (1,1)l | HD 194279 | Cyg | 92 |
| Jul 4, 1999 | KPNO | CO | =2-0 | Cyg OB2 12 | Cyg | 4 |
| Jul 5, 1999 | KPNO | CO | =1-0 | Cyg OB2 12 | Lyr | 4 |
| Jul 5, 1999 | KPNO | CO | =1-0 | Cyg OB2 5 | Lyr | 8 |
| Jun 25, 2000 | KPNO | H | (1,1)l | Cyg OB2 12 | Cyg | 60 |
| Jun 25, 2000 | KPNO | H | (1,1)l | HD 183143 | Lyr | 84 |
| Jun 25, 2000 | KPNO | H | (1,1)l | P Cygni | Lyr | 78 |
| Jun 26, 2000 | KPNO | H | (1,1)l | Oph | Lyr | 48 |
| Jun 26, 2000 | KPNO | CO | =1-0 | Cyg OB2 12 | Lyr | 36 |
| Jun 26, 2000 | KPNO | CO | =1-0 | Cyg OB2 5 | Lyr | 90 |
| Mar 13, 2001 | KPNO | H | (1,1)l | HD 20041 | CMa | 100 |
| Mar 13, 2001 | KPNO | H | (1,1)l | Ori | CMa | 60 |
| Jul 6, 2000 | UKIRT | H | (1,0),(1,1)u | HD 183143 | Lyr | 29 |
| Jul 6, 2000 | UKIRT | H | (1,0),(1,1)u | Cyg OB2 5 | Cyg | 43 |
| Jul 7, 2000 | UKIRT | H | (1,0),(1,1)u | HD 168607 | Sgr | 25 |
| May 24, 2001 | UKIRT | H | (1,0),(1,1)u | WR 104 | Oph | 8 |
| May 24, 2001 | UKIRT | H | (1,0),(1,1)u | WR 118 | Cyg | 6 |
| May 28, 2001 | UKIRT | CO | =1-0 | HD 183143 | Aql | 24 |
| May 28, 2001 | UKIRT | CO | =1-0 | WR 104 | Sco | 3 |
| May 28, 2001 | UKIRT | CO | =1-0 | WR 118 | Oph | 5 |
| Sep 12, 2000 | McDonald | Cyg OB2 12 | Cyg | 60 | ||
| Sep 12, 2000 | McDonald | ” | ” | Cyg OB2 5 | Cyg | 60 |
| Sep 12, 2000 | McDonald | ” | ” | HD 183143 | Cyg | 60 |
| Sep 12, 2000 | McDonald | C2 | A-X =2-0 | Cyg OB2 12 | Cep | 60 |
| Sep 12, 2000 | McDonald | C2 | A-X =2-0 | Cyg OB2 5 | Cep | 60 |
| Sep 12, 2000 | McDonald | C2 | A-X =2-0 | HD 183143 | Cep | 60 |
| Sep 14, 2000 | McDonald | Cyg OB2 5 | Cyg | 200 | ||
| Sep 14, 2000 | McDonald | ” | ” | HD 183143 | Cyg | 100 |
| Jul 28, 1999 | CSO | 12CO | =2-1 | Cyg OB2 12 | 30’ S | 14 |
| Jul 28, 1999 | CSO | 12CO | =2-1 | Cyg OB2 5 | 30’ S | 14 |
| Jul 28-29, 1999 | CSO | 13CO | =2-1 | Cyg OB2 12 | 30’ S | 32 |
| Jul 28-29, 1999 | CSO | 13CO | =2-1 | Cyg OB2 5 | 30’ S | 32 |
| Jul 28, 1999 | CSO | 13CO | =3-2 | Cyg OB2 12 | 30’ S | 20 |
| Jul 28, 1999 | CSO | 13CO | =3-2 | Cyg OB2 5 | 30’ S | 20 |
| Apr 9, 2000 | NRO | 12CO | =1-0 | Cyg OB2 12 | (=81,=3) | 18 |
| Apr 9, 2000 | NRO | 13CO | =1-0 | Cyg OB2 12 | (=81,=3) | 37 |
| Apr 11, 2000 | NRO | 12CO | =1-0 | Cyg OB2 “A” | (=81,=3) | 10 |
| Apr 11, 2000 | NRO | 12CO | =1-0 | Cyg OB2 “B” | (=81,=3) | 10 |
| Apr 11, 2000 | NRO | 12CO | =1-0 | Cyg OB2 “C” | (=81,=3) | 15 |
| Apr 11, 2000 | NRO | 12CO | =1-0 | Cyg OB2 “D” | (=81,=3) | 10 |
| Apr 14, 2000 | NRO | 12CO | =1-0 | Cyg OB2 5 | (=81,=3) | 13 |
| Oct 13, 2000 | JCMT | 12CO | =2-1 | HD 183143 | (8 MHz) | 60 |
| Oct 13, 2000 | JCMT | 12CO | =2-1 | HD 183143 | (16 MHz) | 60 |
| Dec 14, 2000 | NRO | 12CO | =1-0 | HD 183143 | (3 MHz) | 12 |
| Dec 14, 2000 | NRO | 12CO | =1-0 | HD 183143 | (6 MHz) | 13 |
| Dec 15, 2000 | NRO | 12CO | =1-0 | HD 183143 | (4 MHz) | 31 |
| Dec 15, 2000 | NRO | 12CO | =1-0 | HD 183143 | (9 MHz) | 45 |
| Object | Line | vLSR | FWHM | Wλ | (Wλ)aaStatistical uncertainties (1) are listed. Systematic errors (for instance, due to ratioing of telluric lines) are difficult to estimate and are likely larger. | N(H) | (N)aaStatistical uncertainties (1) are listed. Systematic errors (for instance, due to ratioing of telluric lines) are difficult to estimate and are likely larger. |
|---|---|---|---|---|---|---|---|
| (km/s) | (km/s) | (Å) | (Å) | (1014 cm-2) | (1014 cm-2) | ||
| Cyg OB2 12 | (1,1)l | 7.0 | 14.6 | 0.044 | 0.002 | 2.02 | 0.09 |
| Cyg OB2 5 | (1,1)l | 7.3 | 11.5 | 0.022 | 0.003 | 0.99 | 0.15 |
| (1,1)u | 5.6 | 15.2 | 0.035 | 0.004 | 1.43 | 0.16 | |
| (1,0) | 5.8 | 15.4 | 0.048 | 0.004 | 1.21 | 0.10 | |
| WR 121 | (1,1)l | 9.7 | 17.8 | 0.024 | 0.004 | 1.12 | 0.20 |
| WR 104 | (1,1)l | 10.9 | 15.1 | 0.028 | 0.002 | 1.27 | 0.07 |
| (1,1)u | 11.2 | 14.6 | 0.030 | 0.005 | 1.23 | 0.21 | |
| (1,0) | 7.9 | 18.5 | 0.041 | 0.006 | 1.05 | 0.14 | |
| WR 118 | (1,1)l | 4.8 | 9.5 | 0.019 | 0.001 | 0.89 | 0.06 |
| 47.6 | 12.3 | 0.041 | 0.002 | 1.88 | 0.07 | ||
| (1,1)u | 3.7 | 17.1 | 0.045 | 0.003 | 1.86 | 0.11 | |
| 44.3bbThese two features are overlapped, so the fit results are highly uncertain. | 15.4 | 0.026 | 0.002 | 1.06 | 0.10 | ||
| (1,0) | 8.5bbThese two features are overlapped, so the fit results are highly uncertain. | 21.7 | 0.077 | 0.003 | 1.95 | 0.07 | |
| 48.1 | 19.6 | 0.065 | 0.003 | 1.64 | 0.07 | ||
| HD 183143 | (1,1)l | 8.3ccAffected by telluric line. | 10.5 | 0.020 | 0.002 | 0.94 | 0.08 |
| 23.6 | 8.4 | 0.024 | 0.002 | 1.10 | 0.07 | ||
| (1,1)u | 7.1 | 12.2 | 0.012 | 0.001 | 0.50 | 0.05 | |
| 23.4 | 9.9 | 0.017 | 0.001 | 0.70 | 0.05 | ||
| (1,0) | 5.6 | 14.0 | 0.022 | 0.001 | 0.54 | 0.03 | |
| 22.1 | 11.0 | 0.023 | 0.001 | 0.59 | 0.03 | ||
| HD 20041 | (1,1)l | -0.5 | 11.5 | 0.038 | 0.002 | 1.74 | 0.09 |
| HD 194279 | (1,1)l | — | 10ddAdopted FWHM for purposes of computing upper limits. | — | 0.005 | — | 0.21eeThe firm upper limit for N(H) should be considered to be 3. |
| P Cygni | (1,1)l | — | 10ddAdopted FWHM for purposes of computing upper limits. | — | 0.002 | — | 0.10eeThe firm upper limit for N(H) should be considered to be 3. |
| Oph | (1,1)l | — | 10ddAdopted FWHM for purposes of computing upper limits. | — | 0.001 | — | 0.06eeThe firm upper limit for N(H) should be considered to be 3. |
| HD 168607 | (1,1)u | — | 10ddAdopted FWHM for purposes of computing upper limits. | — | 0.003 | — | 0.13eeThe firm upper limit for N(H) should be considered to be 3. |
| (1,0) | — | 10ddAdopted FWHM for purposes of computing upper limits. | — | 0.003 | — | 0.07eeThe firm upper limit for N(H) should be considered to be 3. | |
| Ori | (1,1)l | — | 10ddAdopted FWHM for purposes of computing upper limits. | — | 0.003 | — | 0.12eeThe firm upper limit for N(H) should be considered to be 3. |
| Object | Line | vLSR | FWHM | Wλ | (Wλ)aaStatistical uncertainties (1) are listed. Systematic errors (for instance, due to ratioing of telluric lines) are difficult to estimate and may be larger. | N(thin)bbListed column densities are for the lower state of each absorption line in the given velocity component. These are direct calculations from the corresponding value of Wλ, in the optically thin limit. For a more detailed analysis of the CO column density towards Cygnus OB2 12, see section 3.2. | (N)aaStatistical uncertainties (1) are listed. Systematic errors (for instance, due to ratioing of telluric lines) are difficult to estimate and may be larger. |
|---|---|---|---|---|---|---|---|
| (km/s) | (km/s) | (Å) | (Å) | (1015 cm-2) | (1015 cm-2) | ||
| Cyg OB2 12 | 5.9 | 4.3 | 0.199 | 0.021 | 2.28 | 0.24 | |
| 11.8 | 6.1 | 0.300 | 0.025 | 3.42 | 0.29 | ||
| 6.0 | 4.1 | 0.344 | 0.024 | 4.71 | 0.32 | ||
| 10.3ccBad fit due to interference of telluric line. | 1.8 | 0.127 | 0.015 | 1.74 | 0.21 | ||
| 7.5 | 6.0 | 0.598 | 0.029 | 2.75 | 0.13 | ||
| 13.1 | 3.8 | 0.285 | 0.023 | 1.31 | 0.11 | ||
| 6.6 | 4.6 | 0.437 | 0.021 | 3.01 | 0.15 | ||
| 12.0 | 3.9 | 0.355 | 0.019 | 2.45 | 0.13 | ||
| 7.6 | 5.1 | 0.248 | 0.010 | 1.91 | 0.08 | ||
| 13.1 | 4.9 | 0.185 | 0.010 | 1.42 | 0.08 | ||
| Cyg OB2 5 | ddOther lines too marginal to fit. | 4.9 | 4.8 | 0.303 | 0.041 | 2.09 | 0.29 |
| 12.2 | 4.5 | 0.204 | 0.041 | 1.40 | 0.28 | ||
| HD 183143 | 25.6 | 13.0 | 0.138 | 0.013 | 0.64 | 0.06 | |
| ddOther lines too marginal to fit. | 24.4 | 16.1 | 0.133 | 0.010 | 0.91 | 0.07 | |
| WR 104 | 21.4 | 12.9 | 0.520 | 0.024 | 2.39 | 0.11 | |
| 21.2 | 12.4 | 0.588 | 0.019 | 4.05 | 0.13 | ||
| 21.5 | 7.2 | 0.247 | 0.014 | 1.89 | 0.11 | ||
| 20.6 | 5.1 | 0.143 | 0.011 | 1.16 | 0.09 | ||
| WR 118 | 10.5 | 18.2 | 1.289 | 0.020 | 5.93 | 0.09 | |
| 45.0eeBlend of two components; individual fit parameters uncertain. | 18.0 | 1.147 | 0.020 | 5.28 | 0.09 | ||
| 59.4eeBlend of two components; individual fit parameters uncertain. | 15.6 | 0.198 | 0.018 | 0.91 | 0.08 | ||
| 85.0 | 14.0 | 0.107 | 0.017 | 0.49 | 0.08 | ||
| 9.2 | 16.6 | 0.962 | 0.015 | 6.63 | 0.10 | ||
| 41.6eeBlend of two components; individual fit parameters uncertain. | 15.1 | 1.078 | 0.014 | 7.43 | 0.10 | ||
| 56.9eeBlend of two components; individual fit parameters uncertain. | 10.5 | 0.204 | 0.012 | 1.41 | 0.08 | ||
| 81.6 | 15.1 | 0.211 | 0.015 | 1.45 | 0.10 | ||
| 9.1 | 12.8 | 0.248 | 0.013 | 1.90 | 0.10 | ||
| 41.7eeBlend of two components; individual fit parameters uncertain. | 10.6 | 0.539 | 0.012 | 4.13 | 0.09 | ||
| 53.6eeBlend of two components; individual fit parameters uncertain. | 13.2 | 0.111 | 0.013 | 0.85 | 0.10 | ||
| 82.9 | 11.1 | 0.144 | 0.012 | 1.10 | 0.09 | ||
| 36.4 | 19.1 | 0.219 | 0.010 | 1.77 | 0.08 | ||
| 82.3 | 12.5 | 0.097 | 0.008 | 0.78 | 0.06 |
| Species | Line | vLSR | HWHM | T (peak) | Area |
|---|---|---|---|---|---|
| (km/s) | (km/s) | (K) | (K km/s) | ||
| 13CO | =1-0 | 6.93 | 1.30 | 0.29 | 0.52 |
| 12.58 | 1.32 | 0.41 | 0.58 | ||
| =2-1 | 6.9 | 1.39 | 0.21 | 0.31 | |
| 12.4 | 1.35 | 0.33 | 0.47 | ||
| 12CO | =1-0 | 7.31 | 2.52 | 1.49 | 3.34 |
| 12.72 | 1.81 | 3.08 | 5.98 | ||
| =2-1 | 7.48 | 1.92 | 0.92 | 1.72 | |
| 12.48 | 2.04 | 1.74 | 3.66 |
| Line | W aaStatistical uncertainties (1) are listed unless otherwise noted. Systematic errors are difficult to estimate and may be larger. | N()1 | v | FWHM1 | W aaStatistical uncertainties (1) are listed unless otherwise noted. Systematic errors are difficult to estimate and may be larger. | N()2 | v | FWHM2 | W aaStatistical uncertainties (1) are listed unless otherwise noted. Systematic errors are difficult to estimate and may be larger. | N()tot |
|---|---|---|---|---|---|---|---|---|---|---|
| (mÅ) | ( cm-2) | (km/s) | (km/s) | (mÅ) | ( cm-2) | (km/s) | (km/s) | (mÅ) | ( cm-2) | |
| (0) | 4.96 0.60 | 4.38 0.53 | 6.7 | 2.8 | 6.87 0.46 | 6.06 0.41 | 12.6 | 1.7 | 11.83 0.76 | 10.4 0.7 |
| (2) | 9.91 0.83 | 17.5 1.5 | 6.7 | 3.1 | 10.67 0.70 | 18.8 1.2 | 12.4 | 2.2 | 20.58 1.09 | 36.3 1.9 |
| (4) | 8.97 0.75 | 15.8 1.3 | 6.6 | 3.2 | 9.65 0.59 | 17.0 1.0 | 12.3 | 2.0 | 18.62 0.95 | 32.8 1.7 |
| (2) | 2.05 0.60 | — | 6.8 | 2.0 | 3.38 0.55 | — | 12.6 | 1.7 | 5.43 0.81 | — |
| (6) | 7.40 0.66 | 13.0 1.2 | 6.6 | 3.1 | 7.33 0.53 | 12.9 0.9 | 12.2 | 2.0 | 14.73 0.85 | 25.9 1.5 |
| — | — | — | — | — | — | — | — | 19 2 bbEstimate of systematic uncertainty. | — | |
| (4)ccEstimated from (4). | — | — | — | — | — | — | — | — | 6 0.3 | — |
| (8)ddBlend equivalent width minus (4) estimate. | — | — | — | — | — | — | — | — | 13 2 bbEstimate of systematic uncertainty. | 22.3 5.2 |
| (10) | 3.9 0.6 | 6.6 1.2 | (6.7)eeValues constrained in the fit to the ratioed spectrum. | (3)eeValues constrained in the fit to the ratioed spectrum. | 3.0 0.5 | 5.3 1.5 | (12.5)eeValues constrained in the fit to the ratioed spectrum. | (2.1)eeValues constrained in the fit to the ratioed spectrum. | 6.9 0.8 | 11.9 2.0 |
| Line | WλaaStatistical uncertainties (1) are listed unless otherwise noted. Systematic errors are difficult to estimate and may be larger. | N() |
| (mÅ) | ( cm-2) | |
| (0) | 6.6 0.8 | 5.8 0.7 |
| (2) | 10.7 1.0 | 18.9 1.8 |
| (4) | 13.5 1.0 | 23.8 1.8 |
| (6) | 8.0 1.2 | 14.1 2.1 |
| 11 3bbEstimate of systematic uncertainty. | — | |
| (4)ccEstimated from (4). | 4.5 0.3 | — |
| (8)ddBlend equivalent width minus (4) estimate. | 7 3bbEstimate of systematic uncertainty. | 12.3 5.3 |
| (10)eeMarginal feature; values very uncertain. | 1.5 0.5 | 2.6 0.9 |
| Object | Species | Line | vLSR | FWHM | Wλ ccStatistical uncertainties (1) are listed unless otherwise noted. Systematic errors are difficult to estimate and may be larger. | N ccStatistical uncertainties (1) are listed unless otherwise noted. Systematic errors are difficult to estimate and may be larger. |
|---|---|---|---|---|---|---|
| (km/s) | (km/s) | (mÅ) | ( cm-2) | |||
| Cyg OB2 5 | CH | 4300 | 5.6 | 6.0 | 26.5 0.7 | 44.0 1.2 ddEstimated using the CH curve of growth of van Dishoeck and Black (1989), assuming =1 km/s. All other column densities computed assuming the lines are optically thin. |
| 12.7 | 3.4 | 7.1 0.5 | 9.2 0.6 ddEstimated using the CH curve of growth of van Dishoeck and Black (1989), assuming =1 km/s. All other column densities computed assuming the lines are optically thin. | |||
| HD 183143 | CH | 4300 | 7.7 | 7.7 | 12.3 0.7 | 17.0 1.0 ddEstimated using the CH curve of growth of van Dishoeck and Black (1989), assuming =1 km/s. All other column densities computed assuming the lines are optically thin. |
| 23.6 | 4.9 | 18.6 0.6 | 27.7 0.9 ddEstimated using the CH curve of growth of van Dishoeck and Black (1989), assuming =1 km/s. All other column densities computed assuming the lines are optically thin. | |||
| Cyg OB2 5 | CH+ | 4233 | 2.6 | 5.0 | 11.2 0.6 | 12.8 0.7 |
| 7.6 | 4.1 | 7.1 0.6 | 8.1 0.7 | |||
| 13.3 | 8.9 | 11.8 0.8 | 13.5 0.9 | |||
| HD 183143 | CH+ | 4233 | 9.0 | 4.9 | 18.3 0.5 | 21.0 0.6 |
| 24.8 | 4.5 | 22.1 0.5 | 25.3 0.6 | |||
| Cyg OB2 12 | CN | A-X R2(0) | 6.8 | 1.1 | 1.3 0.4 | 3.1 1.0 |
| 12.4 | 1.7 | 4.3 0.6 | 10.3 1.4 | |||
| Cyg OB2 5 | CN | A-X R2(0) | 5.6 | 2.0 | 1.2 0.3 | 2.9 0.7 |
| 13.7 | 1.7 | 1.4 0.3 | 3.4 0.7 | |||
| B-X R(0) | 5.6 | 3.9 | 4.1eeThese values are extremely uncertain due to the low flux of Cygnus OB2 5 at violet wavelengths. | 0.9eeThese values are extremely uncertain due to the low flux of Cygnus OB2 5 at violet wavelengths. | ||
| 12.1 | 3.9 | 2.8eeThese values are extremely uncertain due to the low flux of Cygnus OB2 5 at violet wavelengths. | 0.6eeThese values are extremely uncertain due to the low flux of Cygnus OB2 5 at violet wavelengths. | |||
| HD 183143 | CN | B-X R(0) | 25.2 | 2.5 | 5.6 0.4 | 1.3 0.1 |
| B-X R(1) | 24.1 | 1.5 | 1.2 0.2 | 0.4 0.1 |
| Object | (H) | L | d | E(B-V) | (H2) + (H) | |
|---|---|---|---|---|---|---|
| ( cm-2) | (pc) | (pc) | (mag) | ( cm-2) | (cm-3) | |
| Cyg OB2 12 | 3.8aaFrom McCall et al. (1998a). | 905 | 1700bbTorres-Dodgen, Carroll, and Tapia (1991). | 3.35ccFrom Schulte (1958). | 12.95 | 4.8 |
| Cyg OB2 5 | 2.6ddThe UKIRT observations of (1,0) and (1,1)u are adopted for these sources. | 629 | 1700bbTorres-Dodgen, Carroll, and Tapia (1991). | 1.99ccFrom Schulte (1958). | 7.69 | 4.1 |
| HD 183143 | 2.3ddThe UKIRT observations of (1,0) and (1,1)u are adopted for these sources. | 552 | 1000eeOur estimate (spectroscopic parallax). | 1.28ffFrom Snow, York, and Welty (1977). | 4.95 | 3.0 |
| HD 20041 | 3.5ggTotal H column density estimated to be twice that of para-H. | 833 | 1400eeOur estimate (spectroscopic parallax). | 0.70hhRacine (1968). | 2.71 | 1.1 |
| WR 121 | 2.2ggTotal H column density estimated to be twice that of para-H. | 524 | 1690iiSmith, Shara, and Moffat (1990). | 1.68jjFrom Pendleton et al. (1994), assuming = / E(B-V) = 3.1. | 6.50 | 4.1 |
| WR 104 | 2.3ddThe UKIRT observations of (1,0) and (1,1)u are adopted for these sources. | 547 | 1300iiSmith, Shara, and Moffat (1990). | 2.10jjFrom Pendleton et al. (1994), assuming = / E(B-V) = 3.1. | 8.12 | 4.9 |
| WR 118 | 6.5ddThe UKIRT observations of (1,0) and (1,1)u are adopted for these sources. | 1548 | 6300iiSmith, Shara, and Moffat (1990). | 4.13jjFrom Pendleton et al. (1994), assuming = / E(B-V) = 3.1. | 15.97 | 3.4 |
| HD 194279 | 1.2ggTotal H column density estimated to be twice that of para-H. | 286 | 1100eeOur estimate (spectroscopic parallax). | 1.22ffFrom Snow, York, and Welty (1977). | 4.72 | 5.5 |
| HD 168607 | 0.6 | 143 | 1100eeOur estimate (spectroscopic parallax). | 1.61ffFrom Snow, York, and Welty (1977). | 6.23 | 14.5 |
| P Cygni | 0.6ggTotal H column density estimated to be twice that of para-H. | 143 | 1800kkFrom Lamers, de Groot, and Cassatella (1983). | 0.63kkFrom Lamers, de Groot, and Cassatella (1983). | 2.44 | 5.7 |
| Ori | 0.7ggTotal H column density estimated to be twice that of para-H. | 171 | 1000eeOur estimate (spectroscopic parallax). | 0.44llFrom the intrinsic color of Wegner (1994). | 1.70 | 3.3 |
| Oph | 0.4ggTotal H column density estimated to be twice that of para-H. | 86 | 140mmFrom Hipparcos catalog (Perryman et al., 1997). | 0.32ffFrom Snow, York, and Welty (1977). | 1.24 | 4.8 |