The Ca II Triplet as an Abundance Indicator
Abstract
How can we accurately determine the metallicity of faint red giant stars in nearby galaxies? The equivalent widths of the broad absorption lines from Ca II at 8498 Å, 8542 Å, and 8662 Å (the calcium triplet) have shown a smooth relationship to metallicity, [Fe/H], in Galactic globular clusters, i.e., old, metalpoor stars. The exact relationship depends on the [Fe/H] scale assumed. The sensitivity of the sum of the equivalent widths, , to [Fe/H] has been well studied for metalpoor stars, but theory and observations show that , will become less sensitive to [Fe/H] for young or metalrich stars, but this needs to be calibrated. Built into the present calibration of to [Fe/H] is also a dependence on the Galactic [Ca/Fe] to [Fe/H] relationship, which is a function of the Galaxy’s star formation history (SFH) and chemical evolution. Our goal is to remove uncertainties in the [Fe/H] scale used in previous calibrations and remove the dependence on galactic evolution. We are obtaining high dispersion spectra to self-consistently calibrate the calcium triplet to give [Ca/H] abundances, and extend the current calibration to nearsolar metallicities and to ages as young as 2 Gyrs.
Department of Physics & Astronomy, 4129 Fredrick Reines Hall, University of California, Irvine, CA 926974675
Department of Physics & Astronomy, 4129 Fredrick Reines Hall, University of California, Irvine, CA 92697–4675
Observatories of the Carnegie Institute of Washington; 813 Santa Barbara St., Pasadena, CA 91101
1. Introduction
Establishing the absolute and relative ages of stars is a problem which continues to plague modern astronomy. Obviously, the accurate determination of these ages places strong constraints on the chemical evolution and SFH of the galaxy in which the stars reside. Photometry alone cannot be used to determine age because of the agemetallicity degeneracy of broad–band colors. High dispersion observations can accurately determine metallicity and, combined with the CMDs, tie down ages. However, high–dispersion observations require long exposure times to obtain a high signal–to–noise ratio (S/N) and, for faint or extra–galactic stars, this becomes impractical. To determine cluster ages, methods to find metallicity accurately from other observational techniques are needed.
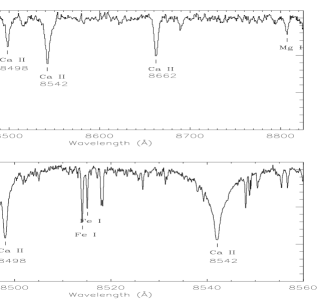
The nearinfrared Ca II triplet, at 8498 Å, 8542 Å, and 8662 Å, are very strong spectral features (See Fig. 1). With moderate S/N ( 50) and moderate instrumental resolution ( 4 Å), the sum of the equivalent widths, , can be determined with an accuracy of 0.10 (see, for example, Rutledge, et al. [1997a]; hereafter, Rut97a) making it a useful tool if its relationship to metallicity is well determined. Zinn & West [1984] (ZW84) found a smooth correlation between and iron abundance, [Fe/H]. Their [Fe/H] scale was developed from a large data set of 121 Galactic globular clusters, GGCs, with [Fe/H] determined from various spectroscopic indices. Armandroff & Da Costa [1991] found that changes with V VHB due to changes in gravity. To remove the effects of gravity to first order, they defined a new Ca II index, (V V where is the sum of the equivalent widths of the two strongest Ca II lines. Carretta and Gratton [1997] (CG97) rederived the calibration with a much smaller data set than ZW84, 24 GGCs, but determined [Fe/H] values using only high dispersion spectroscopy of Fe lines. The CG97 and ZW84 scales yield different relationships for to [Fe/H]. To clarify the differences, Rutledge, et al. [1997b] (Rut97b) systematically compared the [Fe/H] scales used by the two groups.
Rut97a observed 52 GGCs to determine the Ca II index and used these values to compare the ZW84 and CG97 [Fe/H] scales. The Ca II index developed by Rut97b is (V VHB) where (with weights chosen to minimize ). They found that the to [Fe/H] relation was non-linear for the ZW84 scale and linear for the CG97 scale. In fact, the differences in the derived values of [Fe/H] can be as great as 0.3 dex depending upon the [Fe/H] scale used. This can lead to errors of several Gyrs when using these metallicities to determine clusters ages. The differences in the scales are most dramatic for young and metalrich clusters which were not used to determine either calibration. Some theoretical work (e.g., Jorgensen, et al. [1992]) has shown that the dependence of on [Fe/H] may change for more metalrich stars so the relationship will change at high [Fe/H]. The uncertainty in the to [Fe/H] relationship over a range of age and metallicities remains undetermined though the ZW84 and the CG97 relationships have been widely used.
An additional uncertainty in the calibration of to [Fe/H] is the assumption of a Galactic [Ca/Fe] vs. [Fe/H] relationship. All observations used to determine the scales were done using GGCs which have a [Ca/Fe] vs. [Fe/H] relationship that depend on the unique chemical evolution and SFH of our Galaxy. Also, considerable scatter around the mean relationship exists. Since Ca comes primarily from Type II supernovae and Fe comes from both Type II and Type Ia supernovae (e.g., Carney, B.W. [1996]), the ratio of these elements will depend upon the SFH and chemical evolution of the Galaxy. Applying the relationship to extragalactic stars adds an uncertainty to the derived abundances.
To properly calibrate the relation of to abundances and remove the dependence on SFH, we propose to calibrate the relationship between and [Ca/H]. In addition, we will recalibrate and extend the calibration of to our new [Fe/H] scale. will be determined from low dispersion spectra and our results tied to the well-defined scaled of Rut97a. [Ca/H] and [Fe/H] will be determined by measuring Fe I, Fe II and Ca I from newly obtained, high–dispersion spectra. We will be observing Galactic open and globular cluster stars in order to assure that our new calibration is valid over a wide range of ages and abundances.
2. Observations
We will be using observations of 25 star clusters to determine the relation of to [Ca/H] and to [Fe/H]. Twenty are globular clusters with approximate ages of 14 Gyrs and iron abundances [Fe/H] ; most were well studied by Rut97 and have well determined Ca II strengths () but [Ca/H] and [Fe/H] need to be determined. Five clusters are open clusters with ages from 1.6 to 8 Gyrs and -0.4 [Fe/H] 0.4. Open clusters have not been as well studied spectroscopically so we will measure , [Ca/H] and [Fe/H].
2.1. Low Dispersion
measurements were made on spectra taken with the Kast Double Spectrograph on the Shane 3–meter Telescope at the University of California’s Lick Observatory. A dispersion of 1.7 Å pix-1 and a wavelength coverage of 7580 9620 Å (resolution 4 Å ) were used for the low dispersion observations. Exposure times were chosen to give S/N 50, which will yield 0.1 Å per.
To assure accuracy in our values of , we average over 10 to 15 stars per cluster which were selected from broad–band photometry and radial velocity data, if available.
2.2. High Dispersion
Most of our high dispersion observations were made using the HamiltonEchelle Spectrograph on the Shane 3–meter Telescope at Lick Observatory. Four of the fainter clusters were observed with the High Resolution Spectrograph on the Keck I 10–meter Telescope at the W.M. Keck Observatory. These observations were made with a dispersion of 0.05 Å pix-1 and a wavelength coverage of 5200 9000 Å (resolution 0.15 Å ). Exposure times were chosen to give S/N 60 per star. Averaging over 5 to 8 red giants per cluster we should obtain abundances with and 0.1 dex per cluster.
The large wavelength range is necessary since we will be measuring many lines from these spectra in order to determine [Ca/H] and [Fe/H]: 10 to 15 Ca I lines; 70 Fe I lines; 4 to 8 Fe II lines. Measurements of the equivalent widths will be made using the GETJOB program (A. McWilliam, 1999). Ca I, rather than Ca II, lines will be used to determine [Ca/H] because the formation of the weak Ca I lines are well understood and accurately determined using local thermodynamic equilibrium (LTE) models while the formation of the strong Ca II lines are more complex.
Acknowledgements: Financial support for this project was provided by National Science Foundation grant AST-0070985 to TSH. TB also thanks the ARCS Foundation for fellowship support.
References
Armandroff, T.E., and Da Costa, G. S. 1991, AJ, 101, 1329
Carretta, E. & Gratton, R. G. 1997, A&AS, 121, 95 (CG97)
Carney, B. W. 1996, PASP, 108, 900
Jorgensen, U.G, et al. 1992, A&A, 254, 258
Rutledge, G. A., et al. 1997, 109, 883 (Paper I) (Rut97a)
Rutledge,G. A., Hesser, J. E., Stetson, P. B. 1997, PASP, 109, 907 (Paper II) (Rut97b)
Zinn, R. & West, M.J. 1984, ApJS, 55, 45 (ZW84)