11email: hashimot@aip.de 22institutetext: Service d’Astrophysique CEA Saclay, 91191 Gif sur Yvette Cedex, France
33institutetext: European Southern Observatory, D-85748 Garching, Germany
44institutetext: Department of Physics, Carnegie Mellon University, 5000 Forbes Ave., Pittsburgh, PA 15213, USA
XMM-Newton Observation of a Distant X-ray Selected Cluster of Galaxies at z=1.26 with Possible Cluster Interaction
We report on the XMM-Newton observation of RXJ1053.7+5735, one of the most distant (z = 1.26) X-ray selected clusters of galaxies, which also shows an unusual double-lobed X-ray morphology, indicative of possible cluster-cluster interaction. The cluster was discovered during our ROSAT deep pointings in the direction of the Lockman Hole. The XMM-Newton observations were performed with the European Photon Imaging Camera (EPIC) during the performance verification phase. Total effective exposure time was 100 ksec. The best fit temperature based on a simultaneous fit of spectra from the all EPIC cameras (pn+MOS) is 4.9 keV. Metallicity is poorly constrained even using the joint fit of all spectra, with an upper limit on the iron abundance of 0.62 solar. Using the best fit model parameters, we derived an unabsorbed (0.2-10) keV flux of = 3.0 10-14 erg cm -2 s-1, corresponding to a bolometric luminosity of = 3.4 1044 herg s-1. Despite the fact that it was observed at fairly large off-axis angle, the temperature errors are much smaller compared with those of typical measurements based on ASCA or Beppo-Sax observations of high-z (z 0.6) clusters, demonstrating the power of the XMM for determining the X-ray temperature for high-z clusters. The measured temperature and luminosity show that one can easily reach the intrinsically X-ray faint and cool cluster regime comparable with those of z 0.4 clusters observed by past satellites. The new cluster temperature and Lbol we have measured for RXJ1053.7+5735 is consistent with a weak/no evolution of the Lbol - Tx relation out to z 1.3, which lends support to a low universe, although more data-points of z 1 clusters are required for a more definitive statement. The caution has to be also exercised in interpreting the result, because of the uncertainty associated with the dynamical status of this cluster.
Key Words.:
Galaxies: clusters: general – X-rays: galaxies – Galaxies: evolution1 Introduction
Clusters of galaxies can be identified to high redshift and can be used as tracers of the evolution of structure. Since the evolution of structure depends on parameters such as , , & in hierarchical cosmologies, the study of the evolution of galaxy clustering provides us with an important constraint on the cosmology (e.g. Press & Schechter 1974; Peebles et al. 1989; Eke et al. 1996). X-ray observations provide a powerful and unique means of selecting the clusters and characterizing their properties, as X-ray flux is proportional to the square of the electron density, and therefore less affected than optical data by the superposed structures. Measurements of the gas temperatures in high redshift clusters of galaxies strongly constrain cosmological models because cluster temperatures are closely related to cluster masses, and the evolution of the cluster mass function with redshift is quite sensitive to cosmological parameters.
X-ray cluster surveys based on ROSAT-PSPC data (e.g. Rosati et al. 1995, 98; Scharf et al. 1997; Burke et al 1997; Vikhlinin et al. 1998) detect sizable samples of distant clusters (z 0.5). Although the number of high-z clusters has significantly increased, intracluster medium (ICM) properties (such as X-ray temperature: Tx) at high redshift are still largely unexplored. This is due to the limited effective area and spatial resolution of the past X-ray missions; only long ASCA/Beppo-SAX observations, with a broad energy response, have allowed studies of the high-z cluster ICM properties. Only a few high-z (z 0.6) clusters have directly measured X-ray temperatures (e.g. Donahue et al. 1999; Della Ceca et al. 2000). Moreover, these high-z samples are inevitably biased toward intrinsically X-ray bright, and thus high temperature clusters, which complicates the investigation of ICM evolution.
Advent of Chandra, with its bigger effective area and higher angular resolution than the past satellites, made us possible to effectively study the ICM properties of high-z clusters. Chandra’s high angular resolution, in particular, greatly helps us to avoid confusion with point sources (e.g. Stanford et al. 2001; Borgani et al. 2001; Jeltema et al. 2001; Cagnoni et al. 2001). Unfortunately, for those with directly measured Tx, the errors on Tx are still relatively large. Moreover, Chandra is not particularly sensitive to low surface brightness emission, which is sometimes unfavorable for the analysis of faint X-ray features often present in high-z clusters.
The XMM-Newton (XMM) pn and MOS CCD cameras have 10 times larger effective area than ASCA GIS/SIS & Beppo-SAX MECS (in addition to the fact that it has significantly sharper PSF than ASCA & Beppo-Sax). Even compared with Chandra ACIS, the effective area is more than 5 times larger which helps to increase the accuracy of the Tx determination per given exposure time. With its high throughput and moderate (compared with Chandra) angular resolution, XMM is extremely sensitive to low surface brightness X-ray emission. These properties make XMM pn/MOS very suitable instruments to investigate the ICM properties of distant clusters.
In this paper, we report on the XMM observation of one of the most distant X-ray selected clusters (z = 1.26) of galaxies, which also shows an unusual double-lobed X-ray morphology. This cluster, RXJ1053.7+5735, was discovered during our deep ROSAT HRI pointings in the direction of the “Lockman Hole”, a line of sight with exceptionally low HI column density (Hasinger et al. 1998a ). RXJ1053.7+5735 is one of the most distant clusters ever selected by diffuse X-ray emission (for another most distant X-ray selected cluster at z=1.26, RXJ0848.9+4452, see Rosati et al. 1999; Stanford et al. 2001). Together with the fact that its X-ray morphology is clearly double-lobed and highly anisotropic, which may well be a sign of a cluster in the making, the RXJ1053.7+5735 may provide us with unique information to better understand the evolution of clusters and galaxies in the early universe. Throughout the paper, we use = 100 km s-1 Mpc-1 and = 0.5.
2 RXJ1053.7+5735
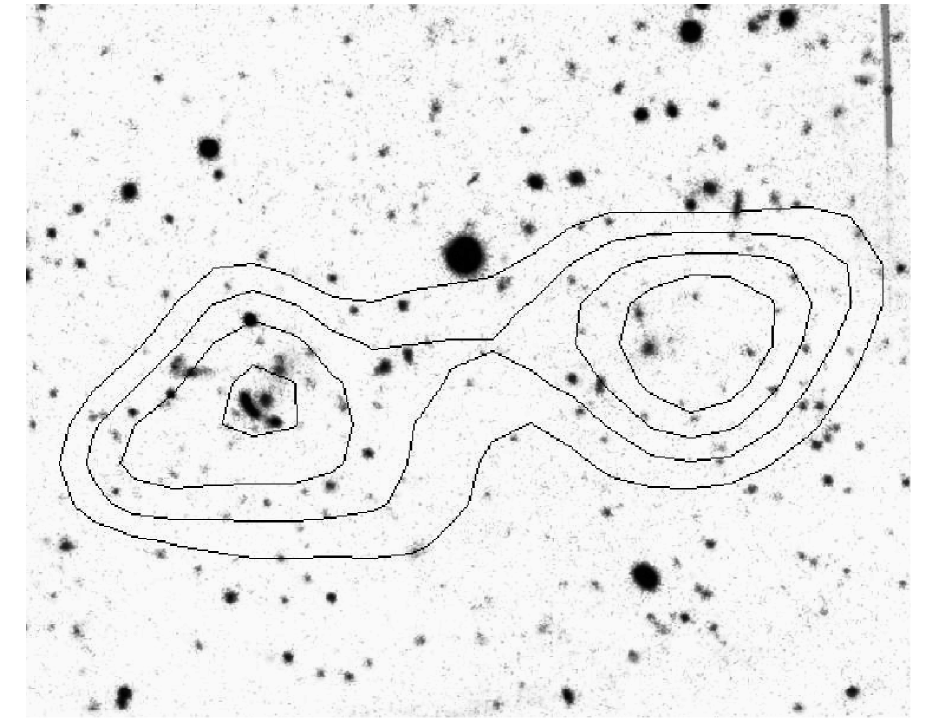
The X-ray source RXJ1053.7+5735 was discovered during our deep pointings of 1.31 Msec with ROSAT HRI in the direction of the Lockman Hole. Figure 1 shows the HRI contours superposed on the image composed of V, R, & I band exposures, where North is up and East is left. The HRI image revealed a clearly extended X-ray emission with unusual double-lobed X-ray morphology. The angular size of the source is 1.7 0.7 arcmin2 and its X-ray flux is 2 10-14 erg cm-2 s-1 (Hasinger et al. 1998b ). Our subsequent deep optical/NIR imaging follow-ups (V 26.5, R 25, I 25, K 20.5) with LRIS and NIRC on Keck, and the Calar Alto Omega Prime camera revealed a bright 7 arcsecond-long arc with an integrated magnitude of R=21.4, and an overdensity of galaxies in both X-ray lobes (e.g. Thompson et al. (2001)). Further Keck LRIS/NIRSPEC spectroscopic observations on the bright arc and one of the brightest possible member galaxies confirmed that the bright arc is a lensed galaxy at a redshift z = 2.57 and the galaxy is at a redshift of z = 1.263 (Thompson et al. (2001)). Deep VRIzJHK photometry data also produced concordant photometric redshifts for more than 10 objects at redshift of z 1.3, confirming that at least the eastern lobe is a massive cluster at high redshift. The improbability of chance alignment and similarity of colors for the galaxies in the two X-ray lobes are consistent with the western lobe also being at z 1.3 (see Thompson et al. (2001) for further details). The present data are all consistent with the identification of the X-ray source with one or two high redshift cluster(s) of galaxies. The spatial distribution of the X-ray gas and cluster galaxies in this system suggest that it could be a valuable example of a dynamically unsettled high redshift cluster, however, further optical, NIR, & X-ray investigations are planned for a more definitive statement about the dynamical state of this interesting cluster.
3 XMM Observations and Data Reduction
The XMM observations of the cluster RXJ1053.7+5735 were performed with the European Photon Imaging Camera (EPIC) during the period April 27- May 19, 2000 as a part of the performance verification (PV) phase Lockman Hole observation centered on the sky position RA 10:52:43, DEC +57:28:48 (J2000), for a total exposure time of 190 ksec. The cluster center is at an off-axis angle of 10′ from the pointing center, and this causes a vignetting effect, on the average, of a factor of about two with respect to the pointing center. The EPIC cameras were operated in the standard full-frame mode. The thin filter was used for the pn camera, while the thin and thick filters were used for the two MOS cameras. The pn detector consists of 12 CCDs each 13.6 4.4 arcmin, with energy resolutions of 6.7% at 1 keV, while MOS detectors consist of 7 CCDs each 10.9 10.9 arcmin with energy resolutions of 5.7% at 1 keV. The sensitive FOV of both detector is about 30′diameter and the energy range is both 0.1 to 15 keV. (For further details of the PV Lockman Hole observation, see Hasinger et al. (2001))
Light curves were visually inspected, and time intervals with high background (0.5-10 keV count rate higher than 8 cts/s for the pn and 3 cts/s for MOS) were excluded. We used both single and double events. The remaining effective exposure times for each of three detectors were approximately 100 ksec. The astrometries calculated from the WCS keywords were offset by 5″-25″ from the known optical counterparts. Thus, a transversal shift and a rotation angle were fit for each dataset, leading to residual systematic position errors of 1″-2″.
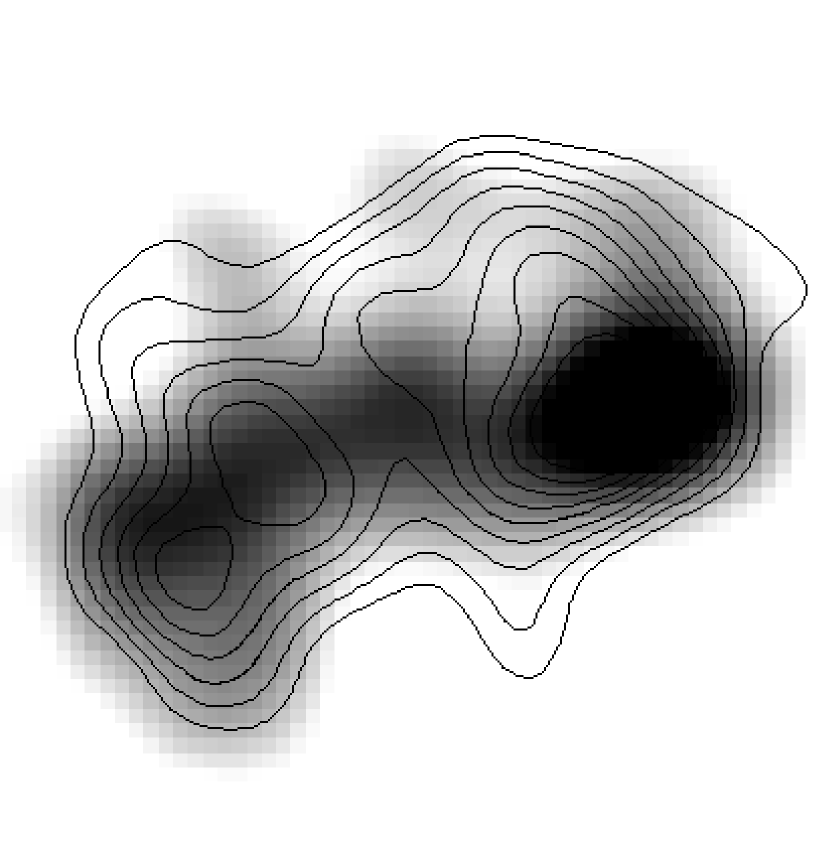
Fig. 2 shows the exposure corrected XMM image of RXJ1053.7+5735 in the 0.5-2 keV band, an energy range where the bulk of the redshifted cluster emission falls upon and therefore the contrast against the background is the strongest. The image was created by combining all events from three (pn, MOS1, & MOS2) cameras. The raw data were smoothed with a Gaussian with = 7″. The lowest contour is 2 above the background, and the contour interval is 0.5. A combined exposure map was calculated for the pn plus MOS cameras.
Fig. 2 clearly shows that the cluster emission is extended and double-lobed, consistent with the ROSAT HRI image, and its shape is indicative of non-regularity of this cluster. Unfortunately, the pointing variation between the different revolutions was not large enough to clearly remove the effect of inter-CCD gaps, which happen to run through the cluster, particularly around the eastern lobe, and this somewhat distorted the level and shape of the eastern-lobe contours.
4 Spectral Analysis
The spectra were extracted from an elliptical region centered at the cluster image with a semi-major/minor axis 09 & 06, respectively (corresponding to 0.23 & 0.16 Mpc/h at z= 1.263). The backgrounds were estimated from a region of the detector at the same off-axis angle surrounding the cluster, after removing point sources. We obtain 79137 and 51930 net counts (in the 0.2-10.0 keV band) for pn and MOS(1+2), respectively. We regrouped the counts in order to have a S/N 3 in each bin after the background subtraction. We fitted the spectra with a thermal plasma emission model from Raymond & Smith(1977) using the XSPEC 11.0 with respective response matrices (Haberl 2001). For the MOS cameras, two filters were used alternately, thus we summed all the MOS spectra according to the used filter and fit two sets of spectra jointly. We fixed a characteristic column density of neutral hydrogen at a value of 5.6 1019 cm-2 and redshift at z = 1.263. For the case of a joint fit, each spectrum was fitted with its own normalization, but with common temperature (and metallicity, if applicable).


| Detector | kTa | Abundance | (dof) | |
|---|---|---|---|---|
| (keV) | () | |||
| pn | 4.8 (3.7-6.3) | 0.3(fixed) | 0.86(43) | |
| MOS1+2 | 4.9 (3.6-7.9) | 0.3(fixed) | 0.78(29) | |
| ALL | 4.9 (4.0-6.4) | 0.62 | 0.83(72) |
a The quoted temperature errors correspond to a single parameter error at 90% confidence
| Lobe | kT | Lbol | Abundance | (dof) |
|---|---|---|---|---|
| (keV) | (1044erg/s) | () | ||
| East | 3.7 (2.7-4.9) | 1.5 | 0.3(fixed) | 1.03(30) |
| West | 6.2 (4.4-10.4) | 1.9 | 0.3(fixed) | 0.82(43) |
| E+W | 4.9 (4.0-6.4) | 3.4 | 0.62 | 0.83(72) |
In Fig 3, and Table 1, the results of the best-fits are shown. Fig. 4 shows the two-parameter contours for the cluster metallicity and Tx. The best fit temperature based on a simultaneous fit of all (pn+MOS) spectra is 4.9 keV. All temperature uncertainties quoted are at the 90% confidence levels for a one-dimensional fit (=2.71). No prominent iron K complex is visible at 3 keV (redshifted 6.7 keV). At kT 5 keV, and the cluster redshift, only the K is strong enough to constrain the abundance with our spectrum. As a result, metallicity is poorly constrained even using the joint fit of all spectra, with an upper limit on the single iron abundance of 0.62 solar (with 68% confidence). Despite the fact that the cluster was observed at fairly large off-axis angle, the temperature errors are much smaller compared with those of typical measurements based on ASCA or Beppo-Sax observations of high-z (z 0.6) clusters (Fig. 5a), and the errors are comparable with typically “on-axis” Chandra observations of z 0.8 clusters (Fig. 5b), demonstrating the power of XMM for determining the X-ray temperature for high-z clusters. Moreover, the measured temperature and luminosity show that one can easily reach the intrinsically X-ray faint and cool cluster regime comparable with those of z 0.4 clusters observed by past satellites, which enables the investigation of the evolution of various cluster X-ray properties without additional evolutionary assumptions. Vignetting correction is estimated by using the average vignetting model between 0.5-7 keV, also averaged over the spectral extraction region. Using the best fit model parameters, we derived an unabsorbed (0.2-10) keV flux of = 3.0 10-14 erg cm -2 s-1, corresponding to a luminosity in the cluster rest frame of = 3.1 1044 herg s-1 and a bolometric luminosity of = 3.4 1044 herg s-1. Due to the still preliminary status of the current EPIC calibration, and some simplification about the vignetting correction, we estimate systematic flux errors on the order of 10%.
Temperature and luminosity are also estimated for each (eastern and western) lobe of RXJ1053.7+5735, using a circular (radius = 047) extracting region centered at each lobe. Our fitting for each lobe using all data (pn+MOS) shows that Tx is 3.7 keV and 6.2 keV, while Lbol is 1.5 1044 herg s-1 and 1.9 1044 herg s-1, for eastern and western lobes, respectively (Table 2). For any other regions, such as the bridge between the two lobes, the counts are less than 10% of total cluster counts and not sufficient for any reasonable Tx investigations.
5 Lx-Tx relation

Clusters exhibit a correlation between their X-ray luminosity (Lx) and temperature (Tx). This correlation is often used to compare gas and dark matter contents in clusters, as Lx is connected with the gas while Tx is related to the total gravitating mass of the cluster. The cluster Lx-Tx relationship therefore, can be used to examine the evolution of clusters and should be able to tell the range of redshifts where the cluster formation has taken place (e.g. Scharf & Mushotzky 1997).
At low redshift (z 0.1), the Lx-Tx relation is well measured (e.g. Mushotzky 1984; Edge & Stewart 1991; David et al. 1993) and expressed via power law: Lx Txα, with 2.6-2.9 (Markevitch (1998); Allen & Fabian 1998; Jones & Forman 1999; Arnaud & Evrard 1999).
At higher redshifts, however, no significant difference from the low redshift relations are reported, despite the fact that a relatively large evolution of the Lx-Tx relation is required in order to account, within the frame work of the critical universe, for the weak evolution observed in the cluster X-ray luminosity function (XLF) out to z 0.8 (Rosati et al. 1998). Mushotzky & Scharf (1997) (see also Henry 2000), by comparing the clusters at z 0.1 with those at z 0.1, found no convincing evidence for a significant evolution of Lx-Tx relationship out to z 0.4-0.5, which is consistent with recent result of Wu et al. (1999) where they used the largest sample of clusters to date from the literature, and estimated 2.7. For even higher redshifts, Donahue et al. (1999), using a complete sample of (five) high redshift (z 0.5) EMSS clusters, have detected no significant evolution up to z 0.8 (see also Della Ceca et al. 2000; Borgani et al. 2001).
In Fig. 6, we compare our newly measured X-ray properties for RXJ1053.7+5735 with other clusters at various redshifts from the literature (Markevitch (1998); Mushotzky & Scharf 1997; Donahue et al. 1999; Della Ceca et al. 2000; Borgani et al. 2001). The square denotes the new Lbol and Tx for RXJ1053.7+5735. The error on the temperature represents the one dimensional 90% confidence range. The error bar on the RXJ1053.7+5735 luminosity is 10%. The eastern and western lobes of RXJ1053.7+5735 (denoted as “East” and “West”) are also separately shown. The solid line is the Lbol-Tx relation of Lbol = 10 from Wu et al. (1999) together with 2 lines (dotted lines). The dashed line represents the evolving Lbol-Tx relation in the form of Lbol (1+z)2 at z = 1.263, which would be required to make the observed weak-evolving XLF to be consistent with a = 1 universe (Borgani et al. (1999)). The circles, triangle, & stars denote low redshift (z 0.1), intermediate redshift (0.3 z 0.5), and high redshift (z 0.5) clusters, respectively. Total cluster luminosity may be somewhat underestimated because of the fundamental difficulty in measuring the luminosity of an extended source using a finite-sized extraction region. However, the treatments (if any) against the missing flux outside the extraction region often require difficult extrapolation and are not uniform for the low-z cluster samples, or other high-z samples in the literature. We therefore chose not to include the correction associated with the missing flux. Nevertheless, we crudely estimate the effect in our cluster using a profile from Neumann & Arnaud (1999). We find that the uncertainty in Lx is on the order of 10%, which is similar with the size of error bar shown in Fig. 6. The new cluster temperature and Lbol we have measured for RXJ1053.7+5735 is in agreement with other high-z Lx-Tx analyses (e.g. Donahue et al 1999; Della Ceca et al. 2000; Borgani et al. 2001).
6 Discussion
The dynamical state of high-z clusters provides us with valuable and direct information on the formation and evolution of clusters. In hierarchical models, structures form from the bottom-up and thus, for many clusters, “formation” means an ongoing sequence of mergers and interactions with other clusters and groups. X-ray signatures of cluster interaction include surface brightness anomalies (e.g. non-symmetric, non-isotropic X-ray isophotes; substructures; elongate X-ray core; an X-ray peak offset from the peak of the galaxy distribution), and non-isothermal & asymmetric temperature distributions. Evidence for such cluster substructures and merger events in the local universe have been obtained with ROSAT and ASCA satellite (see Buote 2001 for a review). For higher redshifts (z 0.5), the majority of clusters show clearly distorted X-ray morphology (e.g. Neumann & Böhringer 1997; Gioia et al. 1999; Della Ceca et al. 2000; Neumann & Arnaud 2000; Stanford et al. 2001; Jeltema et al. 2001), suggesting that they are in an unrelaxed state.
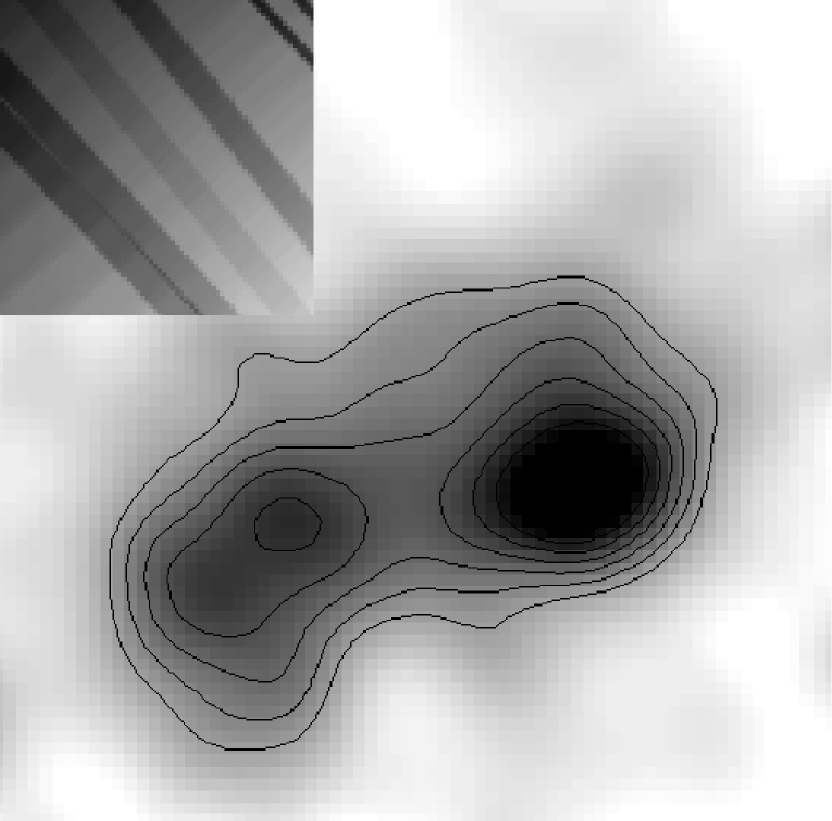
The fact that the X-ray morphology of RXJ1053.7+5735 is double-lobed suggests that we may be seeing a merger event at z 1.3, although our optical/NIR data are currently insufficient for a definitive statement about the dynamical state of this cluster. As for the Tx distribution, Fig.7 shows the contour plot of an image in the 1-2 keV band overlaid on the gray-scale image in the 0.5-1 keV band. The figure shows some hint of a difference in the spatial distribution of the 1-2 keV image contour with respect to the 0.5-1 keV map, which may be interpreted as a Tx variation. The western lobe also shows a hint of higher Tx, however, it is statistically inconclusive (Table 2). Future XMM (or Chandra) data of this cluster are needed, as well as more optical/NIR data, to improve our knowledge of the dynamical state of this cluster.
The new cluster temperature and Lx we have measured for RXJ1053.7+5735 is consistent with a weak/no evolution of the Lx-Tx relation out to z 1.3, whereas a strong evolution of the Lx-Tx relation is required to make the observed weak-evolving XLF to be consistent with a = 1 universe. Thus, our results could be interpreted as a support for a low universe, although more data-points of z 1 clusters are needed for a more definitive statement. The caution has to be also exercised in interpreting the result, because of the uncertainty associated with the dynamical state of the cluster. In fact, our results may emphasize the fundamental difficulty in constraining the cosmology from the evolution of the XLF and the Lx-Tx relation, since the baseline of the comparison, the local Lx-Tx relation and the theoretical M-T relationships, are essentially valid for dynamically relaxed clusters (see also Ricker & Sarazin 2001). If the majority of high-z clusters are in the unrelaxed state, the impact of dynamically unrelaxed cluster states has to be carefully assessed. In particular, during mergers, clusters are expected to follow a complex track in the Lx-Tx plane as shown in the numerical simulations (Ricker & Sarazin 2001), and therefore, the relatively low luminosity of RXJ1053.7+5735 in view of its temperature may be interpreted as further evidence for the unrelaxed state of the cluster.
Acknowledgements.
We thank Pat Henry for a careful reading of the paper and useful comments. We also thank S. Majerowicz for his help in analyzing the MOS spectra. We acknowledge referee’s comments which improved the manuscript. Part of the work was supported by the German Deutsches Zentrum für Luft- und Raumfahrt DLR project numbers 50 OX 9801 and 50 OR 9908.References
- Allen & Fabian (1998) Allen S.W., & Fabian A.C. 1998, MNRAS, 297, L57
- Arnaud & Evrard (1999) Arnaud M., & Evrard A.E. 1999, MNRAS, 305, 631
- Borgani et al. (1999) Borgani S., Rosati P., Tozzi P., Norman C., 1999, ApJ 517, 40
- Borgani et al. (2001) Borgani S., Rosati P., Tozzi P., Stanford S.A. et al. 2001, (astro-ph/0106428)
- Buote (2001) Buote D.A. 2001, To appear in Merging Processes in Clusters of Galaxies, ed. L. Feretti, I.M. Gioia & G. Giovannini (Dordrecht: Kluwer)
- Burke et al. (1997) Burke D.J., Collins C.A., Sharples R.M., Romer A.K., Holden B.P., Nichol R.C., 1997, ApJ 488, L83
- Cagnoni et al. (2001) Cagnoni I., Elvis M., Kim D.-W., Mazzotta P. et al. 2001, ApJ in press (astro-ph/0106066)
- David et al. (1993) David L.P., Slyz A., Jones C., Forman W. Vrtilek S.D. & Arnaud K.A. 1993, ApJ 412, 479
- Della Ceca et al. (2000) Della Ceca R., Scaramella R., Gioia I.M., Rosati P., Fiore F., & Squires G. 2000 A&A 353, 498
- Donahue et al. (1999) Donahue M., Voit G.M., Scharf C.A.,Gioia I.M., Mullis C.R., Hughes J.P., & Stocke J.T. 1999, ApJ 527, 525
- Edge & Stewart (1991) Edge A.C., & Stewart G.C. 1991, MNRAS, 252, 428
- Edge, Stewart, & Fabian (1992) Edge A.C., Stewart G.C., & Fabian A.C., 1992, MNRAS, 255, 431
- Eke et al. (1996) Eke V.R., Cole S., Frenk C.S., 1996, MNRAS 282, 263
- Gioia et al. (1999) Gioia, I.M., Henry, J.P., Mullis, C.R., Ebeling, H., & Wolter, A., 1999 ApJ, 117, 2608
- Haberl (2001) Haberl F., 2001 private communication
- (16) Hasinger G., Burg R., Giacconi R., et al., 1998a, A&A 329, 482
- (17) Hasinger G., Giacconi R., Gunn J.E., et al., 1998b, A&A 340, L27
- Hasinger et al. (2001) Hasinger G., Altieri B., Arnaud M. et al., 2001, A&A 365, L45
- Henry (2000) Henry J.P.,2000, ApJ 534, 565
- (20) Jeltema T.E., Canizares C.R., Bautz M.W., Malm M.R., Donahue M., Garmire G.P. 2001, ApJ in press
- Jones & Forman (1999) Jones C., Forman W., 1999, ApJ 511, 65
- Markevitch (1998) Markevitch, M. 1998, ApJ 504, 27
- Mushotzky (1984) Mushotzky R., 1984, Phys. Scr. T7, 157
- Mushotzky & Scharf (1997) Mushotzky R., Scharf C., 1997, ApJ 482, L13
- Neumann & Bohringer (1997) Neumann, D.M., Böhringer, H., 1997, MNRAS 289, 123
- Neumann & Arnaud (1999) Neumann D.M., Arnaud M., 1999, A&A 348, 711
- Neumann & Arnaud (2000) Neumann D.M., Arnaud M., 2000, ApJ 542, 35
- Peebles et al. (1989) Peebles P.J.E., Daly R., Juskeiewiez R., 1989, ApJ 347, 563
- Press & Schechter (1974) Press W., Schechter P., 1974, ApJ 187, 425
- Raymond & Smith (1977) Raymond J.C., Smith B.W., 1977, ApJS 35, 419
- Ricker & Sarazin (2001) Ricker P.M., Sarazin C.L., 2001 ApJ in press
- Rosati et al. (1995) Rosati P., Della Ceca R., Burg R., Norman C., Giacconi R., 1995, ApJ 445, L11
- Rosati et al. (1998) Rosati P., Della Ceca R., Norman C., Giacconi R., 1998, ApJ 492, L21
- Rosati et al. (1999) Rosati P., Stanford S.A., Eisenhardt P.R., Elston R. et al., 1999, AJ 118, 76
- Scharf & Mushotzky (1997) Scharf C.A., Mushotzky R. 1997, ApJ 485, L65
- Scharf et al. (1998) Scharf C.A., Jones L.R., Ebeling H., et al., 1997, ApJ 477, 79
- Stanford et al. (2001) Stanford S.A, Holden B., Rosati P., et al. 2001, ApJ, in press, astro-ph/0012250
- Thompson et al. (2001) Thompson D., Pozzetti L., Hasinger G, et al., 2001, A&A (submitted)
- Vikhlinin et al. (1998) Vikhlinin A., McNamara B.R., Forman W., et al., 1998, ApJ 502, 598
- Wu et al. (1999) Wu X-P., Xue Y-J., Fang L-Z., 1999, ApJ 524, 22