22institutetext: IFA, Århus, Denmark
Detecting filaments at z3
Abstract
We present the detection of a filament of Ly emitting galaxies in front of the quasar Q1205-30 at z=3.04 based on deep narrow band imaging and follow-up spectroscopy obtained at the ESO NTT and VLT. We argue that Ly selection of high redshift galaxies with relatively modest amounts of observing time allows the detection and redshift measurement of galaxies with sufficiently high space densities that we can start to map out the large scale structure at z2-3 directly. Even more interesting is it that a 3D map of the filaments will provide a new cosmological test for the value of the cosmological constant, .
1 Introduction
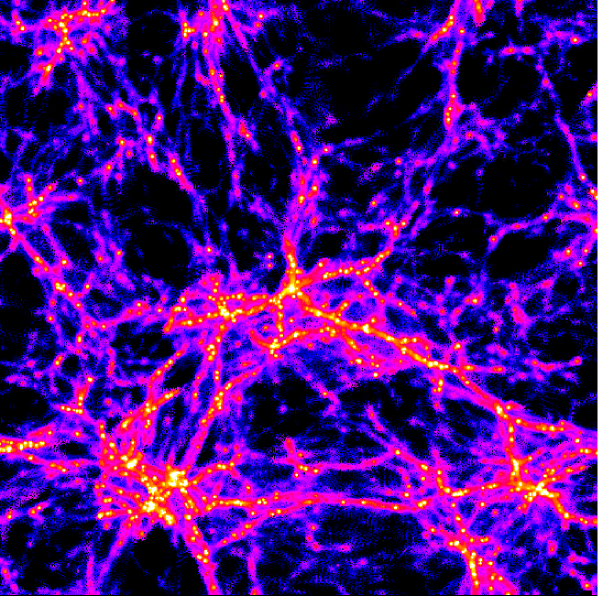
For the past few decades computer simulations have been ahead of the observations when it comes to describing the first structures to form at high redshifts. The present consensus of the model builders is that the gas arranges itself in long string–like structures commonly referred to as filaments (see Fig. 1). Density variations along the filaments will lead to formation of lumps of cold, self–shielding HI regions and those regions are identified, in the simulations, as regions of starformation. Because of the high column density of neutral Hydrogen a sightline through such a cloud intersects, they are also identified as strong absorbers known as Damped Ly Absorbers (DLAs). By poking random sightlines through a virtual universe one may simulate observations, and a given model universe will hence predict a specific correlation between DLA systems and the galaxies hosting the DLAs (e.g. Katz et al. 1996). Comparison to real observations of DLA galaxies (Møller & Warren 1998) has shown that there is very good agreement between observations and simulations. This agreement is encouraging, but it would be of great interest if one could observationally map out the actual filaments. Until now this his been done only at low redshifts (e.g. De Lapparent et al. 1991; Bharadwaj et al. 2000), but never at z0.1. Knowing the distribution of scalesizes of filaments at different redshifts will help constrain the allowable parameter space of the simulations.
Unfortunately such a map cannot be constructed directly via absorption studies, because there is currently not a sufficiently tight mesh of background z3 quasars available (e.g. Pichon et al. 2001). The best way to proceed is hence to attempt to find enough centres of starformation to be able to map out filaments by their own light. In order to identify objects to map out filaments one might at first guess that a search for Lyman Break Galaxies (LBGs, Steidel & Hamilton 1992) would be the best procedure. Unfortunately only the very brightest galaxies can be found and have their redshifts measured precisely enough with this technique, and such sparse sampling of the filamentary structure does not allow the structures to be seen. However, it has been shown that both DLA galaxies and galaxies selected for their Ly emission, are sampling the high redshift galaxy population much further down the Luminosity function than do the LBGs, and one will therefore expect a better sampling of the high redshift structure if one uses DLA galaxies and Ly galaxies (Fynbo, Møller & Warren 1999; Haehnelt et al. 2000). This has recently been independently confirmed, as deep narrow band Ly imaging in a known overdensity of LBGs revealed about a factor of 10 more candidate Ly galaxies than LBGs (Steidel et al. 2000).
2 Observations
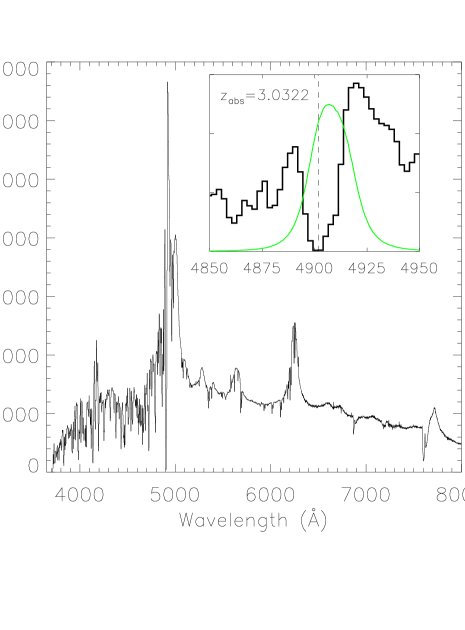
In February through March 1998 we obtained deep narrow band imaging in a 21Å wide filter tuned to Ly at z=3.04. The filter was tuned to the wavelength of a strong Ly absorption line in the spectrum of the QSO (Fig. 2). The data were collected as service observing program at the 3.5-m ESO New Technology Telescope on La Silla, Chile. In total almost 18 hours of narrow band imaging was secured reaching a 5 flux limit of 1.110-17 erg s-1 cm-2 (Fynbo, Thomsen & Møller 2000). We detected six good (5) and two marginal (4) candidate Ly emitters in the field of the QSO as well as extended Ly emission close to the QSO line of sight. In March 2000 we obtained Multi-Object follow-up spectroscopy at the ESO Very Large Telescope using FORS1 on the UT1 unit telescope. We also obtained deep imaging in the B and I bands (reaching B(AB)=26.7 and I(AB)=25.9 at 5).
3 Results
The VLT spectroscopy confirmed (by detecting the Ly line and at the same time excluding the possibility of low redshift interlopers) all six good candidates and one of the two marginal candidates as Ly emitters at z=3.04 (Fynbo, Møller & Thomsen 2001). The spectral regions around Ly for all confirmed candidates are shown in Fig. 3. The spectroscopy of the extended emission close to the QSO line-of-sigt will be presented in a separate paper (Weidinger et al. in preparation).
In Table LABEL:redtab we present the redshifts and celestial positions for all confirmed Ly emitters and for the absorber (from Møller & Fynbo 2001).
| Object | RA (arcsec) | decl. (arcsec) | redshift |
|---|---|---|---|
| S7 | -143.30.6 | 41.90.2 | 3.0402 |
| S8 | -141.50.6 | 59.70.2 | 3.0398 |
| S9 | -124.60.5 | 63.40.2 | 3.0350 |
| S10 | -119.90.5 | 59.80.2 | 3.0353 |
| S11 | -77.80.3 | 0.90.1 | 3.0312 |
| S12 | -43.90.2 | 54.40.2 | 3.0333 |
| S13 | 68.30.3 | -52.10.2 | 3.0228 |
| abs | 0.0 | 0.0 | 3.0322 |

3.1 Filamentary structure
In Fig. 4 we show the objects plotted in the box defined by the Field of View of the Camera and the redshift depth of the filter for Ly at z=3. As seen the 7 Ly emitters (marked with filled symbols) and the absorber (the open symbol) all align in this diagram. If we assume that the redshifts are all solely due to Hubble flow then this implies a real alignment in 3D space e.g. a filamentary spatial distribution of the objects. However, the measured redshift may not be due to Hubble flow alone for mainly two effects : i) outflows, and ii) peculiar velocities. We now briefly discuss the importance of each of these effects. Outflows: In the nearby starburst galaxy NGC1705 the outflow velocity is estimated to be around 80 km s-1 (Heckman et al. 2001 and references therein). Outflows of this strength will cause a shift in the redshift measurement which is of the same order as the combined uncertainty from the wavelength calibration and line centroid measurement (corresponding to 90 km s-1 at z=3). Outflows will either produce a systematic blueshift of the emission line redshift if the galaxies are opaque (so that we only see the gas moving towards us) or a broadening with no velocity shift of the lines (if the galaxies are transparent and we also see the gas moving away from us). The fact that the absorber, for which the redshift is detemined from the Ly absorption line, also follows the alignment is an argument against a significant blueshift due to outflows. Peculiar velocities: In the local universe (v4000 km s-1) the (vpeculiar) of peculiar velocities is of the order 200 km s-1 (e.g. Branchini et al. 2001). We do not expect this number to be larger at z=3. Furthermore, any peculiar velocities will tend to smear out any underlying filamentary structure, so the fact that we see alignment is an argument against large peculiar velocities. We therefore conclude that the most likely interpretation of Fig. 4 is that we see a redshift z=3 filament.
3.2 Properties of the filament
We can only determine a lower limit to the length of the filament as it seems to extend beyond the volume mapped by our instrumental setup (CCD and filter). Assuming a Hubble constant of 65 km s-1 Mpc-1, , and we find a coming length (defined as the distance between the two outhermost objects) of 4800 proper kpc. The radius of the minimum cylinder containing all objects is 400 proper kpc. Due to the effect of peculiar and outflow velocities this radius should be considered an upper limit.
The derived properties of filaments are strongly dependend on the assumed cosmology. In particular, since filaments are anchored in the Hubble flow, the observed angular distribution of a sample of filaments will be a function of the assumed cosmology. Therefore, it is in principle possible to use a sample of filaments to obtain an independend constrain on the value of the cosmological constant at z3 (Weidinger et al. 2001).

4 Summary and outlook
In order to start mapping out the large scale filamentary structure suggested by numerical simulations directly at high redshift we need cosmic sources that are very numerous rather than rare, very bright light houses such as QSOs or Gamma-Ray Bursters. We have here demonstrated that by reaching flux limits below 110-17 erg s-1 cm-2 the density of Ly emitting galaxies is sufficiently high at z=3 to allow a direct mapping of filamentary structure.
The next logical step is to try to map out larger regions of the z2–3 universe with Ly emitters. Therefore we (Møller, Fynbo, Thomsen, Egholm, Weidinger, Haehnelt, Theuns) have initiated a large area survey for Ly emitters at z=2 with the 2.56-m Nordic Optical Telescope on La Palma. Furthermore, in a pilot project conducted at the ESO VLT we (here Fynbo, Ledoux, Burud, Leibundgut, Møller and Thomsen) have obtained narrow band observations of two fields around QSO absorbers at z3. In the field of the z=2.85 absorber towards Q2138-4427, for which our imaging observations are complete, we reach a detection limit of about 710-18 erg s-1 cm-2 and detect 34 candidate Ly emitters in a 45 arcmin2 field over a redshift range of z=0.05. This shows that the density of z=3.04 Ly emitters in the Q1205-30 field is not unusually high. Follow-up spectroscopic observations of the Q2138-4427 field has not yet been obtained. In the future we hope to map out a large volume with several hundred z=3 Ly emitters with the VLT.
Acknowledgments
This paper is based on observations collected at the European Southern Observatory, La Silla and Paranal, Chile (ESO project No. 60.B-0843 and 64.O-0187).
References
- (1) S. Bharadwaj, V. Sahni, B.S. Sathyaprakash, S.F.
- (2) E. Branchini, W. Freudling. L.N. Da Costa, et al.: MNRAS 326, 1191 (2001)
- (3) J.U. Fynbo, P. Møller, S.J. Warren: MNRAS 305, 849 (1999)
- (4) J.U. Fynbo, B. Thomsen, P. Møller: A&A 353, 457
- (5) J.U. Fynbo, P. Møller, B. Thomsen: A&A 374, 443
- (6) M.G. Haehnelt, M. Steinmetz, M. Rauch: ApJ 534, 594
- (7) T.M. Heckman, K.R. Sembach, G.R. Meurer, et al.: ApJ 554, 1021 (2001)
- (8) N. Katz, D.H. Weinberg, L. Hernquist, J. Miralda-Escudé: ApJL 457, L57 (1996)
- (9) V. De Lapparent, M.J. Geller, J.P. Huchra: ApJ 369, 273 (1991) Shandarin, C. Yess: ApJ 528, 21 (2000)
- (10) P. Møller, S.J. Warren: MNRAS 299, 661 (1998)
- (11) P. Møller, J.U. Fynbo: A&AL 372, L57 (2001)
- (12) C. Pichon, J.L. Vergely, E. Rollinde, S. Colombi, P. Petitjean: MNRAS 326, 597 (2001)
- (13) C.C. Steidel, D. Hamilton: AJ 104, 941
- (14) C.C. Steidel, K.L. Adelberger, A.E. Shapley, et al.: ApJ 532, 170
- (15) M. Weidinger, P. Møller, J.U. Fynbo, B. Thomsen, M.P. Egholm: submitted to A&A (2001)