X-ray properties of the microquasar GRS 1915105 during a variability class transition
Abstract
We present a detailed X-ray study of the microquasar GRS 1915105 during a variability class transition observed in 2000 June with the Pointed Proportional Counters (PPCs) of the Indian X-ray Astronomy Experiment (IXAE). We supplement this observation with data from the RXTE archives. The source made a transition from a steady low-hard state to a regular oscillatory behaviour in the light curve known as bursts or class (Belloni et al. 2000) between 2000 May 11 and 17 and reverted back to the low-hard state on 2000 June 27. A gradual change in the burst recurrence time from about 75 s to about 40 s was observed which then increased to about 120 s during the 40 days of class . The regular bursts disappeared from the X-ray light curves and the class transition was observed to occur within 1.5 hours on 2000 June 27 with the PPCs. A correlation is found between the observed QPO frequency at 58 Hz in the quiescent phase and the average X-ray intensity of the source during the class . We notice a strong similarity between the properties of the source during the class and those during the oscillatory phase of the observations of class which contains a long stretch ( 1000 s) of steady low-hard state in the light curve along with the regular periodic bursts. From the timing and spectral analysis, it is found that the observed properties of the source over tens of days during the class are identical to those over a time scale of a few hundreds of seconds in the class . Examining the light curves from the beginning of the RXTE/PCA and RXTE/ASM observations, it is found that the change of state from radio-quiet low-hard state to high state occurs through the X-ray classes and which appear together during the state transition. It is further inferred that the source switches from low-hard state to the class through the intermediate class .
keywords:
accretion, accretion discs — binaries: close — black hole physics — stars: individual: GRS 1915105 — X-rays: stars1 Introduction
The Galactic X-ray source GRS 1915105, discovered in 1992, was identified with a superluminal radio source at a distance of 12.5 1.5 kpc (Mirabel & Rodriguez 1994). Its radio characteristics like jets and superluminal motion are similar to those found in quasars and hence this source is called a microquasar. The source is very bright in X-rays and shows strong variability over a wide range of time scales. The X-ray emission is characterized by quasi-periodic oscillations (QPOs) at centroid frequencies in the range of 0.001 67 Hz (Morgan, Remillard, & Greiner 1997). Based on extensive X-ray studies, Muno, Morgan, & Remillard (1999) classified the behavior of the source into two distinct states, a spectrally hard-state with the presence of narrow QPOs, dominated by a power-law component and a soft-state with the absence of QPOs, dominated by thermal emission.
Belloni et al. (2000) have made an extensive study of the X-ray emission of the source and classified all the publicly available RXTE/PCA observations from 1996 January to 1997 December into 12 different classes on the basis of structure of the X-ray light curve and the nature of the color-color diagram. They found that the source variability is restricted into three basic states, a low-hard state with invisible inner accretion disk (C), a high-soft state with visible inner accretion disk (B) and a low-soft state with spectrum similar to the high-soft state but with much less intensity (A). However, in GRS 1915105 the observed fast and slow transitions from one state to other are not clearly understood.
The different variability classes of Belloni et al. (2000) range from steady emission for long durations like class (state A), class (state C) to large amplitude variations (from state C to state B with a hint of state A) in classes , , . In the high state (state B), the source sometimes shows short periodic flickering with different amplitudes (classes , and ). During the classes , and the amplitude variation is accompanied by soft X-ray dips (state A) with duration of a few tens of seconds to hundreds of seconds. It has been suggested that these soft dips in X-ray light curves are also associated with radio flares (Naik et al. 2001). The class is further divided into four sub-classes , , and , depending on the count rate and hardness ratio in different energy ranges. During the class , the X-ray light curve consists of regular and characteristic pattern known as bursts (Taam, Chen, & Swank 1997; Yadav et al. 1999) which is reflected as a loop-like behaviour (Vilhu & Nevalainen 1998) in the color-color diagram. Similar type of oscillations are observed in the X-ray light curve for a duration of a few hundreds of seconds followed by a long quiet period of about 1000 s as seen in the class /. The observations with these characteristics are as classified into class . Among the twelve different classes of X-ray observations, it is seen that the source is radio-loud in X-ray classes , , and (Naik & Rao 2000).
We present the results of the observation of GRS 1915105 with the PPCs onboard the IXAE when the source made a class transition from a regular oscillatory behaviour of class to a steady state of class /. We have also analyzed the available RXTE archival data contemporaneous to the PPC observation. In the following sections we present results of these studies.
2 Instrument and Observations
The X-ray observations of the microquasar GRS 1915105 were made using the PPCs of the IXAE on board the Indian satellite IRS-P3. The IXAE includes three co-aligned, identical, multi-wire, multi-layer proportional counters with an effective collecting area of 1200 cm2 and a field of view of 2.3∘ 2.3∘. All the PPCs operate in the energy range of 218 keV with an average detection efficiency of about 60% in 37 keV energy range. For a detailed description of the PPCs refer to Agrawal (1998) and Rao et al. (1998). Background observations were made before and after the source observation by pointing the PPCs to a source-free region in the sky, close to the target source. The source GRS 1915105 was observed from 2000 June 18 to 22 with 1 s time integration mode and from June 23 to 27 in 0.1 s integration mode for a total useful period of 29460 s. The log of the PPC observations is given in Table 1.
Regular pointed observations of the microquasar GRS 1915105 during 1996 2001 period with the Rossi X-ray Timing Explorer (RXTE) satellite provide a good coverage for a detailed study of the timing and spectral properties of the source and establish the associated radio properties with X-ray emission during different spectral states. There have been over 550 observations of GRS 1915105 with the PCA and HEXTE of the RXTE. The list of observations used in the present work is given in Table 2.

3 Analysis and Results
3.1 Data from IXAE Observations
The X-ray data in the energy band 218 keV and 26 keV were corrected for pointing offset using the aspect information. The background count rates obtained by pointing the detectors to a source-free region, were subtracted from the source count rate. Dead time correction has been neglected as it is less than 1% even at a count rate of about 500 counts s-1 per PPC. From calibration of the PPCs using Crab Nebula, it is found that the spectral data from PPC3 is more reliable. Hence the hardness ratio (ratio of the count rates in 618 keV and 26 keV bands) has been obtained using data only from PPC3.

We have generated the X-ray light curves of the source in 218 keV range for 500 s using the data from PPC1 and PPC3 for each orbit of observation. The light curves for a few orbits are shown in Figure 1. The light curves show that low intensity quiescent phase lasting for a few tens of seconds, is followed by the bursts, which have exponential increase in X-ray flux with rise time of 810 s, high peak flux level for 10 s and a sharp linear decay in 23 s. The average burst recurrence time (the time taken by a cycle of quiescent interval followed by a burst) for all the orbits of the PPC observations and the burst strength (the ratio between the peak count rate of the burst and the quiescent count rate at 218 keV for PPC1 and PPC3) are given in Table 1. An increase in the burst recurrence time by a factor of about 2 from the beginning to the end of the observations is clearly detectable from the table. The X-ray light curves in 218 keV and 26 keV bands along with the hardness ratio obtained from PPC3 data for four different PPC observations are shown in Figure 2. It can be seen that the spectrum becomes hard as the burst progresses and it is hardest at the end of the decay of the burst. Presence of secondary (and tertiary) peaks during the decay phase of the bursts in the X-ray light curves is also discernible. From the light curves and hardness ratio for the third orbit of PPC observations on June 27 shown in the fourth panel of Figure 2, it can be seen that the regular bursts disappeared in both the energy bands and the transition from class to class / occurred within about 1.5 hours, the orbital period of IRS-P3 satellite.
| Observation | Start time | End Time | BRT2 | Burst | |
|---|---|---|---|---|---|
| Date1 | orbit | (UT) | (UT) | (s) | strength3 |
| 18 | 1 | 13:00 | 13:18 | 53 | 2.450.15 |
| 4 | 18:04 | 18:23 | 48 | 2.870.16 | |
| 19 | 1 | 12:44 | 12:54 | 46 | 2.950.16 |
| 2 | 14:20 | 14:38 | 46 | 2.790.14 | |
| 3 | 16:02 | 16:20 | 50 | 3.140.17 | |
| 4 | 17:43 | 18:02 | 51 | 2.870.21 | |
| 5 | 19:35 | 19:43 | 47 | 2.930.15 | |
| 20 | 1 | 12:16 | 12:36 | 47 | 3.240.17 |
| 2 | 14:00 | 14:16 | 49 | 2.810.16 | |
| 3 | 15:41 | 16:00 | 48 | 3.420.20 | |
| 4 | 17:23 | 17:42 | 46 | 3.090.19 | |
| 5 | 19:12 | 19:22 | 49 | 3.400.17 | |
| 21 | 2 | 13:42 | 13:57 | 43 | 3.190.18 |
| 3 | 15:21 | 15:38 | 48 | 3.550.19 | |
| 4 | 17:03 | 17:21 | 53 | 3.570.22 | |
| 5 | 18:49 | 19:02 | 52 | 3.330.18 | |
| 22 | 4 | 16:41 | 16:59 | 54 | 3.300.18 |
| 5 | 18:27 | 18:40 | 57 | 2.550.16 | |
| 23 | 2 | 16:21 | 16:37 | 49 | 2.800.18 |
| 3 | 18:00 | 18:19 | 49 | 2.940.28 | |
| 24 | 1 | 14:25 | 14:34 | 77 | 3.600.19 |
| 2 | 15:59 | 16:16 | 75 | 2.890.14 | |
| 3 | 17:39 | 17:58 | 93 | 2.610.13 | |
| 25 | 1 | 14:07 | 14:13 | 85 | 3.020.13 |
| 2 | 15:37 | 15:54 | 107 | 2.750.12 | |
| 3 | 17:17 | 17:36 | 92 | 2.490.11 | |
| 26 | 1 | 15:17 | 15:34 | 80 | 2.670.12 |
| 2 | 16:58 | 17:16 | 98 | 2.510.12 | |
| 27 | 1 | 15:01 | 15:12 | 54 | 1.770.08 |
| 2 | 16:36 | 16:54 | 126 | 2.340.12 | |
| 3 | 18:18 | 18:35 | |||
1Date 2000 June,
2BRT Burst Recurrence Time (averaged over the orbit)
3Burst strength Ratio of Peak count rate to quiescent count rate
The burst strength has been calculated from a typical burst from each PPC observation. The peak count rate was determined as the average count rate over a time span of 4 seconds during the peak of the bursts and the quiescent count rate as the average count rate over 20 seconds just after the decay of a burst. The variation of the burst recurrence time with the burst strength is shown in Figure 3. An anti correlation is found between the count rate ratio (burst strength) and the average burst recurrence time with a correlation coefficient of -0.54 (30 degrees of freedom). This indicates that the bursts were stronger during the early phase of observations when the burst recurrence time was small and the burst strength decreased with the increase in burst recurrence time.

3.2 Data from RXTE Observations
To corroborate the IXAE results we have also analyzed 31 RXTE/PCA observations of GRS 1915105 made between 2000 May 4 and 2000 July 5 which are listed in Table 2. Other details like the average count rate during quiescent phase and burst phase, burst recurrence time, the observed low frequency QPOs ( 28 Hz), hardness ratios and rms variability are also given in the table. The hardness ratio HR1 is described as the ratio of the count rates in the energy range 513 keV to that in 25 keV whereas the ratio of the count rates in the energy bands of 1360 keV and 213 keV is described as HR2. The source was in a low-hard state (/) on and before 2000 May 11 and changed to the oscillatory nature of class and remained for 40 days (from 2000 May 17 to 2000 June 27, as observed with RXTE/PCA). It returned back to the low-hard state which was detected on 2000 July 5. The burst recurrence time for each of the RXTE observation of class was calculated using the PCA X-ray light curves. A plot of the average burst recurrence time versus the observation date (MJD) for the combined IXAE and RXTE/PCA observations is shown in Figure 4. It can be seen that the burst recurrence time, obtained from the RXTE was about 75 s in the beginning and it gradually decreased to 40 s. Towards the end of the observations, regular monitoring by PPCs revealed a gradual increase in the burst recurrence time to 120 s which is followed by the disappearance of the bursts from the light curve. This indicates the switching of the source from oscillatory behaviour of class to a radio-quiet steady emission of class /.
| RXTE Observation 1 | Average Countrate (2 PCUs) | QPO frequency | BRT4 | Quiescent phase | |||||
| ID | Date | QP2 | BP3 | Total | (in Hz) | (in s) | HR15 | HR26 | RMS |
| class | |||||||||
| 50703-01-10-00 | 05/17/2000 | 3317 | 10684 | 3822 | 6.280.062 | 73.68 | 0.68 | 0.055 | 0.068 |
| 50703-01-10-01 | 05/17/2000 | 3182 | 9651 | 3703 | 6.670.079 | 66.67 | 0.66 | 0.053 | 0.062 |
| 50703-01-10-02 | 05/17/2000 | 3088 | 9207 | 3560 | 6.480.076 | 66.67 | 0.66 | 0.059 | 0.064 |
| 50703-01-11-00 | 05/25/2000 | 2894 | 9514 | 3466 | 6.620.138 | 55.56 | 0.58 | 0.056 | 0.068 |
| 50703-01-11-01 | 05/25/2000 | 3054 | 9264 | 3556 | 6.440.077 | 56.00 | 0.57 | 0.059 | 0.065 |
| 50703-01-11-03 | 05/25/2000 | 2724 | 8456 | 3344 | 6.150.087 | 50.00 | 0.57 | 0.058 | 0.064 |
| 50703-01-12-00 | 05/31/2000 | 2642 | 9443 | 3320 | 6.410.067 | 46.67 | 0.51 | 0.059 | 0.056 |
| 50703-01-12-01 | 05/31/2000 | 2827 | 10104 | 3365 | 6.420.053 | 50.00 | 0.52 | 0.059 | 0.067 |
| 50703-01-12-02 | 05/31/2000 | 2672 | 10554 | 3340 | 6.320.064 | 47.37 | 0.52 | 0.056 | 0.062 |
| 50703-01-12-03 | 05/31/2000 | 2540 | 9626 | 3183 | 6.480.146 | 46.15 | 0.52 | 0.056 | 0.063 |
| 50703-01-13-00 | 06/07/2000 | 2859 | 9415 | 3517 | 6.740.0515 | 42.50 | 0.48 | 0.053 | 0.047 |
| 50703-01-13-01 | 06/08/2000 | 2908 | 9838 | 4703 | 6.600.0435 | 46.67 | 0.50 | 0.054 | 0.057 |
| 50703-01-13-02 | 06/08/2000 | 2652 | 8601 | 3467 | 6.560.0585 | 47.06 | 0.49 | 0.051 | 0.063 |
| 50703-01-13-03 | 06/08/2000 | 2668 | 9668 | 3495 | 6.680.085 | 46.15 | 0.49 | 0.049 | 0.066 |
| 50703-01-14-00 | 06/14/2000 | 3875 | 9182 | 5035 | 6.740.0295 | 57.14 | 0.61 | 0.051 | 0.066 |
| 50703-01-14-01 | 06/15/2000 | 3617 | 9523 | 4237 | 6.830.0435 | 54.55 | 0.59 | 0.051 | 0.061 |
| 50703-01-14-02 | 06/15/2000 | 3521 | 9004 | 4140 | 6.800.0335 | 53.85 | 0.59 | 0.051 | 0.052 |
| 50703-01-15-00 | 06/19/2000 | 2777 | 8794 | 5206 | 6.810.045 | 46.51 | 0.48 | 0.048 | 0.056 |
| 50703-01-15-01 | 06/20/2000 | 3066 | 10068 | 5301 | 6.700.0535 | 49.18 | 0.48 | 0.048 | 0.049 |
| 50703-01-15-02 | 06/20/2000 | 2967 | 10463 | 5399 | 6.910.06 | 46.51 | 0.47 | 0.046 | 0.052 |
| 50703-01-15-03 | 06/20/2000 | 2968 | 9910 | 5235 | 6.840.043 | 48.72 | 0.47 | 0.049 | 0.054 |
| 50703-01-16-01 | 06/26/2000 | 5226 | 11574 | 6217 | 7.220.0305 | 80.65 | 0.57 | 0.046 | 0.065 |
| 50703-01-16-00 | 06/26/2000 | 5483 | 10697 | 6332 | 7.340.0395 | 70.59 | 0.58 | 0.043 | 0.062 |
| 50703-01-16-02 | 06/27/2000 | 4941 | 10639 | 5455 | 7.270.082 | 72.73 | 0.57 | 0.047 | 0.069 |
| 50703-01-16-03 | 06/27/2000 | 5274 | 9926 | 5717 | 7.230.05 | 73.33 | 0.57 | 0.051 | 0.065 |
| 20402-01-03-00 ♣ | 11/19/1996 | 4987 | 9863 | 5598 | 7.460.011 | 76.92 | 1.03 | 0.068 | 0.067 |
| class and | |||||||||
| 20402-01-28-00 ♣ | 05/18/1997 () | 3442 | 5480 | —— | ———— | ——– | 1.07 | 0.085 | 0.084 |
| 20402-01-04-00 ♣ | 11/28/1996 () | —– | —– | 4414 | 4.570.016 | ——– | 1.16 | 0.099 | 0.116 |
| 50703-01-08-00 | 05/04/2000 () | —– | —– | 3119 | 3.370.016 | ——– | 0.87 | 0.084 | 0.141 |
| 50703-01-08-01 | 05/04/2000 () | —– | —– | 3226 | 3.610.017 | ——– | 0.86 | 0.082 | 0.137 |
| 50703-01-09-00 | 05/11/2000 () | —– | —– | 2977 | 3.960.025 | ——– | 0.775 | 0.078 | 0.124 |
| 50703-01-09-01 | 05/11/2000 () | —– | —– | 2703 | 3.820.0305 | ——– | 0.78 | 0.082 | 0.133 |
| 50703-01-17-00 | 07/05/2000 () | —– | —– | 3538 | 2.970.0125 | ——– | 0.752 | 0.077 | 0.164 |
| 50703-01-17-01 | 07/05/2000 () | —– | —– | 3302 | 2.780.0125 | ——– | 0.766 | 0.08 | 0.168 |
1 Data used for spectral analysis are indicated by
2QP : Quiescent phase, 3BP : Burst phase
4BRT: Burst recurrence time (averaged over the orbit of observation)
5HR1: Ratio of count rate in 5 13 keV to count rate in 2 5 keV
6HR2: Ratio of count rate in 13 60 keV to count rate in 2 13 keV
We have used the 8 ms time resolution PCA data in 213 keV band to generate the power density spectra (PDS) for all the RXTE/PCA observations listed in Table 2. During the low-hard X-ray states (on 2000 May 4 and 2000 July 5, class /), QPOs are detected at frequencies 2.83.9 Hz whereas during the rest of the PCA observations (class ) QPOs are observed at higher frequencies (68 Hz). A plot of the QPO frequency and the source flux in 260 keV band for 2 PCUs during the observations of class , is shown in Figure 5. A strong correlation is found between the QPO frequency and the average X-ray flux with a correlation coefficient of 0.85 (for 25 degrees of freedom).
Various X-ray characteristics of GRS 1915105 such as nature of the light curve, gradual change in the burst recurrence time, hardness ratios HR1 and HR2, presence of QPOs and spectral properties in class are found to be similar to those in the oscillatory phase of class (Belloni et al. 2000). These properties are described in the next section.

4 Comparison between classes and
4.1 Timing Analysis
To compare the X-ray timing properties of GRS 1915105 in the X-ray classes and , we have selected one RXTE/PCA observation of each class (Obs. IDs 20402-01-03-00 and 20402-01-28-00 respectively) when all the 5 PCUs were on. Figure 6 shows the X-ray light curve for the above two RXTE/PCA observations for 1 s time bin obtained from the standard-1 data. The upper panel shows the presence of regular bursts with recurrence time of 60 s in the X-ray light curve of class whereas bursts with increasing recurrence time and decreasing peak intensity followed by a low-hard state lasting for 1000 s (class ) are shown in the bottom panel of Figure 6. At the end of the long stretched ( 1000 s) low-hard state,the bursts again reappear with a very high peak X-ray flux (similar to the peak flux of class ) which decreases gradually with increasing burst duration. We have shown, in Figure 7, the X-ray light curve for 1 s time bin in 260 keV energy range along with the hardness ratios (HR1 and HR2) for classes (left panels) and (right panels). It is seen that all the properties (structure of the light curves and the hardness ratios) are identical during the burst/quiescent phase of the two X-ray classes. The presence of QPOs in the PDS during the burst/quiescent phase of the classes and has been shown by Muno et al. (1999) (Fig. 1 (d) and 1(j)). From those figures, it can be seen that the QPO frequency during the particular observation of class lies between 57 Hz. During the class , the QPO frequency changes from 8 Hz at the beginning of the burst phase, to 5 Hz during the change of state to the low-hard state. As the QPO frequency varies directly with the intensity, the change in QPO frequency during the burst phase of class is due to a decrease in the X-ray intensity with the increase of recurrence time. In both the classes, the source is radio-quiet with similar flux densities at 2.25 GHz and 8.3 GHz (Naik and Rao 2000).
From the IXAE and RXTE observations of the source during 2000 MayJune (when the source was in the X-ray class ), it is noticed that there is a gradual change in the various properties of the source like burst recurrence time, intensity, QPO frequency etc. and the source makes a gradual transition to the low-hard state of the class /. These characteristics are very similar to those observed in the observations of class but at a much shorter time scale. Hence, we argue that the nature of the source over time scale of a few tens of days during the class is identical to that over a time scale of 1000 s during the class .

4.2 Spectral Analysis
To compare the results with earlier observations of the classes , and /, we have selected RXTE pointed observations of each class when all 5 PCUs were on. The observations made on 1996 November 19 (20402-01-03-00) and 1997 May 18 (20402-01-28-00) are used for classes and respectively whereas the observation of 1996 November 28 (20402-01-04-00) is used for the class . Details of these observations are given in Table 2. To study the spectral behaviour of the source during different phases, we have selected data at suitable time ranges for the burst/quiescent phases of the source in classes and . For the class , we have selected data for the burst phase when the source count rate was 15000 counts s-1 and for the quiescent phase when the source count rate was 10000 counts s-1. For the class , the burst phase corresponds to the source count rate 12000 and the quiescent phase to a count rate in the range of 7500 to 9500 (for 5 PCUs). To compare the spectrum of the source during the long stretch ( 1000 s) of low-hard state in class with that of class , we have selected the data when the source count rate was 6000. To get a complete spectrum in the broad energy band (3150 keV), we have combined the data obtained from RXTE/PCA and HEXTE. Energy spectra in 129 channel were generated from the Standard 2 mode PCA data. Standard procedures were applied for the data selection, background estimation and response matrix generation (Rao et al. 2000). Systematic error of 2% have been added to the PCA spectral data. For HEXTE, standard 2 as well as the archive mode data from the HEXTE Cluster 0, which has better spectral response, have been used.


We have fitted the spectrum for the burst and the quiescent phases of both the classes and using the standard black hole model (Muno et al. 1999) consisting of “disk-blackbody and power-law” and “disk-blackbody and a thermal-Compton spectrum” with a fixed value of absorption by intervening cold material parameterized as equivalent Hydrogen column density NH at 6 1022 cm-2. Simultaneous spectral fits to the PCA (in the energy range of 325 keV) and HEXTE (in the energy range of 15150 keV) spectra were performed for different phases of classes and , keeping the relative normalization as a free parameter. The same procedure was followed for the fitting of the spectrum during the long stretched low-hard state of class and the observation of class . The fitted parameters for the above two models are given in Table 3. From the table, it is observed that for the “disk-blackbody and power-law” model, there is no significant difference in the spectral parameters for the two different classes. For the “disk-blackbody and thermal-Compton spectrum” model, it is seen that the disk temperatures, and the optical depth of the Compton cloud are identical for the classes and during the different states. Comparing these two models, it is found that the model with disk-blackbody and thermal-Compton spectrum fits better than the model with disk-blackbody and power-law.
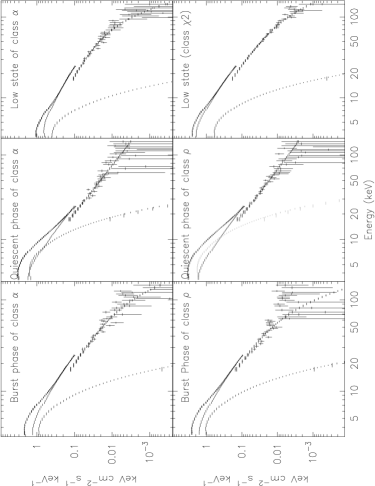
The resultant deconvolved energy spectra for the “disk blackbody and thermal-Compton” model are shown in Figure 8 for different phases of the classes and and the long stretched low-hard states of classes and . From the figure and Table 3, it is clear that the source spectrum is identical during the burst and quiescent phases of the two X-ray classes and .
4.3 ASM Light Curve
We have examined the X-ray light curves of 562 publicly available RXTE/PCA observations till 2000 October 11. We found that 70 observations are of class and 30 observations are of class . Naik and Rao (2000) have described the similarities in the radio properties of the source during both the and classes. To examine the pattern of change of state of the source between the X-ray classes and , we show in Figure 9 the one day averaged ASM light curve of GRS 1915105 with the identified and classes marked with filled circles and filled triangles respectively. From the figure, it is noticed that the change of state of the source occurs from the radio-quiet low-hard state (/) to high-state through the classes and . It is also observed that these two classes appear together during the switching of state from low-hard state to high state which strengthen the argument that the classes and have strong similarity. During the switching of the source from a low-hard state (/) to the high-state, it goes through the class followed by class which is very clear during the transition from a long stretch of low hard state of class / to high state during MJD 50490 50600. Direct switching to the class from the low-hard state is not observed.
Based on the observed X-ray and radio properties, we find that the X-ray classes and are identical except for the presence of a long stretch of low-hard state in class similar to the radio-quiet low-hard states of class /. In other-words, we can say that the X-ray class is the same as the combined class of and /.
5 Discussion
The Galactic microquasar GRS 1915105 shows extended low-hard states on several occasions. These low-hard states are characterized by a low frequency QPO at 3 Hz. The source switches from an extended low-hard state into a high-soft state in a wide range of time scales. Rao et al. (2000) have observed a slow transition from a low-hard state to a high-soft state (in about 3 months) in 1997 MarchAugust. They have also reported a state transition in a very fast timescale (a few seconds) when the source was exhibiting irregular bursts in the X-ray light curves. However, the observed state transition of the source over a wide range of time interval is not yet clearly understood. On 2000 June 27, the source made a transition from a regular oscillatory behaviour (class , in which the light curve contains regular bursts with recurrence time in the range 40120 s) to a steady emission (low-hard state) within 1.5 hour. The characteristic properties of slow rise and fast decay of these regular bursts of class are unique. Taam et al. (1997) have attempted to describe these bursts in the framework of thermal/viscous instabilities in the accretion disk. Vilhu and Nevalainen (1998) tried to explain the properties of these regular bursts by using a two phase self-consistent thermal radiative model. Paul et al. (1998) interpreted the observed slow rise and fast decay of the regular bursts as the evidence for the disappearance of matter into the event horizon of the black hole. Chakrabarti et al. (2000) interpreted the observed features in GRS 1915105 in the light of advective disk paradigm which includes self-consistent formulation of shocks and out-flows from post-shock region and described the oscillatory behaviour during the X-ray classes and as the combination of the high count rate “On-state” and the low-count rate “Off-state”. Using this model, we have tried to explain the observed correlation between the QPO frequency and the X-ray intensity during the observations of class .

| Parameters1 | Quiescent phase | Burst phase | Low-hard state | |||
|---|---|---|---|---|---|---|
| Model: Disk blackbody (diskbb) + power-law | ||||||
| Reduced | 1.49 | 1.97 | 1.49 | 1.34 | 1.87 | 2.79 |
| 2.710.02 | 2.860.02 | 2.75 0.03 | 2.80 0.01 | 2.390.02 | 2.760.01 | |
| (keV) | 1.310.02 | 1.440.02 | 1.8 0.01 | 1.99 0.01 | 1.050.04 | 1.310.2 |
| HEXTE Count rate | 631 | 631 | 681 | 621 | 611 | 931 |
| PCA Count rate | 800137 | 947445 | 1264759 | 1399464 | 433619 | 997344 |
| Model: Disk blackbody (diskbb) + thermal-Compton (CompST) | ||||||
| Reduced | 0.99 | 1.53 | 1.46 | 1.30 | 0.79 | 0.9 |
| (keV) | 1.32 0.02 | 1.37 0.02 | 1.79 0.02 | 1.96 0.01 | 1.17 0.03 | 1.35 0.03 |
| (keV) | 19.45 2.1 | 13.14 1.28 | 57.45 28.4 | 30.39 7.85 | 15.73 1.08 | 21.82 1.2 |
| 2.87 0.23 | 3.49 0.26 | 1.24 0.49 | 1.96 0.37 | 3.91 0.2 | 2.66 0.1 | |
1 : : Power-law photon index, kTin : Inner disk temperature, kTe : Temperature of the Compton cloud, : Optical depth of the Compton.
Chakrabarti & Manickam (2000) derived a relation between the QPO frequency in 110 Hz range and duration of the quiescent phases (class and ). As the 110 Hz QPO could be due to the oscillation of shocks located at tens to hundreds of Schwarzschild radius, they tried to explain the switching of burst phase to quiescent phase and vice versa and the duration of the quiescent phase by assuming an outflow from the post-shock region. Assuming the flow to be isothermal until Rc (the location of the sonic point), a shock compressed gas with R (the shock compression ratio) 1, must produce outflows which pass through the sonic points. Hence matter is subsonic until the sonic point. As the Compton cooling becomes catastrophic when the Thomson scattering opacity (kes) becomes 0.4, the duration of the off state (i.e. the duration between the end of a burst and the beginning of the next burst which we described as the quiescent phase) is given by toff (4R)/(3 kes). Using the relation between inflow and outflow rates (Chakrabarti 1998), = 3/2 (for a low angular momentum freely falling matter), and v0 = 1, the duration of the off state is given by
| (1) |
where
| (2) |
and are the solid angles of the inflow and the outflow respectively. Keeping the numerical coefficient constant in the above equation by putting the value of = 1 and v0 = 0.066, which is very reasonable for a black hole accretion, one obtains
| (3) |
This relation has been found to be valid for all the observations. According to this relation, the greater is the value of the duration of the off state toff, less is the frequency of the QPOs. If one compares the presence of QPOs and the duration of the off state (quiescent phase) in the Figure 1(d) of Muno et al. (1999), it can be seen that, during class the QPOs are at similar frequencies. Also in their Figure 1(j), during the on and off states of class , the QPO frequencies change according to the above relation.
In class , the relation between QPO frequency and toff should be valid for a given day and the proportionality constant varies for each day. We find that toff2 is correlated with the quiescent count rate with a correlation coefficient of 0.94. This can be explained by the fact that for a given day can change (see eqn. 1) and it should be related to the quiescent count rate.
Although different states of the microquasar GRS 1915105 are explained by various models, none of the models explain the transition from one state to other. It would be interesting to study the changes in the emission processes in the accretion disk and the factors which trigger the change of state as well as the transition from one class to another in the source.
Acknowledgments
We acknowledge the contributions of the scientific and technical staff of TIFR, ISAC and ISTRAC for the successful fabrication, launch and operation of the IXAE. We thank Dr. S. Seetha and Dr. K. Kasturirangan for their contribution to the IXAE. It is a pleasure to acknowledge constant support of Shri K. Thyagarajan, Project Director IRSP3 satellite, Shri R. N. Tyagi, Project Director IRSP4 satellite, Shri J. D. Rao and his team at ISTRAC, Dr P. S. Goel, Director ISAC and the Director of the ISTRAC. SN thanks M. Choudhury for his comments and discussions on the manuscript. This research has made use of data obtained through the High Energy Astrophysics Science Archive Research Center Online Service, provided by the NASA/Goddard Space Flight Center. Finally we thank an anonymous referee for his comments and suggestions which resulted in very significant improvement of this paper.
References
- [] Agrawal, P. C., Perspective in High Energy Astronomy and Astrophysics; Proceedings of the International Colloquium, Aug. 12-17, 1998 at TIFR, Mumbai, eds: P. C. Agrawal and P. R. Viswanath, University Press, Hyderabad, India, p408
- [] Belloni, T., Klein-Wolt, M., Mendez, M., van der Klis, M., and van Paradijs, J. 2000, A&A, 355, 271
- [] Castro-Tirado, A.J., Brandt, S., & Lund, N. 1992, IAU Circ., 5590.
- [] Chakrabarti, S. K. 1998, in Observational Evidence for Black Holes in the Universe, ed. S. K. Chakrabarti (Dordrecht: Kluwer), 19
- [] Chakrabarti, S. K. & Manickam, S. G. 2000, ApJ, 531, L41
- [] Chakrabarti, S. K., Manickam, S. G., Nandi, A., Rao, A. R. 2000, in Ruffini R., ed., Proc. 9th Marcel Grossman Conf. World Scientific, Singapore (in press)
- [] Greiner, J., Morgan, E. H., & Remillard, R. A. 1998, New Astron. Rev., 42, 597
- [] Mirabel, I. F. & Rodriguez, L. F. 1994, Nature, 371, 46
- [] Morgan, E. H., Remillard, R. A., & Greiner, J. 1997, ApJ, 482, 993
- [] Muno, M. P., Morgan, E. H., & Remillard, R. A. 1999, ApJ, 527, 321
- [] Naik, S., & Rao, A. R. 2000, A&A, 362, 691
- [] Naik, S., Agrawal, P. C., Rao, A. R., Paul, B., Seetha, S., & Kasturirangan, K. 2001, ApJ, 546, 1075
- [] Paul, B., Agrawal, P. C., Rao, A. R., Vahia, M. N., Yadav, J. S., Seetha, S., & Kasturirangan, K. 1998, ApJ, 492, L63
- [] Rao, A. R., Agrawal, P. C., Paul, B., Vahia, M. N., Yadav, J. S., Marar, T. M. K., Seetha, S., & Kasturirangan, K. 1998, A&A, 330, 181
- [] Rao, A. R., Yadav, J. S., & Paul, B. 2000, ApJ, 544, 443
- [] Taam, R. E., Chen, X., & Swank, J. H. 1997, ApJ, 485, L83
- [] Vilhu, O., & Nevalainen, J. 1998, ApJ, 508, L85
- [] Yadav, J. S., Rao, A. R., Agrawal, P. C., Paul, B., Seetha, S., & Kasturirangan, K. 1999, ApJ, 517, 935