email: faraggiana@ts.astro.it 22institutetext: Institut d’Astrophysique, 98 bis Bd Arago F-75014 Paris, France
email: gerbaldi@iap.fr 33institutetext: Université de Paris Sud XI 44institutetext: Istituto Nazionale per l’Astrofisica – Osservatorio Astronomico di Trieste, Via G.B.Tiepolo 11, I-34131 Trieste, Italy
email: bonifaci@ts.astro.it
HD 174005: another binary classified as Boo ††thanks: Based on observations collected at the European Southern Observatory (ESO), La Silla (Chile) in the framework of the Key Programme 5-004-43K
We demonstrate that HD 174005, a star recently classified as belonging to the Boo group, is in reality a double lined spectroscopic binary; at some phases, the observed composite spectrum may be similar to that of a single star with weak metal lines.
Key Words.:
08.01.3 Stars: atmospheres - 08.03.2 Stars: Chemically Peculiar - 08.02.4: Stars: binaries: spectroscopic1 Introduction
In a recent paper Gray et al (2001) give a precise spectral classification of 372 late-A to early-G stars and announce the discovery of a new Boo star: HD 174005. The spectrum is described as that of a star with the temperature of an A7-type star but with the K line and metallic line strengths of an A2-type star.
The spectra of the A-F type stars classified as Boo are characterized by weak lines of most metallic species (with the possible exception of C,N,O and S); the interpretation of the phenomenon responsible for these anomalous atmospheric abundances is still controversial in spite of the large efforts made to define the spectral peculiarities common in these stars and to interpret the position of these stars in the HR diagram in terms of their evolutionary stage.
The non homogeneous properties of Boo stars have been confirmed by the analyses extended to spectral ranges other than the classical optical region. For example the IRAS data made it possible to detect the presence of an IR excess, interpreted as the signature of the presence of circumstellar matter around some of these stars. A broad absorption feature centred at 1600 Å has been detected in some Boo stars by studying their IUE spectra; this feature, due to a Lyman satellite, is present in white dwarfs and FHB stars too and its detectability in Boo stars is made possible, in the current opinion, by the lower opacity sources of Boo stars compared to ”normal” A-type stars. These are the main, but not the only, heterogeneous properties of this class of stars.
A detailed inspection of the global situation prompted us to inspect an alternative explanation of the so called Boo phenomenon, that of the duplicity of these stars and we found several observational facts to support this new hypothesis as described in Faraggiana & Bonifacio (1999) and in Faraggiana et al (2001). In fact a composite spectrum, not detected as such, can be easily confused with that of a single metal deficient star. Several catalogues which provide Boo classifications are in fact contaminated by unrecognized binaries and the abundance analyses of such objects, treated as single sources, are meaningless. The purpose of our study is to detect the binary stars considered up to now as single peculiar objects.
HD 174005 represents a good example to confirm our hypothesis. We discuss in the next sections the photometric and spectroscopic characteristics of this object.
2 Observations
2.1 Optical data
2.1.1 Spectroscopy
We observed HD 174005 twice in the course of an ESO Key Program on June 9, 1992 and September 7, 1993. The observations have been made at the ESO 1.5m telescope equipped with the Echelec spectrograph; the spectra covered 300 Å centred on Hγ line with a resolution of about 28000; the chosen aperture of 320 m corresponds to 152 on the sky. Details on the original frames and on their reduction and calibration are given in Gerbaldi et al (1999). These spectra have been been already analysed for the measure of stellar radial velocity by Grenier et al (1999) and the duplicity of this star was then detected.
The two spectra have been obtained at significantly different phases; the duplicity is obvious in the first one, taken in 1992, while it is not so obvious in the 1993 observation (see Fig. 1). A large difference in the metal line profiles is easily noticed when these two spectra are compared to each other and can be better quantified by comparing the observations with theoretical predictions.
We looked for more observations from the bibliography. We were able to find two contradictory stellar classifications: the recent one by Gray et al. (2001) referring to a metal weak object and the one by Abt (1988) who classifies HD 174005 as an Am star.
The spectra by Gray et al (2001) on which the classification of HD 174005 as a classic Boo star is based, were obtained with a resolution of 1.8 Å and cover the wavelength region from 3800 to 4600 Å; the number of spectra collected by these authors is not specified. The spectra by Abt (1988) have a resolution of 1.0 Å . In a previous paper, Abt (1985) classified this star as an A2 II, with spectra of 2.6 Å resolution.
According to our interpretation, these different classifications are likely to be the consequence of the spectroscopic variability of this object.
2.1.2 Photometry
The information we could retrieve from the literature on this star are quite scanty; the star has been observed photometrically only by Oblak E. (1978) in uvby (two observations) and by Hall & Mallama (1974) and by Eggen (1968) once and twice respectively in UBV, so that a possible photometric variability could have passed unobserved.
The photometric observations by the Tycho experiment on board of the Hipparcos space experiment span over 3 years; no variability was detected from the 83 observed values, according to the Hipparcos Main Catalogue (ESA 1997); in fact the star is labelled ”C”= constant. HD 174005 (= BD = TYC 5126-2404) has a nearby visual companion HD 174005B (= BD = TYC 5126-2381), the similar proper motion of this pair, as given in the Tycho-2 Catalogue (Hog et al. 2000) suggests that they are physically linked. However since the parallax has not been measured for HD 174005B a doubt remains on the physical association of these two objects.
From the uvby colour indices we derived the interstellar absorption by using the Moon (1985) code. The resulting E(b-y)=0.050 is slightly larger than that obtained for HD 174005 B by the same procedure: E(b-y)=0.030. By assuming the hypothesis that the two stars are physically associated, i.e. have the same distance, the latter E(b-y) value is coherent with the results of the analysis by Vergely et al (1998) of the interstellar extinction in the solar neighbourhood.
2.2 UV data
HD 174005 has not been observed by IUE, but only by the S2/68 on board of the ESRO TD1 satellite. The measured fluxes at 2740, 2365, 1965 and 1565 Å allow to determine the stellar reddening on the basis of the UV colours only, as discussed in the Catalogue of stellar UV fluxes (Thompson et al, 1978). The approximate relation for A-type stars:
has been used to derive an independent reddening value.
The extinction E(B-V)=0.152 so obtained is much higher than that derived from the visual uvby photometry, E(B-V)=0.069. We shall discuss these UV data in the next section with theoretical computations of the UV fluxes.
3 Stellar parameters and spectral synthesis
3.1 Atmospheric parameters
The atmospheric parameters derived from the uvby colour indices by using the Moon and Dworetsky (1985) code and adopting the previously derived reddening, E(b-y)=0.050, are =7910 K and log=3.79.
We have also used the Geneva photometry indices to compute and log g, by adopting the same reddening value and by using the Künzli et al (1997) calibration; in this case the parameters are: = 7673 65 K, log g = 3.98 0.06 and [M/H] = -0.77 0.24.
3.2 HR diagram
These data allow us to put the star in the HR diagram. For that purpose we used the evolutionary tracks computed by Schaller et al (1992) and the isochrones by Meynet et al (1993) for the solar chemical composition.
The absolute magnitude corrected for the reddening is: MV=0.27; by applying the bolometric correction, taken from the Bessell et al (1996) tables, the bolometric magnitude results Mbol=0.22. By adopting Mbol⊙=4.75 the luminosity is derived: log (L/L⊙)=1.81. According to the position of the star in the HR diagram the value of log g is of about 3.6, slightly lower than the two photometrically derived values 3.79 and 3.98.
3.3 Computed spectra
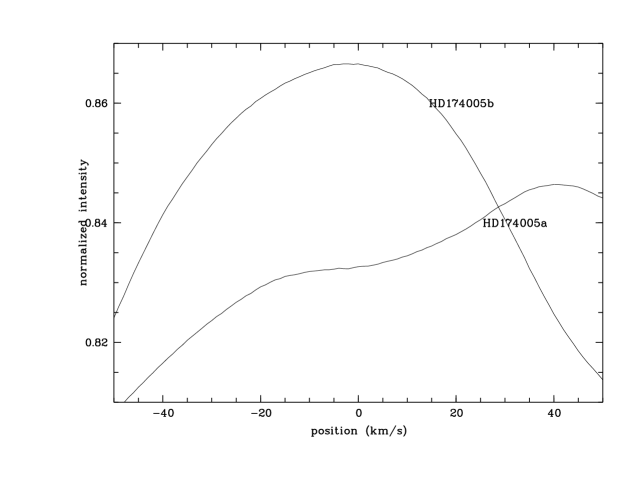
We have computed a synthetic spectrum by using the Kurucz model with =8000 K, log g=4.0 and solar abundances to investigate the correlation with the observations. The normalized cross correlation indices between the two observed spectra and the theoretical one are displayed in Fig. 1. The two peaks obtained for the 1992 spectrum are evident, while only a broad and asymmetric cross correlation curve results from the 1993 data; however we note the low value of the normalized correlation peak even at this date.
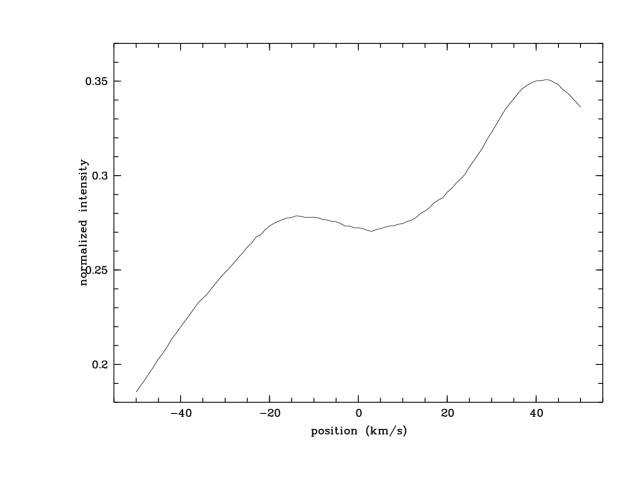
A further correlation (Fig. 2) of only the metallic lines with as template the spectrum computed by using the model with the Geneva atmospheric parameters shows even better the two peaks for the 1992 spectrum and allows to measure the differential radial velocity of the two components of this spectroscopic binary system at this phase: RV= 52 km s-1.
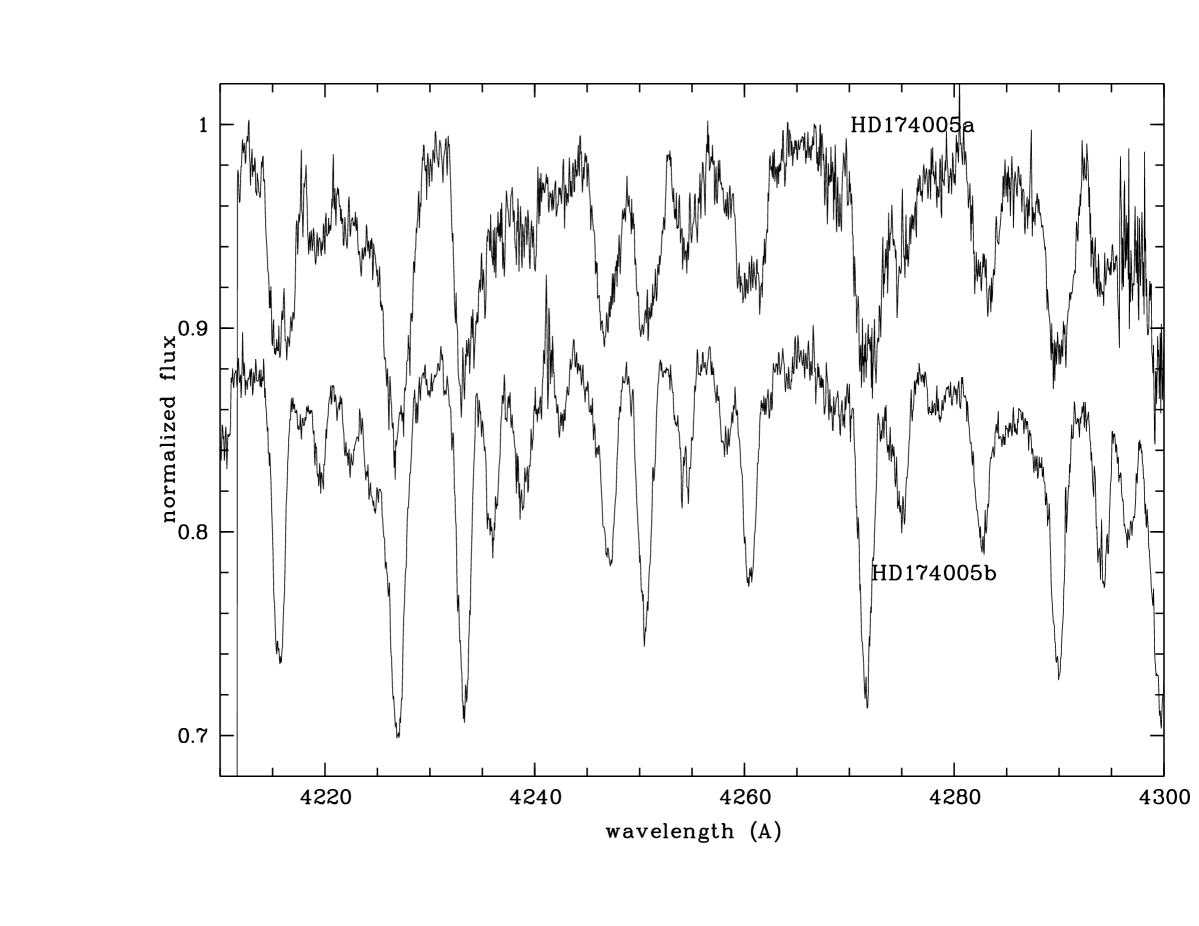
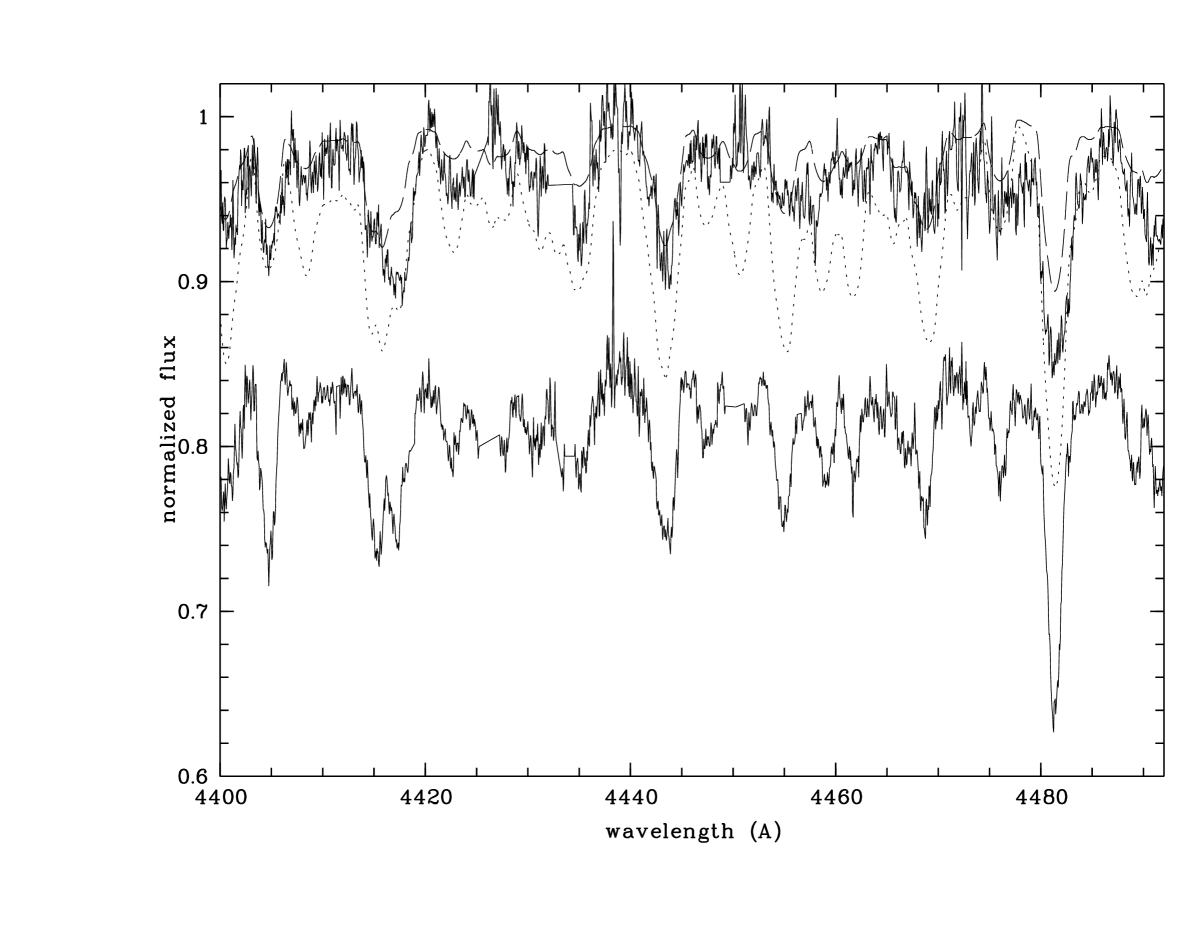
The large variations in the line profiles of the metal lines are shown in Fig. 3, where a sample of the 2 spectra, corrected for the radial velocity values of the brighter component are plotted. The star appears as a clear SB2 on the 1992 spectrum; we note in particular the well resolved Sr II 4215 line, the double peaks of the Fe I 4271 and of the Cr I-Ti II 4290 blends and the general broader profiles in this spectrum labelled as HD174005a.
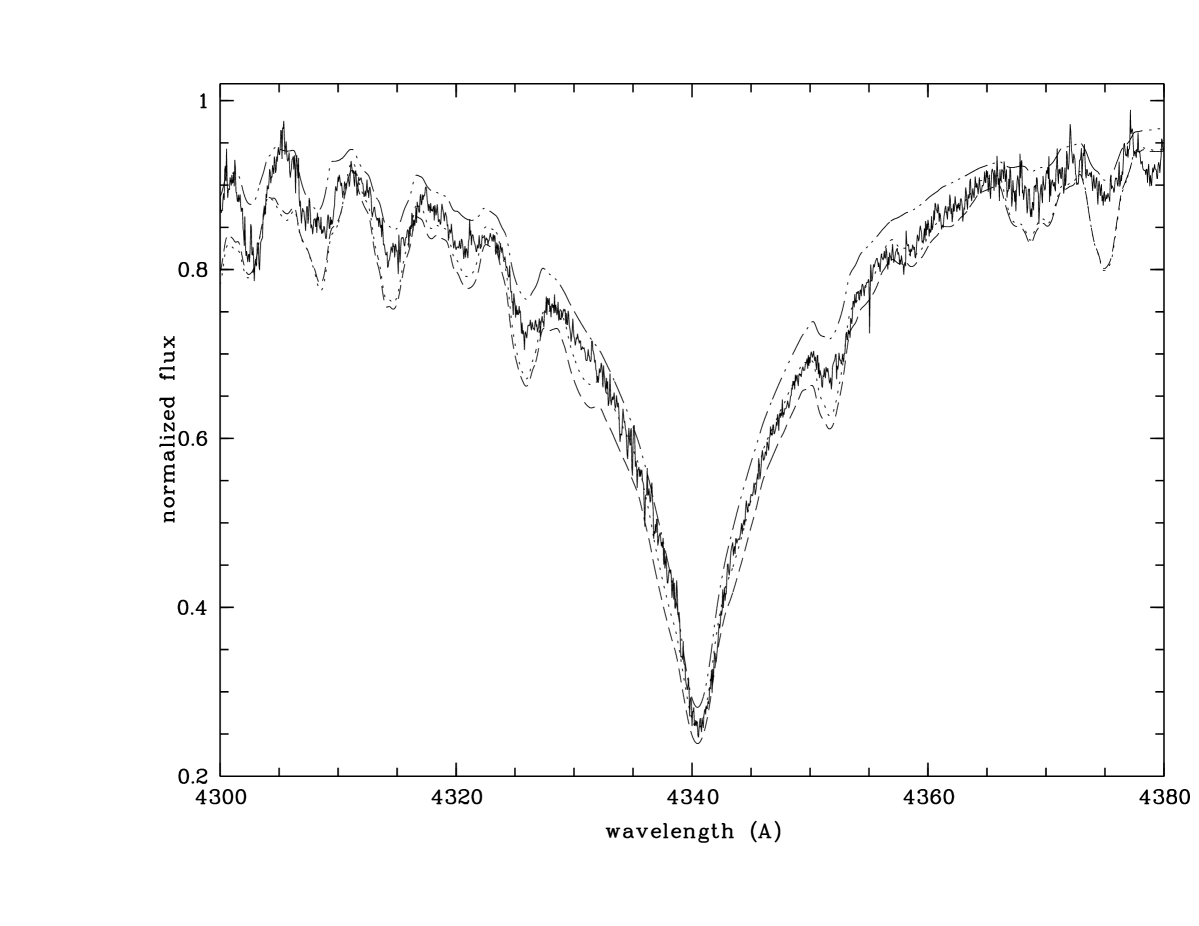
As a further sign of duplicity we recall that the observed core of Balmer lines should be deeper than that in the spectrum computed by using Kurucz SYNTHE code which does not include NLTE effects. In the contrary, the spectrum taken in 1992 has the Hγ core shallower than or as deep as the computed ones. In Fig. 4 this observed profile is compared with those computed by using the models with the parameters derived in section 3.1. The best fit of Hγ is obtained by using the parameters =7673 K, log g=3.98 and solar abundances; however this choice does not reproduce the metallic lines as may be seen in Fig. 5.
The broad and apparently weak metal lines in the 1992 spectrum are given in Fig. 5 where are compared with two computed spectra (=7673 K, log g=3.98), one with solar abundances and the other one with these reduced by 10.; we note in particular the non-rotationally broadened profile of Mg II 4481 which is characterized by a very flat and square core in the 1992 spectrum.
Having only two spectra at our disposal and taken at more than one year of interval, we cannot make any guess on the possible period of this system.
3.4 UV photometry
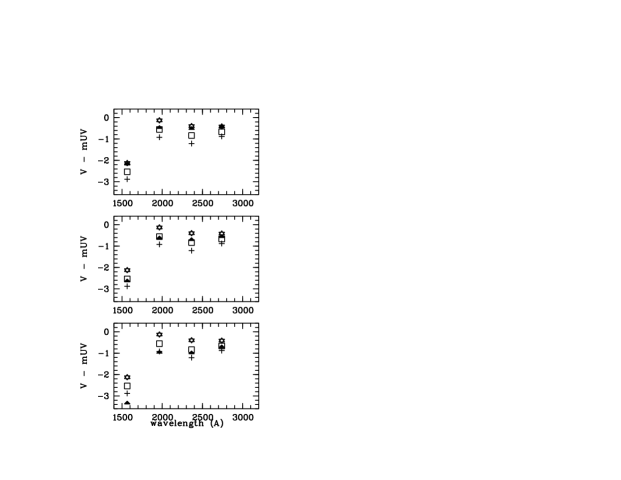
We have compared the S2/68 TD1 observations, dereddened by using E(B-V)=0.069 or 0.152, with theoretical indices computed by integrating the Kurucz fluxes for several metal-abundances, over the band-width of the four S2/68 TD1 channels.
The observed and theoretical colour indices (Vm are shown in Fig. 6. The flux energy distribution of HD 174005 in the UV does not indicate a significant metal underabundance unless the unrealistic high reddening E(B-V)=0.152 is assumed. The observations fit the computations with a moderate underabundance between and dex. This is coherent with the value of derived from the Geneva photometry.
The coherence of the flux distribution over a large wavelength range from the optical to the UV reinforces the result obtained from spectroscopy in the optical: the two stars have a very similar luminosity and effective temperature.
4 Conclusions
We have shown that HD 174005 is a spectroscopic binary and the observed spectrum is highly variable with the phase. The confusion between the spectrum of a single weak lined star and the composite spectrum of a binary composed by two similar, but not equal sources, is demonstrated.
A careful check of high dispersion data and the analysis based on more than a single spectrum appear to be necessary to obtain reliable abundance analyses of Boo candidates; as a first step it is necessary to distinguish composite spectra from those of single weak-lined stars and this can require a quite subtle analysis of mean-high resolution spectra.
References
- (1) Abt H.A. 1985, ApJS 59, 95
- (2) Abt H.A. 1988, ApJ 331, 922
- (3) Bessell M.S., Castelli F., Plez B., 1998 A&A 333, 231 and 337, 321
- (4) Eggen O.J. 1968, Royal Obs. Bull. No. 137
- (5) Faraggiana R., Bonifacio P. 1999, A&A 349, 521
- (6) Faraggiana R., Gerbaldi M., Bonifacio P. 2001, A&A 376, 586
- (7) Gerbaldi M., Faraggiana R., Burnage R., et al 1999, A&AS 137, 273
- (8) Gray R.O., Napier M.G., Winkler L.I. 2001, AJ 121, 2148
- (9) Grenier S., Burnage R., Faraggiana R., et al 1999, A&AS 135, 503
- (10) Hall D.S., Mallama A.D. 1974, Acta Astron. 24, 359
- (11) Hog E., Fabricius C., Makarov V.V., et al 2000, The Tycho-2 Catalogue
- (12) Künzli M., North P., Kurucz R.L. 1997, A&AS 122, 51
- (13) Meynet G., Mermilliod J-C. and Meader A., 1993, A&AS 98, 477
- (14) Moon T.T. 1985 Comm. from the Univ. of London Obs. 78 and Revisions in 1985, private comm.
- (15) Moon T.T. Dworetsky M.M. 1985 MNRAS 217, 305 (MD)
- (16) Oblak E. 1978, A&AS 34, 453
- (17) Schaller G., Schaerer D., Meynet G., Maeder A., 1992 A&AS 96, 269
- (18) Thompson G.I., Nandy K., Jamar C. 1978, Catalogue of Stellar Ultraviolet Fluxes, The Science Research Council
- (19) Urban S.E., Corbin T.E., Wycoff G.L. 1997, The ACT Reference Catalog, U.S. Naval Observatory, Washington D.C.
- (20) Vergely J.-L., Freire Ferrero R., Egret D. and Köppen J. 1998, A&A 340, 543