Radial Color Gradients in K+A Galaxies in Distant Clusters of Galaxies
Abstract
Galaxies in rich clusters with z 0.3 are observed to have a higher fraction of photometrically blue galaxies than their nearby counterparts. This raises the important question of what environmental effects can cause the termination of star formation between z 0.3 and the present. The star formation may be truncated due to ram-pressure stripping, or the gas in the disk may be depleted by an episode of star formation caused by some external perturbation. To help resolve this issue, surface photometry was carried out for a total of 70 early-type galaxies in the cluster Cl1358+62, at z 0.33, using two-color images from the Hubble Archive. The galaxies were divided into two categories based on spectroscopic criteria: 24 are type K+A (e.g., strong Balmer lines, with no visible emission lines), while the remaining 46 are in the control sample with normal spectra. Radial color profiles were produced to see if the K+A galaxies show bluer nuclei in relation to their surrounding disks. Specifically, a linear gradient was fit to the radial color profile of each galaxy. We find that the K+A galaxies on average tend to have slightly bluer gradients towards the center than the normals. A Kolmogorov-Smirnov two-sample test has been applied to the two sets of color gradients. The result of the test indicates that there is only a 2% probability that the K+A and normal samples are drawn from the same parent distribution. There is a possible complication from a trend in the apparent magnitude vs. color gradient relation, but overall our results favor the centralized star formation scenario as an important process in the evolution of galaxies in dense clusters.
1 Introduction
Butcher & Oemler (1978, 1984) were the first to establish a rapid decline in the star formation rate in rich clusters of galaxies since z 0.5, when they discovered a significant increase of the blue galaxy fraction with increasing redshift, from about 3% in nearby clusters, to 25% in clusters at z 0.5. In addition, Hubble Space Telescope (HST) images have shown that the fraction of spirals, as well as interacting or merging galaxies, increases with redshift, and that the increase in the spiral population towards higher redshift corresponds to a decrease in the S0 population (Dressler et al. 1997; Fasano et al. 2000). Given that both gas removal, leading to globally truncated star formation (Gunn & Gott 1972), and starburst-provoking (through various tidal perturbation scenarios, e.g., Moore et al. 1996; Bekki 1999) mechanisms are almost certainly operating in the rich cluster environment, it is a non-trivial matter to disentangle which mechanism primarily dominates galaxy evolution in various cluster environments. The situation is further exacerbated by the fact that, except for immediately (e.g., 0.5 Gyr) after a burst of star formation, which produces extremely blue colors and strong Balmer absorption lines, a fading starburst and a fading, truncated disk are basically impossible to distinguish from global colors and spectroscopy (e.g., Newberry, Boroson, & Kirshner 1990). Consequently, there has been considerable disagreement over the interpretation of the strong Balmer line galaxies in z 0.5 clusters, originally discovered by Dressler & Gunn (1983), as to whether they represent post-starburst galaxies (Dressler & Gunn 1983; Couch & Sharples 1987; Barger et al. 1996; Dressler et al. 1999; Poggianti et al. 1999), or galaxies with globally truncated star formation (e.g., Balogh et al. 1999). These issues are more extensively summarized in Rose et al. (2001), and here we simply restate two key, related questions which need to be answered: (1) What form does the rapid cluster galaxy evolution take: is it predominantly driven by gas removal (Balogh et al. 1999) or a final burst of star formation (e.g., Dressler et al. 1999; Poggianti et al. 1999), and (2) What is the mechanism for the evolution: ram-pressure stripping (Gunn & Gott 1972; Abadi, Moore, & Bower 1999) or tidal perturbations (e.g., Moore et al. 1996; Bekki 1999)?
As is discussed in Rose et al. (2001), ram pressure stripping of gas in galaxies is expected to lead to a roughly uniform truncation of star formation across the disk, while tidal mechanisms produce centralized bursts of star formation (Mihos & Hernquist 1996). Consequently, observing the spatial distribution of the last star formation in galaxies can provide key evidence regarding the method through which the star formation has been extinguished. In Rose et al. (2001) recent star formation was investigated in a number of early-type galaxies in nearby clusters, and it was concluded that this star formation is centralized. The evidence for centralized star formation is based on the spatial distribution of emission lines in the cases where star formation is still ongoing, and on the radial color profiles in the cases where star formation has been recently terminated. Consequently, it is of interest to assess the situation in clusters at higher redshift, where the ongoing star formation activity is at a substantially higher level. Recently, van Dokkum et al. (1998; hereafter VD98) completed an extensive study of the z 0.33 cluster CL1358+62, and have published radial color profiles for several galaxies, including a few in which a blue nuclear region is evident. Based on these results, we have used the archival HST imaging data for CL1358+62, in conjunction with spectroscopic information published in Fisher et al. (1998; hereafter F98), to assess whether the cluster galaxies which show evidence of recently terminated star formation also have centrally concentrated blue colors.
In section 2, the spectroscopic and imaging data are summarized, as well as the definitions of two galaxy samples, a “normal” sample and a “K+A” sample, the latter consisting of galaxies with spectroscopic evidence of recently concluded star formation. In addition, the analysis techniques for obtaining radial color profiles are discussed. In section 3, a statistical comparison of the radial color profiles for the two galaxy samples is given, to test whether the K+A sample on average shows bluer central colors than the control sample. In section 4, we discuss our results within the context of the question of whether tidal perturbations or ram pressure stripping have had a greater effect on the evolution of galaxies in clusters. Throughout the paper we assume that H∘=70 km s-1 Mpc-1 and qo = 0.15.
2 Data Samples
The imaging used for this paper was collected from the Hubble Space Telescope Archive, and was combined with spectroscopic data obtained from the literature, for the purpose of observing the spatial distribution of recent star formation within cluster galaxies. The HST Archive has been searched for galaxy clusters of moderate (e.g., ) redshift that have been imaged in at least two passbands, using the WFPC2 instrument. Our search resulted in a sample of four clusters: Abell 2390 at z 0.23, CL1358+62 at z 0.33, CL0303+17 at z 0.42, and CL0016+16 at z 0.55. The literature on each cluster was then researched for spectroscopic information. The specific information we require is Balmer line strengths and [OII]3727 emission line strengths, which are indicative of the levels of recent (e.g., within the past few Gyr) and current (e.g., ongoing) star formation.
In this paper, only CL1358+62 is discussed, as the other three clusters were discarded for various reasons. First, they all had very limited sky coverage when compared to CL1358+62. The images of Abell 2390 did not include any of the galaxies that had been classified spectroscopically as having recently concluded star formation; in addition, only one exposure was taken at each pointing, making removal of cosmic rays difficult. Both of the remaining clusters were not included in the final analysis, due to the fact that they had small samples of galaxies with low signal-to-noise data, which did not make them suitable for statistical analyses. CL1358+62, on the other hand, was imaged in a mosaic over a large area, and had more than one exposure at each pointing, greatly facilitating cosmic ray removal.
CL1358+62 is a rich, moderate-redshift cluster, which is also X-ray luminous (Lx 7x1044 ergs/s at 0.2 – 4.5 keV) (Fabricant, McClintock, & Bautz 1991). The presence of a pervasive hot intracluster medium along with the high velocity dispersion of the galaxies (=1037 km s-1; F98) ensures that ram pressure stripping of the interstellar medium in galaxies should play an important role in the evolution of galaxies passing near the cluster center. F98 have carried out spectroscopy in CL1358+62, including line strengths for the Balmer absorption lines H, H, and H, and also the emission line [OII] at 3727Å.
We have divided many of the member galaxies in CL1358+62 into two samples, based on their spectroscopic features as given in F98. One is a control sample, consisting of galaxies with normal spectra for old stellar populations, e.g., no emission and weak Balmer absorption lines. The second sample consists of galaxies with low emission and strong Balmer absorption. Originally known as E+A galaxies (Dressler & Gunn 1983), they are now commonly referred to as “K+A” or “k+a/a+k” (Franx 1993; Dressler et al. 1999; Poggianti et al. 1999), hence we adopt the K+A terminology. Specifically, for the K+A sample, the average of the three Balmer lines (H) is required to have an equivalent width of at least 3Å, and the emission strength is limited to less than 5Å. The normal sample is defined to have a limit of 1.5Å in H, and the [OII] line was restricted to lie between –5Å and 5Å. F98 define normal and post-starburst galaxies slightly differently. Our definitions make the limits more stringent for the normal red absorption-line galaxy population, and slightly increase the number of galaxies classified as K+A. Our characterization of K+A galaxies using H (following F98) differs from the characterization of Dressler et al. (1999), who used solely H to define their k+a/a+k galaxies. Despite the difference in these criteria, we have found that the H cut-off of our K+A sample is virtually identical to the 3Å equivalent width H cut-off for k+a galaxies used by Dressler et al. (1999) (only three of our 24 K+A galaxies have H 3Å).
Our final samples include 24 K+A galaxies, and 46 normal galaxies. We have defined the samples so that there is a gap between them, to account for leakage through the large error bars. Given the rather large error bars in Balmer line and [OII] equivalent widths, there may be some leakage of galaxies from one sample into another, which would tend to weaken any intrinsic differences that we observe between the two samples. Fig. 1 illustrates where the two samples fall on an [OII] emission vs. H absorption plot, and shows typical error bars for the galaxies in the two samples as given in F98. There are some galaxies that fit within our limits but were excluded from the two final samples either because they were very close to the edge of a frame or a nearby neighbor or they could not be located on the images.
We did not use any morphological criteria when originally defining our samples. However, VD98 have listed morphological types for the galaxies in the cluster, and the vast majority included in our samples (nearly 75% in the K+A group, and approximately 90% in the normal group) are type E, E/S0, or, more commonly, S0. The rest they have assigned “?” morphologies, and one is classified as an irregular. Three unique cases having peculiar morphologies will be discussed in more detail in section 3.

2.1 Data Reductions
Surface photometry of the galaxies in the normal and K+A samples has been carried out using the WFPC2 images from the HST Archive, which are fully described in VD98. VD98 imaged the cluster at 12 different positions in two filters (F606W at 5957Å and F814W at 7940Å), creating a mosaic with a total area covering 49 arcmin2. Three 1200s exposures were taken at each position, for each filter. Image analysis has been carried out using the IRAF package. The first step is to combine the images at each position to remove cosmic rays, using the ‘imcombine’ routine. Cosmic rays near a galaxy can also be removed via the ‘imedit’ task. A general sky-subtraction is accomplished by statistically computing the average sky value in an area void of galaxies, and subtracting that value from the entire image. VD98 have described large-scale diagonal bands in the background of some of the images, produced by light scattered off the Optical Telescope Assembly. We avoided attempting surface photometry for any galaxies which are located in an area whose background varies too greatly because of this effect.
We have located each of the galaxies in the two samples, using the x and y offset coordinates from the cluster center as given in Table 1 of F98.111We were able to identify the galaxies in the VD98 images only if we used for the cluster center RA=13h58m210 and Dec=624537, B1950, instead of the central coordinates given in F98. To construct the radial color profiles for each galaxy, the ‘ellipse’ routine in IRAF has been used. The ‘ellipse’ task fits azimuthally–averaged elliptical isophotes to a galaxy as a function of its semi–major axis. The ‘ellipse’ routine is run for each galaxy in both the F606W and F814W images. Combining the F606W and F814W magnitude profiles results in a radial color profile of the galaxy. A linear least squares fit is made to the F606W–F814W color (which can be transformed to V–I color, and which, at z 0.33, corresponds to a rest frame color between B–V and B–R) versus the logarithm of the semi–major axis.222Hereafter the logarithmic color gradient d(F606W–F814W)/dlogR is referred to as the color index CI. The zero-point of the scale is arbitrary, and error bars are included in the profiles, which includes both statistical errors (calculated for the magnitudes by ‘ellipse’ from the scatter in the intensity profile of the fit) and sky subtraction errors (we estimate a 1% error in the sky background), which become important at large radii.
The differing point spread function for the F606W and F814W images proves to be a problem for the inner 1.5 pixels. While we degraded the F814W frame to match the F606W frame, the color profile is not reliable within that radius, hence we only consider each profile outside of 1.5 pixels. For CL1358+62, excluding 1.5 pixels corresponds to losing the inner 0.66 kpc of each galaxy. Since K+A galaxies in nearby clusters are observed to have recent star formation typically extending through the central 2 kpc in radius (Caldwell et al. 1996; Caldwell, Rose, & Dendy 1999; Rose et al. 2001), we might expect a similar radius for such activity in the z 0.3 galaxies. Thus the inner cut-off, while producing a significant loss in the lever arm for measuring color gradients in the central regions, still allows for the detection of centralized star formation over the spatial scales expected from nearby examples. In addition, to keep a consistent comparison standard for the entire sample, the fit for each galaxy was restricted to a radius of 0.7 (7 pixels), which corresponds to roughly 3.1 kpc for CL1358+62. This limit was chosen because it is large enough to encompass a centralized burst of the kind seen in nearby K+A galaxies, but small enough so as not to include a significant amount of area in which the sky subtraction becomes overly important.
3 Results
Examples of color gradients for both the normal and K+A samples are shown in Figs. 2 and 3. As a check on our methods, we have qualitatively compared our results for 4 of the 6 galaxies (#109, 211, 420, & 562) whose radial color gradients are plotted in Fig. 12 of VD98, and find good agreement. The results of the least squares linear fit to the radial color gradient for the normal sample are given in Table 1, where the logarithmic color gradient in F606W–F814W is listed for each galaxy in column 9, along with the galaxy ID (col. 1), x–y coordinates in arcseconds from cluster center (cols. 2 and 3), apparent V magnitude and morphological classification, (cols. 4 and 5), and [OII]3727 line strength and average Balmer absorption strength H (cols. 6 and 7). The data in cols. 1–7 are taken from VD98 and F98; the rest-frame absolute B magnitudes are given in column 8. Table 2 shows similar information for the K+A sample.


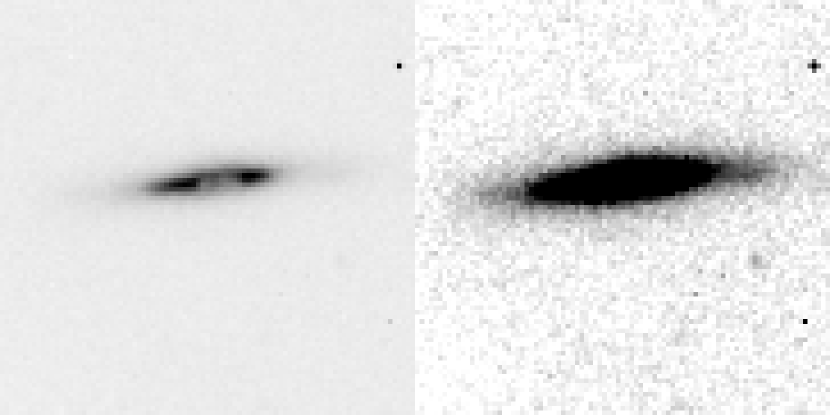

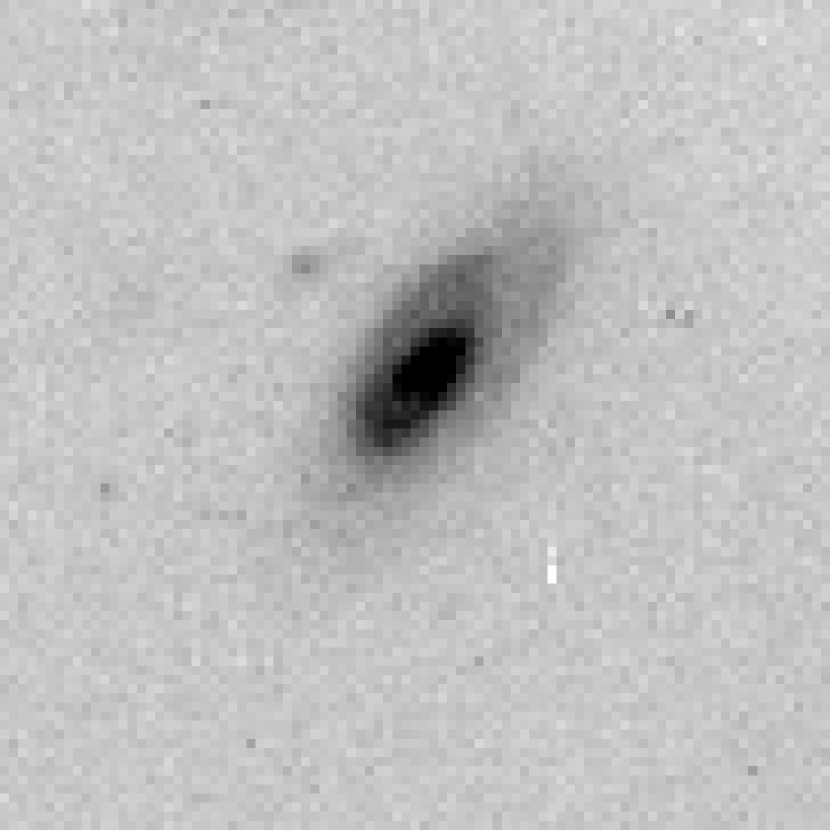
As stated earlier, most galaxies in the two samples have normal morphologies for early-type galaxies. With the exception of one galaxy classified as irregular (#290), and two assigned an S0 morphology (#200 & #507) (VD98), the galaxy morphologies are sufficiently regular that their radial profiles can be readily fit with the ‘ellipse’ routine. These three special cases (all in the K+A sample) have morphological peculiarities which would preclude a reliable fit with elliptical isophotes. Fig. 4 shows the radial color profile of galaxy #200, which is not well fit by a simple linear color gradient with radius. An image of this galaxy is shown in Fig. 5, and reveals serious morphological peculiarities. Galaxy #200 is evidently a nearly edge-on disk galaxy, which may cause a problem with the ellipse-fitting technique. In addition, when viewed at high contrast (see Fig. 5), strong deviations from a normal disk galaxy radial luminosity profile are evident. A second special case in our K+A sample, #507, has an extreme red nucleus and morphological irregularities. Despite the red nucleus, #507 does have relatively strong Balmer line strengths (and is classified in F98 as an E+A galaxy), but it is morphologically disturbed, in that it has a single asymmetric spiral feature, which produces problems for the ellipse-fitting technique. Similar morphological disturbances in cluster galaxies with strong Balmer lines have been found by Dressler et al. (1999). The radial color profile and image of #507 are shown in Figs. 6 and 7. Due to the morphological peculiarities of these two galaxies (as well as the irregular galaxy), the final statistical tests have been repeated first including, then excluding them, to ensure they are not contaminating the results.
To compare the color gradients of the K+A and normal samples, we have constructed histograms of the two samples, shown in Fig. 8. The histograms show the entire samples of galaxies, including the peculiar cases discussed specifically above. Our normal sample has an average slope of d(F606W–F814W)/dlogR –0.07 (where R is the semi-major axis in arcsec). For reference, Peletier et al. (1990) found that typical early-type galaxies have color gradients of d(B-R)/dlogR –0.1. This lends confidence to our results, since at the redshift of CL1358+62, the F606W band is close to the rest wavelength B band, and the F814W band is between rest wavelength V and R. The histogram for the K+A sample, excluding the specific cases discussed above, peaks at a more positive slope than the normal sample, at very nearly zero. Fig. 9 illustrates the scatter plot of Balmer line strength versus the color gradient. The K+A galaxies with Balmer line strengths between 3 and 4Å (that were not included in the E+A category of F98) lie in the middle of the gradient distribution, yet still displaced from the normal group. While the overall shift between K+A and normal galaxies is evident, no monotonic trend of Balmer line strength with color gradient is apparent, although above 6Å in equivalent width, all slopes are positive.


We applied a Kolmogorov–Smirnoff (K–S) two-sample test to find the probability that the two samples are drawn from the same parent distribution. The three galaxies with problematic morphologies were excluded from the statistical test. The result of the test of the distribution of color gradients within the two samples (compiled based on spectroscopic criteria) is that there is only a 2.5% probability that the samples are drawn from the same parent sample. To further test the result, we ran the K–S test, first including each of the previously excluded galaxies (#290, 200, & 507), and then including all three. The confidence levels ranged between 1.8–0.6%.
A potential complication can arise if the two samples have different distributions in apparent magnitude, and if there is a correlation between apparent magnitude and the radial color gradient. Using the apparent magnitudes listed in VD98 (transformed from the filters to the V band), we see that there is a difference in the mean apparent V magnitudes of the two samples, a fact that is illustrated in Fig. 10. In addition, we do find evidence for a trend in the apparent V magnitude with the radial color gradient. This trend is illustrated in Fig. 11, where the logarithmic color gradient is plotted versus apparent V magnitude for the normal galaxy data. To account for this systematic effect, a linear least squares fit was made to the data, and the gradients of both the normal galaxies and K+A galaxies were corrected to the same reference magnitude of V=21.1. These corrected color gradients, using the best fit slope of Fig. 11, are listed in column 10 of Tables 1 and 2. The linear fit, however, is quite uncertain, and the 1 slopes are also plotted on Fig. 11.
After correcting the observed radial color gradients in each galaxy to a single reference apparent magnitude, we ran the K–S test again on the K+A and normal galaxy samples, to evaluate whether the two samples still appear to be statistically different in their color gradient distributions. We find that the result of the K–S test, shown in Table 3, depends strongly on whether the maximum, best fit, or minimum slope from Fig. 11 is used. In col. 2 we used our raw color gradient data, and in cols. 3–5 we show the results after the correction for apparent magnitude, using the minimum, best fit, and maximum slopes shown in Fig. 11, respectively. Clearly, the magnitude of the correction is crucial to deciding whether the two samples are fundamentally different in their color gradient properties.
Since the observed trend between the color gradients and apparent V magnitude in CL1358+62 is quite uncertain, and since the amount of correction for apparent magnitude has an important effect on the interpretation of the results, we have investigated other studies of radial color gradients in galaxies. In particular, we have assessed the literature on nearby early-type galaxies, where the higher spatial resolution offers more reliable results. Absolute magnitude versus color gradient plots were constructed from the studies of Peletier et al. (1990), Vader et al. (1988), Jansen et al. (2000), and Balcells & Peletier (1994). Fig. 12 illustrates the data from Peletier et al. (1990) and Vader et al. (1988), where we have excluded the faint galaxies with .333The faintest galaxies in the Vader et al. (1988) sample, all Virgo cluster galaxies with , were found to have reverse color gradients. Recently, Concannon, Rose, & Caldwell (2000) have shown that these Virgo galaxies show a large variety of Balmer absorption line strengths, indicative of a large variation in age. All of the galaxies studied in CL1358+62 are brighter than , which can be seen in Fig. 11, where the vertical dashed lines show the locations of rest wavelength B = –21 and B = –19. Hence we excluded the faint galaxies from Vader et al. (1988) from Fig. 12. There is no observable trend in color gradient with absolute magnitude.
In summary, we have observed galaxy samples in the cluster CL1358+62, at z 0.33. For those galaxies with strong Balmer absorption lines, and little emission, the radial color profiles have less of a red slope towards the center than typical E/S0 galaxies, in that bluer colors are more likely to appear in the central regions. There is some uncertainty as to whether this effect can be due to a systematic trend of color gradient with apparent magnitude. However, given the uncertainty in the observed trend in CL1358+62, along with the fact that no such trend is observable among nearby galaxies, we conclude that the observed difference in the color gradients between normal and K+A galaxies in CL1358+62 is likely due to a real intrinsic difference in the two samples.
4 Discussion
There have been a number of studies investigating the issue of how star formation typically ends in cluster galaxies, e.g., whether through sudden truncation of normal star formation, or through a starburst. We briefly summarize these previous studies here, then place our new result within that context.
On the one hand, evidence exists that for many galaxies in rich clusters, rapid truncation of normal star formation is the principal evolutionary mechanism. For example, Balogh et al. (1997, 1998) concluded from a study of the equivalent widths of the [OII]3727 emission line in cluster and field galaxies, that star formation is suppressed in the cluster relative to the field, indicating that galaxies lose their gas through truncation of star formation, not through a starburst. In addition, there is abundant evidence that spiral galaxies in nearby clusters are on average globally depleted in HI when compared to their field counterparts (Solanes et al. 2001, and references therein) and that the sizes of the HI disks have been reduced (Cayatte et al. 1994). Ram pressure stripping is clearly the most plausible explanation for these observations. Furthermore, several studies have provided direct evidence for spirals in the process of losing gas due to ram pressure stripping, in that displaced HI envelopes and/or bow shock morphologies in truncated H disks are observed (Gavazzi et al. 1995; Kenney & Koopmann 1999; Bravo-Alfaro et al. 2000).
On the other hand, numerical simulations by Abadi, Moore, & Bower (1999) indicate that ram pressure stripping cannot be solely responsible for the observed rapid evolution of the star formation rate in cluster galaxies. In addition, while this mechanism does lead to stripping preferentially in the outer parts of a galaxy disk (which may explain the group of Virgo spirals found by Cayatte et al. 1994 to have centrally concentrated HI disks), even under the most favorable case of perpendicular infall the gas disk is not stripped down to within only 2 kpc of the nucleus (as indicated by the radial extent of observed blue nuclear regions in K+A galaxies). Furthermore, imaging of clusters out to z = 0.83 has revealed an enhanced level of tidally-interacting systems (Thompson 1988; Lavery & Henry 1988; Lavery, Pierce, & McClure 1992; Dressler et al. 1994; Couch et al. 1998; van Dokkum et al. 1999). Dressler et al. (1999) and Poggianti et al. (1999) have also seen evidence of tidal interactions in disk galaxies, and conclude that a burst of star formation is more likely in these cluster galaxies than a truncation of normal star formation. As well, studies of nearby clusters reveal examples of galaxies which have experienced centralized star formation episodes (Moss & Whittle 1993, 2000; Caldwell et al. 1996; Caldwell, Rose, & Dendy, 1999; Rose et al. 2001). In particular, most of the z 0.05 K+A galaxies studied to date show strong color gradients indicating blue central regions. Norton et al. (2001) have concluded, based on long-slit spectra of a sample of field E+A galaxies identified by Zabludoff et al. (1996), that the young stellar populations of these galaxies are more centrally concentrated than the old stellar populations. Furthermore, Zabludoff et al. (1996) found that many of their field E+A galaxies have peculiar or interacting morphologies, which they argue is due to galaxy-galaxy interactions. Also, Moss & Whittle (1993, 2000) find that early-type tidally-distorted spirals are often found with compact nuclear H emission, thus providing a direct link between tidal perturbation and centralized star formation. Consequently, centralized star formation, probably induced by tidal disturbances, appears to play an important role in cluster evolution as well.
In our study we have found evidence for systematically different radial color gradients between galaxies in CL1358+62 classified (on spectroscopic grounds) as K+A and those classified as having normal older populations. The difference is in the sense that bluer nuclei (relative to the surrounding area outside the central 2 kpc) prevail in the case of the K+A galaxies. We found this difference in spite of the fact that there could be some leakage between the two samples, due to the large error bars in the spectroscopic measurements, which would tend to blur the difference we find. The difference could be due to an apparent trend in the relationship between magnitude and color gradient, which greatly affects the statistical strength of our results. However, the absence of such an observed trend in nearby galaxies indicates that there is likely a real systematic difference between the two samples.

Our result is certainly compatible with a centralized episode of star formation that naturally occurs in various tidal interaction scenarios, ranging from equal-mass merger models (Mihos & Hernquist 1996) to galaxy “harrassment” (Moore et al. 1998) and tidal interaction between a galaxy and the strongly varying mean cluster tidal field (Bekki 1999). Because nearly all of the K+A galaxies are classified as S0’s, and thus probably still maintain a major disk structure, it is unlikely that equal mass mergers can be responsible, since they tend to destroy disks (Dressler et al. 1999; Poggianti et al. 1999). Thus one of the alternate tidal scenarios must predominate. The bluer nuclei of the K+A galaxies does not appear compatible with a sudden global quenching of star formation, since that mechanism would be expected to leave behind a red bulge surrounded by a gradually fading and reddening disk, e.g., at all times producing a logarithmic radial color gradient that is negative, such as is seen in early-type S0’s, e.g., NGC3115 (Silva et al. 1989). The only way to reconcile the sudden quenching scenario with our observed radial color profiles is to have the disk eaten away from the outside in, over a considerable period of time. In summary, while the high X-ray luminosity of CL1358+62 indicates that ram pressure stripping must play an important role in the evolution of its member galaxies, tidal interaction may be playing a key role as well.
References
- (1)
- (2) Abadi, M. G., Moore, B., & Bower, R. G. 1999, MNRAS, 308, 947
- (3)
- (4) Balcells, M., & Peletier, R. F. 1994, AJ, 107, 135
- (5)
- (6) Balogh, M. L., Morris, S. L., Yee, H. K. C., Carlberg, R. G., & Ellingson, E. 1997, ApJ, 488, L75
- (7)
- (8) Balogh, M. L., Schade, D., Morris, S. L., Yee, H. K. C., Carlberg, R. G., & Ellingson, E. 1998, ApJ, 504, L75
- (9)
- (10) Balogh, M. L., Morris, S. L., Yee, H. K. C., Carlberg, R. G., & Ellingson, E. 1999, ApJ, 527, 54
- (11)
- (12) Barger, A. J., Aragón-Salamanca, A., Ellis, R. S., Couch, W. J., Smail, I., & Sharples, R. M. 1996, MNRAS, 279, 1
- (13)
- (14) Bekki, K. 1999, ApJ, 510, L15
- (15)
- (16) Bravo-Alfaro, H., Cayatte, V., van Gorkom, J. H., & Balkowski, C. 2000, AJ, 119, 580
- (17)
- (18) Butcher, H., & Oemler, A., Jr. 1978, ApJ, 226, 559
- (19)
- (20) Butcher, H., & Oemler, A., Jr. 1984, ApJ, 285, 426
- (21)
- (22) Caldwell, N., Rose, J. A., & Dendy, K. 1999, AJ, 117, 140
- (23)
- (24) Caldwell, N., Rose, J. A., Franx, M., & Leonardi, A. 1996, AJ, 111, 78
- (25)
- (26) Cayatte, V., Kotanyi, C., Balkowski, C., & van Gorkum, J. H. 1994, AJ, 107, 1003
- (27)
- (28) Concannon, K. D., Rose, J. A., & Caldwell, N. 2000, ApJ, 536, L19
- (29)
- (30) Couch, W. J., & Sharples, R. M. 1987, MNRAS, 229, 423
- (31)
- (32) Couch, W. J., Barger, A. J., Smail, I., Ellis, R. S., & Sharples, R. M. 1998, ApJ, 497, 188
- (33)
- (34) Dressler, A., & Gunn, J. E. 1983, ApJ, 270, 7
- (35)
- (36) Dressler, A., Oemler, A., Jr., Sparks, W. B., & Lucas, R. A. 1994, ApJ, 435, L23
- (37)
- (38) Dressler, A., Oemler, A., Jr., Couch, W. J., Smail, I., Ellis, R. S., Barger, A., Butcher, H., Poggianti, B. M., & Sharples, R. M. 1997. ApJ, 490, 577
- (39)
- (40) Dressler, A., Smail, I., Poggianti, B. M., Butcher, H., Couch, W. J., Ellis, R. S., & Oemler, A., Jr. 1999, ApJS, 122, 51
- (41)
- (42) Fabricant, D. G., McClintock, J. E., & Bautz, M. W. 1991, ApJ, 381, 33
- (43)
- (44) Fasano, G., Poggianti, B. M., Couch, W. J., Bettoni, D., Kjrgaard, P., & Moles, M. 2000, ApJ, 542, 673
- (45)
- (46) Fisher, D., Fabricant, D., Franx, M., & van Dokkum, P. 1998, ApJ, 498, 195
- (47)
- (48) Franx, M. 1993, ApJ, 407, L5
- (49)
- (50) Gavazzi, G., Contursi, A., Carrasco, L., Boselli, A., Kennicutt, R., Scodeggio, M., & Jaffe, W. 1995, A&A, 304, 325
- (51)
- (52) Gunn, J. E., & Gott, J. R. 1972, ApJ, 176, 1
- (53)
- (54) Jansen, R. A., Franx, M., Fabricant, D., & Caldwell, N. 2000, ApJS, 126, 271
- (55)
- (56) Kenney, J. D. P., & Koopmann, R. A. 1999, AJ, 117, 181
- (57)
- (58) Lavery, R. J., & Henry, J. P. 1988, ApJ, 330, 596
- (59)
- (60) Lavery, R. J., Pierce, M. J., & McClure, R. D. 1992, AJ, 104, 2067
- (61)
- (62) Mihos, J. C., & Hernquist, L. 1996, ApJ, 464, 641
- (63)
- (64) Moore, B., Katz, N., Lake, G., Dressler, A., & Oemler, A., Jr. 1996, Nature, 379, 613
- (65)
- (66) Moore, B., Lake, G., & Katz, N. 1998, ApJ, 495, 139
- (67)
- (68) Moss, C., & Whittle, M. 1993, ApJ, 407, L17
- (69)
- (70) Moss, C., & Whittle, M. 2000, MNRAS, 317, 667
- (71)
- (72) Newberry, M. V., Boroson, T. A., & Kirshner, R. P. 1990, ApJ, 350, 585
- (73)
- (74) Norton, S. A., Gebhardt, K., Zabludoff, A. I., & Zaritsky, D. ApJ, 557, 150
- (75)
- (76) Peletier, R. F., Davies, R. L., Illingworth, G. D., Davis, L. E., & Cawson, M. 1990, AJ, 100, 1091
- (77)
- (78) Poggianti, B. M., Smail, I., Dressler, A., Couch, W. J., Barger, A., Butcher, H., Ellis, R. S., & Oemler, A., Jr. 1999, ApJ, 518, 576
- (79)
- (80) Rose, J. A., Gaba, A. E., Caldwell, N., & Chaboyer, B. 2001, AJ, 121, 793
- (81)
- (82) Silva, D. R., Boroson, T. A., Thompson, I. B., & Jedrzejewski, R. I. 1989, AJ, 98, 131
- (83)
- (84) Solanes, J. M., Manrique, A., Garcia-Gomez, C., Gonzalez-Casado, G., Giovanelli, R., & Haynes, M. P. 2001, ApJ, 548, 97
- (85)
- (86) Thompson, L. 1988, ApJ, 324, 112
- (87)
- (88) Vader, J. P., Vigroux, L., Lachièze-Rey, M., & Souviron, J. 1988, A&A, 203, 217
- (89)
- (90) van Dokkum, P. G., Franx, M., Kelson, D. D., Illingworth, G. D., Fisher, D., & Fabricant, D. 1998, ApJ, 500, 714
- (91)
- (92) van Dokkum, P. G., Franx, M., Fabricant, D., Kelson, D. D., Illingworth, G. D. 1999, ApJ, 520, L95
- (93)
- (94) Zabludoff, A. I., Zaritsky, D., Lin, H., Tucker, D., Hashimoto, Y., Shectman, S. A., Oemler, A., & Kirshner, R. P. 1996, ApJ, 466, 104
- (95)
| Gal# | x | y | V | Type | [OII]3727 | H | **Rest–frame absolute B magnitudes. | CI††Radial color gradients in d(F606W–F814W)/dlogR, where R is the semi-major axis in arcsec. | [CI]c‡‡Radial color gradients corrected to a standard reference magnitude (using the best fit slope of Fig. 11 of 0.027). |
|---|---|---|---|---|---|---|---|---|---|
| () | () | (Å) | (Å) | ||||||
| 108 | 131.10 | 224.99 | 20.58 | E | 1.7 | 0.8 | 20.45 | 0.010 | 0.004 |
| 126 | 67.93 | 208.17 | 20.01 | S0 | 2.1 | 0.7 | 21.02 | 0.011 | 0.040 |
| 129 | 127.68 | 201.66 | 19.96 | S0 | 3.9 | 1.2 | 21.07 | 0.103 | 0.072 |
| 142 | 50.94 | 191.34 | 20.26 | S0 | 1.0 | 1.1 | 20.77 | 0.014 | 0.009 |
| 164 | 105.06 | 172.23 | 19.88 | S0 | 0.9 | 0.4 | 21.15 | 0.078 | 0.045 |
| 182 | 177.65 | 152.25 | 20.97 | S0 | 0.7 | 0.9 | 20.06 | 0.018 | 0.022 |
| 215 | 28.54 | 127.40 | 20.78 | S0 | 0.7 | 1.4 | 20.25 | 0.005 | 0.004 |
| 233 | 164.92 | 114.30 | 19.47 | E | 1.4 | 0.9 | 21.56 | 0.043 | 0.001 |
| 235 | 46.46 | 111.33 | 21.60 | ? | 1.3 | 1.4 | 19.43 | 0.053 | 0.067 |
| 236 | 37.20 | 110.38 | 20.16 | S0 | 4.6 | 1.4 | 20.87 | 0.113 | 0.088 |
| 239 | 26.80 | 103.88 | 20.67 | E | 3.7 | 1.2 | 20.36 | 0.078 | 0.066 |
| 242 | 8.55 | 101.16 | 19.81 | E | 5.0 | 0.8 | 21.22 | 0.095 | 0.060 |
| 248 | 59.75 | 96.18 | 20.20 | E | 2.5 | 0.0 | 20.83 | 0.033 | 0.009 |
| 254 | 63.46 | 91.22 | 19.91 | E | 1.9 | 0.4 | 21.12 | 0.055 | 0.023 |
| 269 | 16.73 | 76.88 | 19.12 | E | 0.7 | 1.0 | 21.91 | 0.093 | 0.040 |
| 278 | 19.71 | 73.64 | 20.66 | S0 | 2.3 | 0.4 | 20.37 | 0.082 | 0.070 |
| 288 | 75.07 | 68.20 | 20.75 | S0 | 0.2 | 0.1 | 20.28 | 0.008 | 0.017 |
| 298 | 19.71 | 58.77 | 19.44 | S0 | 0.7 | 0.3 | 21.59 | 0.039 | 0.006 |
| 299 | 45.12 | 54.61 | 21.45 | E | 4.4 | 1.0 | 19.58 | 0.143 | 0.152 |
| 303 | 88.96 | 53.79 | 20.03 | E | 0.0 | 0.7 | 21.00 | 0.011 | 0.040 |
| 347 | 51.92 | 22.89 | 20.14 | E | 1.0 | 1.1 | 20.89 | 0.035 | 0.009 |
| 353 | 7.80 | 17.57 | 19.41 | E | 0.7 | 1.0 | 21.62 | 0.042 | 0.004 |
| 371 | 87.25 | 2.90 | 19.67 | S0 | 2.1 | 0.3 | 21.36 | 0.135 | 0.096 |
| 394 | 110.45 | 20.22 | 21.33 | S0 | 2.4 | 1.3 | 19.70 | 0.072 | 0.066 |
| 408 | 5.33 | 25.92 | 20.21 | S0 | 0.2 | 0.6 | 20.82 | 0.017 | 0.007 |
| 416 | 2.95 | 33.74 | 21.44 | E | 4.5 | 1.0 | 19.59 | 0.126 | 0.135 |
| 421 | 32.31 | 37.35 | 20.75 | E | 1.6 | 0.6 | 20.28 | 0.063 | 0.054 |
| 434 | 1.34 | 45.48 | 21.59 | ? | 2.1 | 0.4 | 19.44 | 0.132 | 0.145 |
| 444 | 154.20 | 56.42 | 20.23 | E | 1.5 | 1.4 | 20.80 | 0.212 | 0.189 |
| 460 | 51.45 | 70.69 | 21.44 | S0 | 1.2 | 1.0 | 19.59 | 0.082 | 0.091 |
| 468 | 171.80 | 83.16 | 20.36 | S0 | 0.9 | 0.9 | 20.67 | 0.009 | 0.011 |
| 470 | 131.21 | 84.61 | 19.57 | E | 0.8 | 1.0 | 21.46 | 0.122 | 0.081 |
| 523 | 37.47 | 126.64 | 20.23 | S0 | 1.0 | 0.9 | 20.80 | 0.299 | 0.276 |
| 536 | 17.01 | 144.87 | 19.39 | E | 1.1 | 0.8 | 21.64 | 0.043 | 0.003 |
| 537 | 31.69 | 145.16 | 20.63 | E | 0.2 | 0.8 | 20.40 | 0.193 | 0.180 |
| 542 | 4.28 | 150.03 | 20.18 | E | 1.2 | 1.2 | 20.85 | 0.121 | 0.096 |
| 544 | 195.75 | 151.37 | 20.42 | S0 | 1.4 | 0.8 | 20.61 | 0.050 | 0.032 |
| 554 | 252.31 | 160.29 | 19.94 | E | 0.3 | 0.9 | 21.09 | 0.049 | 0.018 |
| 560 | 21.67 | 170.53 | 20.41 | E/S0 | 1.2 | 1.5 | 20.62 | 0.010 | 0.029 |
| 572 | 198.72 | 181.74 | 20.29 | ? | 3.1 | 1.2 | 20.74 | 0.142 | 0.120 |
| 584 | 54.21 | 201.30 | 21.41 | ? | 2.2 | 0.6 | 19.62 | 0.453 | 0.461 |
| 626 | 56.50 | 255.17 | 20.32 | S0 | 2.0 | 1.2 | 20.71 | 0.089 | 0.068 |
| 1328 | 192.34 | 159.57 | 21.77 | E | 1.9 | 1.4 | 19.26 | 0.044 | 0.062 |
| 1524 | 82.16 | 39.65 | 21.91 | S0 | 0.6 | 1.0 | 19.12 | 0.007 | 0.015 |
| 1842 | 14.42 | 133.77 | 22.27 | S0 | 4.2 | 0.5 | 18.76 | 0.130 | 0.098 |
| 1865 | 111.08 | 146.35 | 21.58 | ? | 5.0 | 0.3 | 19.45 | 0.059 | 0.046 |
| Gal# | x | y | V | Type | [OII]3727 | H | **Rest–frame absolute B magnitudes. | CI††Radial color gradients in d(F606W–F814W)/dlogR, where R is the semi-major axis in arcsec. | [CI]c‡‡Radial color gradients corrected to a standard reference magnitude (using the best fit slope of Fig. 11 of 0.027). |
|---|---|---|---|---|---|---|---|---|---|
| () | () | (Å) | (Å) | ||||||
| 92 | 137.23 | 237.13 | 20.75 | S0 | 0.0 | 3.5 | 20.28 | 0.040 | 0.031 |
| 109 | 73.68 | 222.07 | 21.32 | S0 | 0.1 | 7.0 | 19.71 | 0.024 | 0.018 |
| 167 | 89.31 | 168.19 | 21.55 | S0 | 3.6 | 7.6 | 19.48 | 0.010 | 0.002 |
| 200 | 12.63 | 138.44 | 20.02 | S0 | 4.0 | 3.4 | 21.01 | 0.817 | 0.846 |
| 206 | 165.28 | 135.64 | 21.43 | ? | 7.5 | 3.8 | 19.60 | 0.114 | 0.123 |
| 209 | 29.25 | 130.76 | 20.09 | S0 | 0.8 | 6.0 | 20.94 | 0.015 | 0.042 |
| 226 | 208.35 | 120.30 | 21.31 | ? | 0.8 | 3.7 | 19.72 | 0.110 | 0.104 |
| 243 | 13.78 | 99.71 | 21.59 | S0 | 2.1 | 9.1 | 19.44 | 0.075 | 0.062 |
| 246 | 78.11 | 96.07 | 20.97 | S0 | 3.4 | 3.3 | 20.06 | 0.004 | 0.008 |
| 290 | 15.96 | 65.50 | 21.16 | Irr | 6.9 | 3.0 | 19.87 | 0.127 | 0.125 |
| 311 | 2.50 | 45.45 | 21.32 | S0 | 5.8 | 4.2 | 19.71 | 0.181 | 0.187 |
| 328 | 4.03 | 36.82 | 20.11 | S0 | 1.0 | 5.9 | 20.92 | 0.256 | 0.202 |
| 343 | 64.33 | 25.27 | 20.80 | S0 | 1.0 | 6.2 | 20.23 | 0.040 | 0.048 |
| 344 | 38.25 | 24.87 | 20.87 | S0 | 1.3 | 3.3 | 20.16 | 0.049 | 0.055 |
| 346 | 8.17 | 23.07 | 19.87 | S0 | 0.8 | 3.0 | 21.16 | 0.131 | 0.098 |
| 354 | 3.73 | 16.28 | 21.11 | E | 4.9 | 3.2 | 19.92 | 0.063 | 0.063 |
| 406 | 121.17 | 24.15 | 21.90 | ? | 1.9 | 3.1 | 19.13 | 0.017 | 0.005 |
| 420 | 18.87 | 36.69 | 22.14 | S0 | 1.0 | 4.9 | 18.89 | 0.153 | 0.125 |
| 493 | 11.71 | 98.91 | 21.70 | ? | 1.2 | 3.3 | 19.33 | 0.036 | 0.052 |
| 507 | 181.26 | 112.42 | 20.52 | S0 | 1.7 | 4.5 | 20.51 | 0.338 | 0.322 |
| 562 | 57.01 | 175.13 | 21.11 | E | 0.6 | 4.8 | 19.92 | 0.341 | 0.341 |
| 565 | 140.21 | 177.65 | 21.86 | E | 2.5 | 4.9 | 19.17 | 0.098 | 0.119 |
| 594 | 169.55 | 213.66 | 21.90 | ? | 9.4 | 6.1 | 19.13 | 0.021 | 0.001 |
| 1775 | 116.86 | 97.78 | 21.74 | S0 | 0.1 | 3.7 | 19.29 | 0.044 | 0.061 |
| Sample | Raw | Min slope | Best Fit slope | Max slope |
|---|---|---|---|---|
| Entire Sample | 0.9% | 1.0% | 9.7% | 14.6% |
| Excluding #200 | 1.8% | 1.8% | 17.3% | 24.8% |
| Excluding #290 | 1.8% | 1.8% | 17.3% | 24.8% |
| Excluding #507 | 0.6% | 0.6% | 7.7% | 11.7% |
| Excluding all 3 | 2.5% | 2.1% | 25.1% | 34.6% |