Keck Spectroscopy and HST Imaging of GRB 000926: Probing a Host Galaxy at
Abstract
We present early-time Keck spectroscopic observations and late-time Hubble Space Telescope (HST) imaging of GRB 000926. The HST images show a small offset between the optical transient and the compact host galaxy. Combined with the large equivalent widths measured for metallic absorption lines by the Keck Echellette Spectrograph and Imager (ESI) and the Low-Resolution Imaging Spectrometer (LRIS), this indicates that the GRB exploded near the center of its host. The ESI spectroscopy reveals two absorption systems centered at with a velocity separation of 168 km s-1, which we interpret as being due to individual clouds in the host galaxy. The ratios of chromium to zinc equivalent widths indicates the host is depleted in dust relative to local values to a similar degree as damped Lyman alpha systems at the same redshift. Further, the two clouds appear to have similar relative metal abundance and dust to gas ratio. If one cloud is associated with the GRB site, this implies the explosion did not significantly alter the surrounding environment.
1 Introduction
Observational evidence indicates that gamma-ray bursts explode in luminous regions of galaxies, suggesting the progenitors of these events are a population associated with galactic disks, and may descend from massive stars. Hubble Space Telescope (HST) imaging reveals that GRB optical transients have smaller offsets relative to the centers of their host galaxies than would be expected for a halo population (Bloom et al., 2001). A few events have exhibited large optical extinctions, such that they are visible only at X-ray, IR and radio wavelengths (Groot et al., 1997; Taylor et al., 1998; Djorgovski et al., 2001). This indicates these exploded in or behind dense regions of the host galaxy. The large equivalent widths of metallic absorption lines seen in optical spectra of optical transients also point to a location within the host disk.
As a disk population, a typical line of sight towards a GRB will intersect a significant column of the galactic insterstellar medium. Intermediate and high-resolution absorption spectroscopy can therefore be used to probe the metal content of the host, as well as individual structures, if they are separated by sufficient doppler shifts. Ratios of metal lines can also be used to probe the dust content. For example, the Zn II (2025, 2062) doublet is a good indicator of metallicity, as it has near-solar abundance in gas with little depletion onto interstellar grains (Pettini et al., 1990). Cr, on the other hand, exists mostly in interstellar grains, and is among the most heavily depleted elements in the gas phase of the ISM. Measuring both the Zn II doublet as well as the Cr II triplet (2055, 2061, 2065) therefore provides a qualitative measure of the dust to gas ratio (Pettini et al., 1990, 1994).
Comparing chemical composition and dust content in a sample of GRB host galaxies to, for example, damped Ly systems at similar redshift would indicate whether GRBs occur in regions with unusual metal enrichment. Since it is unclear what factors, other than mass, play a role in determining which stellar progenitors produce GRBs, this could provide direct clues to the explosion. It is also interesting to look for anomalously low dust to gas ratios. Waxman & Draine (2000) and Fruchter et al. (2001) have theorized that the early, hard radiation from the GRB and its afterglow should destroy dust in the circumburst environment. The destruction of dust grains would release metals, and increase the relative equivalent widths of those elements preferentially condensed on dust grains.
In this paper, we present early-time spectroscopic observations with the W.M. Keck of the afterglow of GRB 000926 using the Echellette Spectrograph and Imager (ESI) and the Low-Resolution Imaging Spectrometer (LRIS), combined with imaging of the host galaxy by HST.
1.1 GRB 000926
The Inter-Planetary Network (Ulysses, Konus-Wind, and Near) detected the long-duration ( s) event GRB 000926 on 2000 Sep 26.993 UT (Hurley et al., 2000). Gorosabel et al. (2000) and Dall et al. (2000) identified the afterglow. The discovery and optical lightcurves are presented in Fynbo et al. (2001a). Spectra of the afterglow from the Nordic Optical Telescope yielded an absorption redshift of 2.066 (Fynbo et al., 2000), later refined to 2.0379 0.0008 from Keck spectroscopy (Castro et al., 2000).
Ground-based multi color lightcurves of the afterglow show a steepening beginning 1.2 days after the event (Price et al., 2001), providing evidence that the ejecta are collimated into a jet. The gamma-ray energy release, corrected for the implied collimation, is erg. A fit of the data to an afterglow model requires modest extinction in excess of the Galactic value along the line of sight (AV in the range 0.11 – 0.82 mag; see Price et al. (2001)), presumably due to the host galaxy. Synthesis of the broad-band data set resulting from Chandra X-ray observations, continued optical monitoring by HST and Very Large Array radio observations reveal evidence that the cooling is dominated by Inverse Compton scattering, with the IC component directly observable (Harrison et al., 2001). This implies that the GRB exploded in a moderately dense, cm-3 medium, consistent with a diffuse interstellar cloud environment.
2 Observations
2.1 Moderate Resolution Spectroscopy
Starting at about UT 2000 September 29.26 L. Cowie obtained two spectra, each of 1800-s duration, using ESI (Epps & Miller, 1998) in the Echelle mode. In this mode, the spectrum covers the range 3900 to 10900 over ten orders. The native spectral resolution of the instrument is 11.4 km s-1 pixel-1. The two spectra were obtained at an airmass of about 1.33 and position angle of 128∘, about 15∘ from the parallactic angle.
We employed two procedures for data reduction; one using standard IRAF packages and the other using the Mauna Kea Echelle Extraction - MAKEE program (written by T. Barlow). The two reductions agreed to within statistical errors. We reduced the echelle orders using a bright star to trace each individual order prior to extraction. Each exposure was optimally extracted and background subtracted. We identified lines in CuAr lamp spectra, individually extracted using the object’s apertures, and determined the wavelength scale by polynomial fitting the line positions using a mean r.m.s. of 0.09 . The two spectra were then added to yield the final spectrum.

2.2 Low Resolution Spectroscopy
Low resolution spectra of the GRB 000926 afterglow were obtained using the Low Resolution Imaging Spectrometer (LRIS) (Oke et al., 1995) on the Keck I telescope. R. Ellis obtained two exposures of 900 seconds each on UT 2000 September 29 using the slit with the 600 grating that provides a resolution of 1,000. The two exposures were taken at slightly different positions on the slit. Data reduction followed similar procedures to those employed for ESI. The two images were then subtracted from each other so as to yield a sky-subtracted image. We used a NeAr+Hg,K arc lamp to wavelength calibrate the data.
2.3 HST Imaging
As part of an HST cycle 9 program we observed GRB 000926 at five epochs with the Wide Field Planetary Camera 2 (WFPC2). We reported results from the first four epochs, taken between UT Oct 7.25 2000 and UT Dec 16.9 2000, in Harrison et al. (2001). In these early epochs emission from the OT made a significant contribution to the total measured flux from the GRB position. We observed at a fifth epoch, UT May 19.63 – 20.86 2001, in the F450W, F606W, and F814W WFPC2 filters, and we present these results along with a comparision to previous epochs here.
HST was pointed such that the optical transient falls on WFPC CCD#3 at the WFALL position. The 2200 seconds (1 orbit each) F450W images were combined using the STSDAS task crrej. The F606W and F814W images were observed at two offsets, by +2.5, +2.5 pixels in x and y. These images were combined and cosmic-ray rejected using the drizzle technique (Fruchter & Hook, 1997). The drizzled images have pixels half the area of the original WFPC data.
3 Metallic line absorption


Fynbo et al. (2000) found, based on low resolution spectra, that the optical afterglow of GRB 000926 had two significant absorption systems: one at 1.378 and a second at 2.066. However, our higher resolution spectra show only one system, split into two components, identified by the lines listed in Table 1. The mean redshift obtained from these lines is (LRIS) and (ESI), presumably corresponding to the system identified by Fynbo et al. as having 2.066. We do not see any evidence of another absorption system in these spectra.
| line | () | zabs | Wλ,rest () |
|---|---|---|---|
| Si IV 1393.76 | 4233.25 [1] | 2.03729 | 1.47 0.15 (0.06) |
| Si IV 1393.76 | 4236.27 [2] | 2.03945 | 0.66 0.07 (0.06) |
| Si II 1526.72 | 4635.80 [1] | 2.03644 | 1.41 0.14 (0.02) |
| Si II 1526.72 | 4639.62 [2] | 2.03895 | 1.23 0.12 (0.02) |
| C IV 1548.20 | 4701.93 [1] | 2.03703 | 2.00 0.20 (0.02) |
| C IV 1548.20 | 4704.73 [2] | 2.03884 | 0.60 0.06 (0.02) |
| C IV 1550.77 | 4710.86 [1] | 2.03775 | 2.24 0.22 (0.02) |
| C IV 1550.77 | 4712.63 [2] | 2.03890 | 0.22 0.02 (0.02) |
| Fe II 1608.46 | 4883.82 [1] | 2.03633 | 0.63 0.06 (0.02) |
| Fe II 1608.46 | 4887.86 [2] | 2.03884 | 1.52 0.15 (0.02) |
| Al II 1670.81 | 5073.30 [1] | 2.03643 | 1.41 0.14 (0.02) |
| Al II 1670.81 | 5077.65 [2] | 2.03903 | 1.12 0.11 (0.02) |
| Si II 1808.00 | 5491.10 [1] | 2.03711 | 0.36 0.04 (0.01) |
| Si II 1808.00 | 5494.10 [2] | 2.03877 | 0.77 0.08 (0.01) |
| Al III 1854.72 | 5633.78 [1] | 2.03754 | 1.46 0.15 (0.01) |
| Al III 1854.72 | 5635.83 [2] | 2.03864 | 0.11 0.01 (0.01) |
| Al III 1862.78 | 5657.75 [1] | 2.03726 | 0.81 0.08 (0.01) |
| Al III 1862.78 | 5660.42 [2] | 2.03869 | 0.46 0.05 (0.01) |
| Zn II 2026.14 | 6154.26 [1] | 2.03741 | 0.34 0.03 (0.01) |
| Zn II 2026.14 | 6156.84 [2] | 2.03870 | 0.56 0.06 (0.01) |
| Cr II 2056.25 | 6245.46 [1] | 2.03730 | 0.33 0.03 (0.01) |
| Cr II 2056.25 | 6248.23 [2] | 2.03865 | 0.36 0.04 (0.01) |
| Cr II 2062.23 | 6267.67 [b] | 2.03927 | 0.23 0.02 (0.00) |
| Zn II 2062.66 | 6268.12 [b] | 2.03885 | 0.05 0.00 (0.00) |
| Cr II 2066.16 | 6278.52 [b] | 2.03874 | 0.18 Wλ,rest 0.09 |
| Fe II 2344.21 | 7119.02 [1] | 2.03685 | 1.77 0.18 (0.02) |
| Fe II 2344.21 | 7123.84 [2] | 2.03891 | 1.64 0.16 (0.02) |
| Fe II 2374.46 | 7211.09 [1] | 2.03694 | 1.75 0.18 (0.01) |
| Fe II 2374.46 | 7215.46 [2] | 2.03878 | 0.82 0.08 (0.01) |
| Fe II 2382.76 | 7236.64 [b] | 2.03708 | 3.07 0.31 (0.02) |
| Fe II 2600.18 | 7896.06 [1] | 2.03673 | 1.96 0.20 (0.02) |
| Fe II 2600.18 | 7902.28 [2] | 2.03913 | 1.69 0.17 (0.02) |
| Mg II 2796.35 | 8490.52 [1] | 2.03629 | 2.97 0.30 (0.03) |
| Mg II 2796.35 | 8498.62 [2] | 2.03918 | 2.38 0.24 (0.03) |
| Mg II 2803.53 | 8511.47 [1] | 2.03598 | 2.77 0.28 (0.02) |
| Mg II 2803.53 | 8519.58 [2] | 2.03887 | 2.64 0.26 (0.02) |
| Mg I 2852.97 | 8665.87 [1] | 2.03749 | 1.99 0.20 (0.02) |
| Mg I 2852.97 | 8669.25 [2] | 2.03868 | 0.44 0.04 (0.02) |
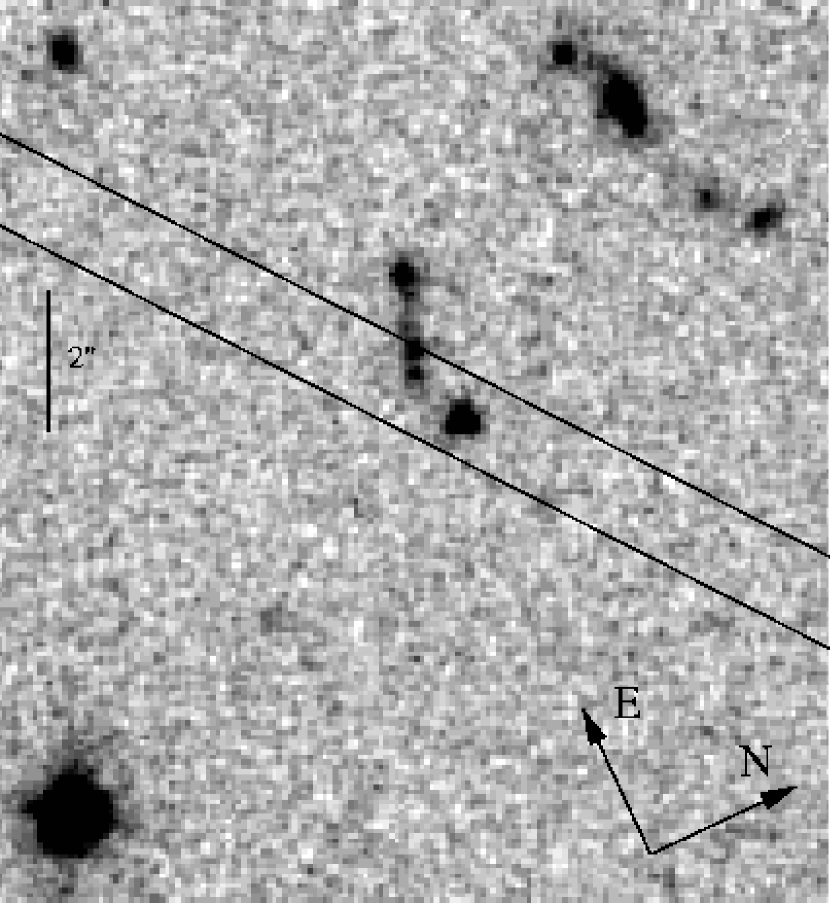
Figure 1 shows the ESI spectrum smoothed by a boxcar of 7 pixels, equivalent to 1.12 . The absorption lines show evidence for two components with a mean separation of 4.05 (seen in Figure 2 and 3). Figure 4 shows the LRIS spectrum smoothed by 3.8 . Table 1 shows the line identifications from ESI for each of the two components, the corresponding redshift and the measured restframe equivalent widths (EWs) . Whenever it is not possible to separate the components, we list the equivalent width of the blended line. Table 2 shows the identifications from the LRIS spectrum, where the absorption lines from the two systems are all blended due to the lesser resolving power. The errors listed in the table are the total systematic plus statistical uncertainties, and are dominated by the uncertainty in the placement of the continuum. The statistical errors are also provided in parentheses. We assumed Voigt profiles for all the measured lines. We normalized the spectra with the continuum set to unity. The derived redshifts of the two components are and , with a mean of . Figure 7 shows the approximate position and orientation of the ESI slit in an HST WFPC2 F606W image of the field. Contaminating flux from the underlying GRB host galaxy, which would cause the equivalent widths to be underestimated, is negligible in our spectroscopic observations (see below).
| line | () | zabs | Wλ,rest () |
|---|---|---|---|
| Si IV 1393.76 | 4232.52 | 2.03676 | 2.46 0.25 (0.03) |
| Si II 1526.72 | 4638.35 | 2.03811 | 3.31 0.33 (0.01) |
| C IV 1548.20 | 4702.54 | 2.03742 | 1.88 0.19 (0.02) |
| C IV 1550.77 | 4711.15 | 2.03794 | 1.91 0.19 (0.02) |
| Fe II 1608.46 | 4886.10 | 2.03775 | 2.57 0.26 (0.01) |
| Al II 1670.81 | 5075.81 | 2.03613 | 2.47 0.25 (0.03) |
| Si II 1808.00 | 5491.96 | 2.03759 | 1.39 0.14 (0.02) |
| Al III 1854.72 | 5633.60 | 2.03744 | 2.06 0.21 (0.02) |
| Al III 1862.78 | 5655.15 | 2.03586 | 1.95 0.19 (0.01) |
| Zn II 2026.14 | 6155.67 | 2.03813 | 1.20 0.12 (0.01) |
A comparison of the equivalent widths measured from the LRIS spectrum with those from the ESI spectrum (summing the two components) shows generally good agreement, apart from a small tendency for larger equivalent widths in the LRIS spectrum. This can be understood as the effect of not being able to resolve the two systems in the lower resolution LRIS data. The ESI measurements are therefore more accurate.
4 The GRB 000926 Host Galaxy and Offset


In the final epoch HST images the flux from the region is due entirely to the host galaxy. Figure 5 shows the WFPC2 F606W image from UT May 19.72 (238 days after the GRB). Table 3 provides the magnitude of the emission extracted from a 0.2′′ radius region surrounding the position of the optical transient. These magnitudes are aperture corrected to 0.5′′ to match published calibrations (Holtzman et al., 1995). We then calibrated the WFPC2 data using the zeropoints from Holtzman et al. (1995) (Table 10 page 1086). Table 3 shows the resulting SMAGs. We then transformed to the Johnson Cousins system using published color transformations (see Table 10 from Holtzman et al. 1995). The transformed magnitudes are provided in Table 4. We note that the quoted errors are statistical only.
| epoch | filter | (s) | mag |
|---|---|---|---|
| 19.63 | F450W | 2200 | |
| 19.72 | F606W | 4400 | |
| 19.86 | F814W | 4400 |
| band | mag (2 pix) | mag (5 pix) |
|---|---|---|
| B | ||
| V | ||
| R | ||
| I |
To determine the extent of the knot of emission underlying the optical transient we compared the radial profile to that of a standard star. Figure 6 shows the flux extracted in increasing apertures for the host emission (diamonds) compared to the reference star. The scale is normalized to unity for a 1′′ radius aperture. The emission is clearly extended compared to the instrument point spread function.
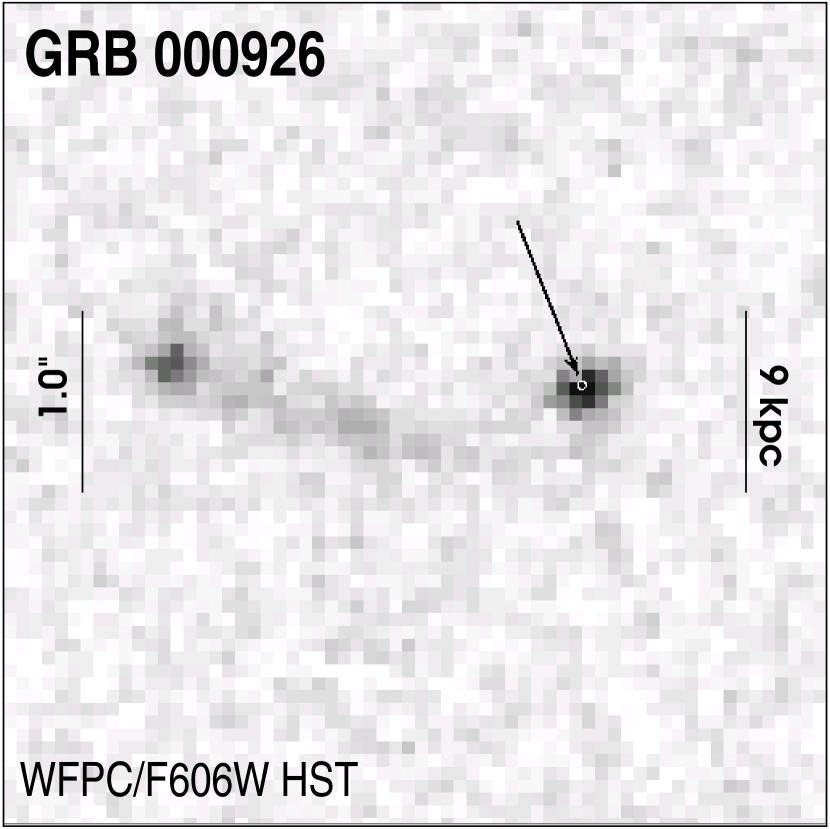
To determine the precise location of the OT in the bright knot of emission (which we take to be the host galaxy), we compared the OT centroid taken from the first epoch HST WFPC F606W image (when the OT emission was dominant; see Figure 8) and compared it to the centroid of the knot seen in the late-epoch image. To register the first-epoch to the final image, we drizzled both images independently increasing the drizzled pixel size by a factor of 2 in area (PIXFRAC = 0.8). We then registered the final stacked images from the two epochs using IRAF/CROSSCOR and IRAF/SHIFTFIND restricting the cross-correlation to the region of overlap between the two epochs on WFPC chip #3. Using IRAF/CENTER and OFILTER centering algorithm, we computed the centers of the OT and the host. The result is a statistical offset of mas E, mas N (hostOT) or (note that the uncertainty of 4.1 mas is not the normal Gaussian r.m.s; see Bloom et al. (2001) for further details). As a demonstration of the good registration of the images, we note that the bright knot of emission located 2′′.57 E and 0′′.15 of the host had a statistically negligible offset of (epoch 5epoch 1) mas W, mas S between images. The white oval in Figure 5 shows the position of the OT compared to the host.
In addition to the bright, compact knot, Figure 5 also shows an arc of emission extending East from the OT location. This arc is separated by a projected distance of 4 kpc from the compact knot. Ground-based narrow-band Ly-alpha imaging indicates that the extended emission also originates from (Fynbo et al., 2001b), and therefore may be associated with the host. The two bright knots, separated by kpc are possibly the nuclei of interacting systems. Comparing the emission extracted from a 5-pixel radius surrounding the OT and the Eastern knot in the F814W and F606W WFPC filters, the knot coincident with the OT appears to be somewhat redder at the 3.5- level.
5 Discussion
Two notable features of the GRB 000926 optical transient are the small offset from the center of the host galaxy, and the large equivalent widths of the absorption lines. At the redshift of GRB 000926, the OT offset amounts to pc projected on the sky. Only 2 out of 15 other GRBs have smaller measured offsets from their hosts (GRB 000418 and GRB 970508; Bloom et al. (2001)). The absorption line equivalent widths are large compared to those seen in other GRBs. The Mg II absorption, with (Mg II 2796.3) = and (Mg II 2803.5) = (summing components 1 and 2), is by far the largest measured in a GRB afterglow to date. The Mg II is highly saturated; the doublet ratio (Mg II 2796.3)/(Mg II 2803.5) is close to unity, and the ratio of Mg I to Mg II, (Mg I 2853.0)/(Mg II 2796.3) = 0.45 0.06 is very high. In quasar absorption line systems this ratio is typically 0.15 (Steidel & Sargent, 1992). Such a high ratio was also noted in GRB 970508 (Metzger et al., 1997).
Combined with the small offset, the high EWs indicate that the GRB 000926 OT lies close to the center of the compact host. The small offset alone means the projected distance is small, but the measured EWs imply the line of sight subtends a significant column of material, in excess of that expected for a typical galactic halo. Damped Lyman alpha systems are believed to be normal foreground galaxies, and the lines of sight to the backlighting quasars most often subtend the halo of the absorber. The Mg II features seen in damped Lyman alpha systems at similar redshift typically have (Mg II 2796.3) between 0 and 3 , falling off steeply towards high (Steidel & Sargent, 1992). The sample of Steidel & Sargent (1992) contains no system with (Mg II 2796.3). Our measurement of (Mg II 2796.3) = is therefore exceptionally high. The large relative values we measure for GRB 000926 therefore imply the OT was embedded in the galactic disk.
Absorption redshifts provide only lower limits, however in this case, as argued above, the absorption is almost certainly due to the host galaxy. Assuming a , , = 65 km s-1 Mpc-1 cosmology the measured redshift and the k-corrected 20 - 2000 keV fluence corresponds to an isotropic energy release of (2.97 0.10) erg, which reduces to 3 erg when corrected for collimation of the outflow (Harrison et al., 2001).
The two components seen in the ESI absorption lines are likely due to individual systems in the host galaxy. The velocity separation of 168 km s-1 is typical for relative motions between clouds in a galaxy. Adopting the assumption that the GRB lies in one of these clouds near the galactic center, and the second cloud is at the visible half light radius so that the measured velocity is representative of galactic rotation at this distance, we can estimate the host galaxy mass to be .
In principle, absorption spectroscopy can be used to measure metallicity in distant galaxies, and it is interesting to ask how metal abundances in GRB hosts compare to other systems at similar redshift. Unfortunately our spectra do not extend far enough into the blue to measure Ly, so we cannot make any inference about the metallicity of the host galaxy or GRB site. Because the degree of metal enrichment in galaxies at the same epoch can vary by more than two orders of magnitude (Pettini et al., 1994), we also cannot estimate the hydrogen column from the EWs of the metal absorption lines.
The relative abundances of various metals can, however, be used to make some inferences about the physical properties of the absorbing medium. In particular, the relative abundances of zinc and chromium, as measured from the Zn II (2026.15,2062.66) and Cr II (2056.25, 2062.23, 2066.16) lines provide a qualitative estimate of the dust to gas ratio in the absorbing clouds. In a study of these lines in damped Lyman-alpha systems, Pettini et al. (1990) noted that the Zn II doublet provides a good measurement of Zn in the gas phase of the ISM, and further that Zn is not readily incorporated into dust grains. Interstellar Cr, on the other hand, is one of the most heavily depleted elements (see Pettini et al. (1990) for more detailed discussion).
We detect Zn II 2026 and Cr II 2056 with high statistical significance in a region of the spectrum where we can accurately measure the continuum, and these EWs are listed in Table 1. We cannot resolve the Cr II 2062.23 and Zn II 2062.66 lines, but we measure the combined redshift-corrected equivalent width of () and () for the blend. The Cr II 2066 line is in a region where it is very difficult to measure the continuum. Based on upper and lower limits on the continuum, we get (). From the line ratios, we can infer that the Zn II and Cr II lines are likely not saturated, and we can therefore use the EWs to determine the relative abundances of Zn and Cr.
The Cr/Zn ratio we measure for the absorbers in the GRB 000926 host indicates the host galaxy is depleted in dust relative to the local ISM. The ratio [Cr/Zn] for both components of the absorption system is significantly larger than that measured locally. Using the oscillator strengths from Pettini et al. (1994), we obtain [Cr/Zn] and for the two components of the GRB absorber, indicating the gas phase abundance of Cr is almost a factor 10 higher than in the local ISM. [Cr/Zn] measured for the GRB 000926 clouds is in fact quite similar to the range to that Pettini et al. (1994) obtain for damped Ly systems between . For the damped Ly systems, Pettini et al. (1994) conclude that this is due to the depletion of dust in high redshift galaxies. A similar qualitative statement applies to the GRB 000926 host, again assuming that the absorption systems are local to the host.
The fact that is similar in the absorption spectra of the two clouds indicates the dust depeletion is a characteristic of the galaxy as a whole, rather than of the immediate GRB environment. It has been suggested that GRBs reside in gas-rich regions, and the dust in this gas is destroyed by heating and sublimation of the grains by the X-ray and UV flux (Waxman & Draine, 2000) (effective to about 10 pc) or/and by ejection of electrons by X-rays and subsequent shattering of the grains by the repulsive force of the net charge left (Fruchter et al., 2001) (effective out to about 100 pc). This suggestion has been used to explain the observation that in a sample of events, the optical extinction towards GRBs is lower than one would expect from measured X-ray column densities (Galama & Wijers, 2000). The postulated destruction of dust takes place locally to the GRB, however our measurements find dust to be similarly depleted in clouds that must be separated by much more than 10 pc. We suggest therefore that the observed X-ray columns result from absorption in the disks of the host galaxies, and that the low extinctions seen in many OT optical spectra are due to the lack of dust in galaxies at these redshifts.
6 Conclusions
High-resolution absorption spectroscopy of GRB 000926 strengthens the case that GRBs explode in the disks of galaxies. The small offset from the center of the host, combined with the evidence for a significant column depth of metals indicates the explosion occurred near the center of a galaxy at redshift . The two absorption systems seen in the intermediate-resolution spectra, separated by km s-1, are most easily interpreted as due to separate clouds within the host galaxy. The similarity in the properties (e.g. ratios of metals) between the two clouds indicates that GRBs do not significantly alter their immediate environment. Rather, differences between dust to gas ratios in GRB host galaxies to the local sample are most likely due to evolutionary effects.
The ability to measure the EWs of a significant number of metal lines in the GRB 000926 spectrum suggests that in the future high-resolution studies of optical transients will provide a means of probing the metallicity and dust content of GRB hosts. For GRB 000926 we were unable to measure the Ly line, so we cannot directly infer the metal enrichment. This should, however, be possible in future events. From the ratio of Cr/Zn it appears that, like other galaxies at similar redshift, the dust to gas ratio is reduced in the GRB 000926 host compared to local values. With a larger sample it should be possible to determine if there are any significant differences in metal enrichment and dust depletion in GRB host galaxies relative to other distant galaxies.
References
- Bloom et al. (2001) Bloom, J. S., Djorgovski, S. G., and Kulkarni, S. R. 2001, ApJ, 554, 678
- Bloom et al. (2001) Bloom, J. S., Kulkarni, S. R., and Djorgovski, S. G. 2001, submitted to AJ. astro-ph/0010176
- Castro et al. (2000) Castro, S. et al. 2000, gCN notice 851
- Dall et al. (2000) Dall, T. et al. 2000, gCN notice 804
- Djorgovski et al. (2001) Djorgovski, S. G., Frail, D. A., Kulkarni, S. R., Bloom, J. S., Odewahn, S. C., and Diercks, A. 2001, in press, astroph/0107539
- Epps & Miller (1998) Epps, H. W. and Miller, J. S. 1998, SPIE, 3355, 48
- Fruchter et al. (2001) Fruchter, A., Krolik, J., and Rhoads, J. 2001, apJ submitted
- Fruchter & Hook (1997) Fruchter, A. S. and Hook, R. N. 1997, in Applications of Digital Image Processing XX, Proc. SPIE, Vol. 3164, ed. A. Tescher (SPIE), 120–125
- Fynbo et al. (2000) Fynbo, J. et al. 2000, gCN notice 807
- Fynbo et al. (2001a) —. 2001a, apJ submitted; astro-ph/0102158
- Fynbo et al. (2001b) Fynbo, J. U. et al. 2001b, in preparation
- Galama & Wijers (2000) Galama, T. J. and Wijers, R. A. M. J. 2000, apJ in press; astro-ph/0009367
- Gorosabel et al. (2000) Gorosabel, J. et al. 2000, gCN notice 803
- Groot et al. (1997) Groot, P. J. et al. 1997. IAU circular 6574
- Harrison et al. (2001) Harrison, F. et al. 2001, apJ in press; astro-ph/0103377.
- Holtzman et al. (1995) Holtzman, J. A., Burrows, C. J., Casertano, S., Hester, J. J., Trauger, J. T., Watson, A. M., and Worthey, G. 1995, PASP, 107, 1065
- Hurley et al. (2000) Hurley, K., Mazets, E., Golenetskii, S., and Cline, T. 2000, gCN notice 801
- Metzger et al. (1997) Metzger, M. R., Djorgovski, S. G., Kulkarni, S. R., Steidel, C. C., Adelberger, K. L., Frail, D. A., Costa, E., and Fronterra, F. 1997, Nature, 387, 879
- Oke et al. (1995) Oke, J. B. et al. 1995, PASP, 107, 375+
- Pettini et al. (1990) Pettini, M., Boksenberg, A., and Hunstead, R. W. 1990, ApJ, 348, 48
- Pettini et al. (1994) Pettini, M., Smith, L. J., Hunstead, R. W., and King, D. L. 1994, ApJ, 426, 79
- Price et al. (2001) Price, P. A. et al. 2001, ApJ, 549, L7
- Steidel & Sargent (1992) Steidel, C. C. and Sargent, W. L. W. 1992, ApJS, 80, 1
- Taylor et al. (1998) Taylor, G. B. et al. 1998, ApJ, 502, L115
- Waxman & Draine (2000) Waxman, E. and Draine, B. T. 2000, ApJ, 537, 796