IR Detection of Low-Mass Secondaries in Spectroscopic Binaries
Abstract
This paper outlines an infrared spectroscopic technique to measure the radial velocities of faint secondaries in known single-lined binaries. The paper presents our band observations with the CSHELL and the Phoenix spectrographs and describes detections of three low-mass secondaries in main-sequence binaries: G147-36, G 164-67, and HD 144284, with mass ratios of , , and , respectively. The latter is one of the smallest mass ratios derived to date.
1 Introduction
This paper describes a technique to measure the radial velocities of faint secondaries residing in known single-lined spectroscopic binaries (SB1s) using high-resolution infrared (IR) spectroscopy. The paper outlines the approach and reports on the detection of low-mass secondaries in three main-sequence binaries. From the radial velocities of the faint secondaries, combined with the already known velocities of the primaries, we derive the mass ratios of these binaries, and estimate the masses of the secondaries.
In most of the known spectroscopic binaries only the primary spectrum is detected and measured, rendering such systems as SB1s. Measurements of SB1s yield only the mass function, in which the mass of the primary, secondary, and inclination (, , and ) are inseparable. To derive the mass ratios of these systems it is necessary to turn them into double-lined binaries (SB2s). To obtain the masses we further need to obtain information about the inclination, either from the light curves in eclipsing binaries, or from astrometric orbits. When the inclination of an SB2 is not known, it is possible to derive the secondary mass if the primary mass can be estimated from the system’s photometry and spectrum.
Accurate mass ratios and masses are important for many aspects of the astrophysics of binaries. We are applying the technique we describe here in two areas of particular interest to us. Accurate masses for premain-sequence (PMS) stars with low masses (M1 M☉) are known for only very few objects. As a result, calculations of PMS evolution are incompletely tested. Comparison of evolutionary tracks published in the past 5 years show that, for a given location of a star in the HR diagram, the different tracks can produce a scatter of 23 in the inferred mass and age (Simon et al., 2000). One of our goals is, therefore, to improve the calibration of the theoretical tracks by deriving the mass ratios, and, eventually, the masses of the low-mass components of PMS binaries.
Another of our goals is to derive the distribution of mass ratios and secondary masses in main-sequence binaries. The secondary-mass distribution touches upon one of the unanswered basic questions of star formation, namely how binaries, and close binaries in particular, are formed. The secondary distribution provides one way to distinguish (Boss, 1993) between the star formation models (e.g. Clark 1995; Bate 2000). In addition, the lower end of the secondary mass distribution is of crucial importance to an issue that has attracted recent attention: the distinction between low-mass secondaries and extrasolar planets (Han et al., 2001; Pourbaix, 2001; Pourbaix & Arenou, 2001; Zucker & Mazeh, 2001a). Some recent studies (Basri & Marcy, 1997; Mazeh, 1999; Halbwachs et al., 2000; Jorissen et al., 2001; Zucker & Mazeh, 2001b) suggested that the two populations could be separated by comparing their mass distributions.
Spectroscopic binaries have been studied mostly in the visible, where sensitive detectors have been available for a few decades. Unfortunately, detection of secondaries in visual spectra favors systems with light ratio, and hence mass ratio, close to unity. Most of the known spectroscopic binaries are thus SB1s and the distribution of mass ratios in the known double-lined systems (SB2s) is biased toward unity.
Our approach is based on the premise that in each binary the secondary has a lower mass and is therefore cooler than the primary, favoring its detection in the IR. Consider, for example, a binary with 0.2 and 1.0 M☉ stars at the age of 5 Gyr. The results of Baraffe et al. (1998) and Henry & McCarthy (1990) indicate that the flux ratio between the primary and the secondary is about at 5500 Å, but only 0.01 at 1.6 m. Thus, the advent of high-resolution IR spectrometers with efficient large format detectors offers the means to complement the visible radial-velocity studies with IR observations that are considerably more sensitive to low-mass companions. This enables the measurement of the secondary radial velocities which convert the SB1s into SB2s. The derivation of mass ratios by this approach does not require extensive observations since the parameters of the primary orbit have already been derived from previous work so only a small number of secondary velocities are required.
To analyze the composite target spectra we use TODCOR, a two-dimensional correlation algorithm developed by Zucker & Mazeh (1994). The algorithm assumes that the observed spectrum is a combination of two known spectra, shifted by the radial velocities of the two components, and calculates the correlation of the observed spectrum against a combination of two templates with different shifts. TODCOR generates a two-dimensional correlation function, whose peak simultaneously identifies the radial velocities of both the primary and the secondary (e.g. Zucker & Mazeh 1994). One of the advantages of TODCOR is its ability to use different templates for the primary and the secondary. When the primary and the secondary are of different spectral types, the use of two different templates enables us to utilize all the spectral information contained in the observed spectrum of the combined system. This feature of TODCOR is most important when deriving the radial velocity of a faint secondary.
This paper outlines the new approach and reports on the detection of low-mass secondaries in three main-sequence binaries: G 147-36, G 164-67, and HD 144284. The former two systems were identified and studied as SB1s by Latham et al. (2001), who searched for spectroscopic binaries within a sample of high-proper-motion stars (Carney & Latham, 1987). The latter was found by Duquennoy & Mayor (1991), who studied the nearby G stars. The three stars presented here were the three most significant detections in our main-sequence program to date. Preliminary reports on the application of this technique to main-sequence and PMS SBs appear in Mazeh et al. (2000), Prato et al. (2001a), Steffen et al. (2001), and Prato et al. (2001b). Section 2 presents four approaches to the derivation of mass ratios from the primary and secondary radial velocities. Our observations are described in Section 3 and the spectral type templates in Section 4. We present our derivation of the radial velocities in Section 5, while Section 6 shows the calculation of the mass ratios for the three binaries. A short discussion of our results appears in Section 7.
2 The Derivation of the Mass Ratios
In this section we present four different approaches to derive the mass ratio of a spectroscopic binary from a few radial velocities of both the primary and the secondary. Choosing between these approaches depends upon the extent of the information available from the previous SB1 solution.
-
1.
When no previous orbital information is available, any two pairs of velocities can yield the mass ratio of a binary (Wilson 1941). Suppose we have observed the system at two epochs, and , with velocities where are the velocities of the primary and the secondary, respectively. Then the mass ratio is
The ratio of the velocity difference between the i-th and the j-th observations is exactly . This approach will be most effective with measurements made at such phases that the difference of the velocities is large compared to the uncertainty of their measurements. When more than two pairs of velocities are available, any two pairs of velocities can yield another value of the mass ratio. Note, however, that not all the values are independent (see also Wilson 1941).
-
2.
When the systemic velocity, , is available from the SB1 observations, each pair of velocities, obtained at time , can yield a value of the mass ratio
-
3.
When the elements of the single-lined orbit are available, the expected primary velocity at the time of the observation can be derived from the elements. In such a case, each secondary velocity can yield a value of the mass ratio
In the case in which the zero point of the new velocities is uncertain, and the primary velocity was also measured, can be replaced by . This assumes that the new primary and secondary velocities share the same zero point.
-
4.
In the case in which the original single-lined radial velocity measurements are available, one can combine the old velocities with the new double-lined measurements and obtain a new solution for the orbital elements. The new set of elements includes , the semi-amplitude of the secondary, from which one can derive the mass ratio.
The three binaries considered here have known elements together with the individual measurements (Duquennoy & Mayor, 1991; Latham et al., 2001). We therefore opted to apply the second and the last approaches listed above. The advantage of the second approach is that the spread of the mass ratio values can be examined and evaluated directly, while in the last option this is all hidden in the orbital solution.
3 Observations
To search for the spectroscopic signature of the secondaries in our SB1 sample, we observed the target systems and standard stars in 1997 December and 1999 February, May, and November with CSHELL on the IRTF 3-m and in 1999 December with Phoenix at the KPNO 4-m. CSHELL is a high resolution IR spectrometer equipped with a InSb array that provided a free spectral range of km/s. We observed with a slit, yielding a measured resolution of . Phoenix, NOAO’s high resolution IR spectrometer, has a InSb array which provides a km/s free spectral range. With Phoenix, we used a slit which gave a measured resolution of .
The spectrometers were centered at m for all of our observations. Inspection of atlases of solar photospheric and sunspot spectra showed that this region contains lines suitable for the characterization of stars in the mass range of interest. The region includes atomic lines for identifying the G and early K spectral type stars and molecular lines, most notably OH and H2O, suitable for late K and M spectral type stars (Livingston & Wallace, 1991; Wallace & Livingston, 1992, see also Meyer et al. 1998 for an overview of stellar spectra in the band). This wavelength region is also advantageously free of strong terrestrial absorption lines.
We calculated the dispersion and wavelength calibration of CSHELL and Phoenix at the m setting using spectral lamps internal to the instruments. Both spectrometers showed small flexure, at the level of km/s during a night of observations. We corrected for the flexure by reobserving the lamps during the night and also by monitoring the apparent positions of the OH lines detected from the night sky. The spectra were extracted by procedures written by one of us (Prato, 1998).
4 Templates
In addition to the target spectra, we also observed a sample of main-sequence standard stars, from spectral type F8 through M6.5, in order to provide templates for the two-dimensional cross-correlation analysis using TODCOR. When possible, we chose a standard whose metallicity would be close to solar, on the expectation that its lines would be deeper than those of older stars. The templates are usually slow rotators, and if needed we generated new calculated templates by broadening the template lines with profiles representing different rotational velocities (see below). We also expected that these standards would provide better templates for our PMS star program.
Table 1 lists the observed standards. The third column provides an estimate of their population type. A numerical entry in this column represents the value of [Fe/H] from the catalog of Cayrel de Strobel, et al. (1992). In cases where the catalog listed several determinations, we used the most recent one. A dagger () in this column is Keenan & McNeil (1989)’s designator for stars they judged to have the best determination of spectral type. OD and YD are Leggett’s (1992) “old disk” and “young disk” designations, based on kinematic and photometric criteria. Column 4 lists the assigned radial velocities of the observed spectra (see below). Column 5 indicates the instrument used, CSHELL (C) or Phoenix (P), on the date indicated in Column 6.
Figure 1 shows all the template spectra measured with the Phoenix spectrometer. The spectra are shifted to the laboratory frame. Some of the prominent lines are indicated following the identifications given by Livingston & Wallace (1991) and Wallace & Livingston (1992). Since the TODCOR analysis correlates spectra of the templates and targets, only the presence of lines matters; their specific identification is unimportant. The sawtooth pattern evident in the spectrum of HR 1543 is an artifact of the illumination of the array for that particular observation. As Table 1 indicates, we observed a similar range of spectral types, and often the same stars, with CSHELL and Phoenix. In Figure 2, we show the CSHELL and Phoenix observations for the M stars only. Comparison shows that most of the features in the complex spectra of the late M types, which appear to be noise, are in fact real.
The radial velocities of the observed spectra of the standards are crucial for our analysis. As a starting point, we assigned to each spectrum the radial velocities of these template stars measured either by the Geneva (Duquennoy & Mayor, 1991) or by the CfA groups (Latham, 1985). However, not all our templates were observed by these two groups. Moreover, some of the observed spectra of the templates were shifted by about 1–2 km/s, apparently the result of random jitter of the spectrographs. To overcome these two difficulties we performed a few iterations to rederive new assigned velocities for each of the observed template spectra. This was done by correlating each observed spectrum with templates of similar classes, using the assigned velocities of the previous iteration. A few iterations led us to assign a velocity for each observed spectrum as given in Table 1.
The assigned velocities are not meant to measure the actual radial velocities of these stars. They are our best estimates for the radial velocity shifts of the observed spectra, and therefore these are the values we used in our analysis with TODCOR. In an ideal world, without any outliers and spectrograph jitters, these velocities would be our best estimate for the actual stellar radial velocities. Actually, we find that for most of the stars for which we had a prior radial velocity measurement (Duquennoy & Mayor, 1991; Latham et al., 2001), our assigned radial velocity was within 12 km/s of the previous measurement. We therefore estimate that our zero-point is good to within 1.5 km/s. Only one star, GJ 475, displayed a discrepancy of 6 km/s between the CSHELL (8.0 km/s) and Phoenix (1.9 km/s) measurements. Duquennoy & Mayor (1991) derived a velocity of km/s. We, nevertheless, used the two spectra with the assigned velocities, assuming some non-random mechanical or optical shift of 4.5 km/s of the Phoenix instrument had occurred during that exposure.
| Star | Sp Ty | Pop | Vrad | Instr. | Date(JD) |
|---|---|---|---|---|---|
| Type | km/s | 2450000+ | |||
| HR 1543 | F6 | +0.02 | 24.5 | C | 0806.93 |
| 20.5 | P | 1532.88 | |||
| HR 1780 | F8 | 38.1 | C | 0806.95 | |
| 36.1 | C | 1228.75 | |||
| 35.0 | P | 1530.61 | |||
| GJ 475 | G0 | -0.19 | 8.0 | C | 0806.06 |
| 1.9 | P | 1533.06 | |||
| HR 88 | G2.5 | +0.20 | -5.4 | P | 1532.63 |
| HR 2643 | G4 | -0.15 | 24.5 | C | 0806.97 |
| HR 5072 | G4 | 3.2 | C | 1300.92 | |
| HD 37986 | G8 | 59.0 | C | 1228.79 | |
| HR 3259 | K0 | 29.7 | C | 0805.96 | |
| GJ 315 | K1 | -10.9 | C | 0804.07 | |
| HR 493 | K1 | -0.20 | -35.6 | P | 1530.59 |
| GJ 483 | K3 | 9.0 | C | 1229.07 | |
| HR 753 | K3 | 22.7 | P | 1530.61 | |
| GJ 570A | K4 | +0.01 | 26.0 | C | 1229.02 |
| HR 8085 | K5 | -0.06 | -64.0 | C | 0804.68 |
| -67.1 | P | 1530.58 | |||
| HR 8086 | K7 | 0.00 | -64.0 | C | 0804.68 |
| -65.3 | P | 1529.62 | |||
| GJ 270 | M0 | OD | -68.9 | C | 0804.01 |
| GJ 382 | M1.5 | YD | 12.0 | C | 0806.00 |
| 12.0 | C | 1228.94 | |||
| GJ 447 | M4 | OD | -31.1 | C | 0806.03 |
| -31.1 | C | 1228.07 | |||
| -32.9 | P | 1531.04 | |||
| LHS 292 | M6.5 | OD | 0.0 | C | 0805.06 |
| 0.0 | C | 1300.81 | |||
| 1.8 | P | 1530.96 |
5 The Radial Velocities
To derive the radial velocities of the two stars in each binary, TODCOR requires two specific template spectra, one for the primary and the other for the secondary. We ran TODCOR for a variety of different pairs of templates from our accumulated library to optimize the match between the templates and the observed composite spectra. To each pair of templates we assigned, as a measure of its fit to the binary spectra, the correlation peak obtained by TODCOR for that pair of templates, averaged over all the observed target spectra. We then chose the pair of templates that gave the highest average value for the peak.
To improve the fit between the observed binary spectrum and the two templates, we matched the rotational broadening of the primary and secondary lines with those of the templates. This was done by broadening the template lines with profiles representing different rotational velocities, forming an extended template library. We then chose the broadened templates that best match the observed spectrum of the binary. To extract the radial velocities for the two stars, the brightness ratio of the two templates, , was also required. Assuming that each observation of a given binary system had the same brightness ratio, we determined a value to be used for all of its spectra. To choose the best brightness ratio, we ran TODCOR for a grid of selected values, searching again for that value which gave the highest averaged correlation peak. We do not consider the templates and values chosen by this procedure as representative of the true spectral types and light ratios of the binary targets because the template and target stars may differ in abundances and, for PMS stars, surface gravity. We regard the template spectral types and as a set of parameters that yields the best radial velocities. Choosing the best templates and comprised the major part of the first step of our procedure. Only after the best templates and the brightness ratio were determined did we proceed to derive the radial velocities, given in Table 2. Since the essential inputs to TODCOR are the existence and locations of lines in the spectra of the templates and targets, the fundamental outputs are the velocities of the primary and secondary, and hence their mass ratio. The templates and light ratios used are necessary to derive the velocities but are not intended as models of the target binary.
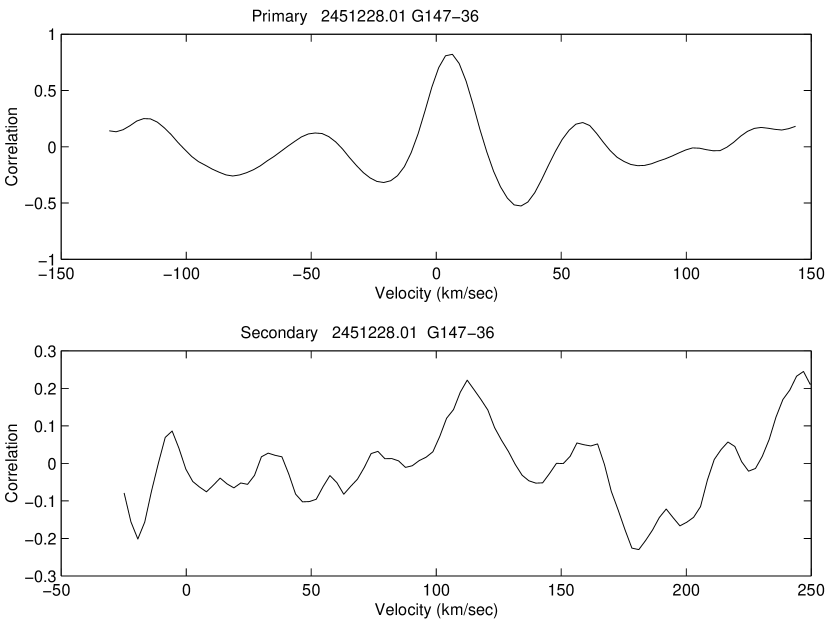
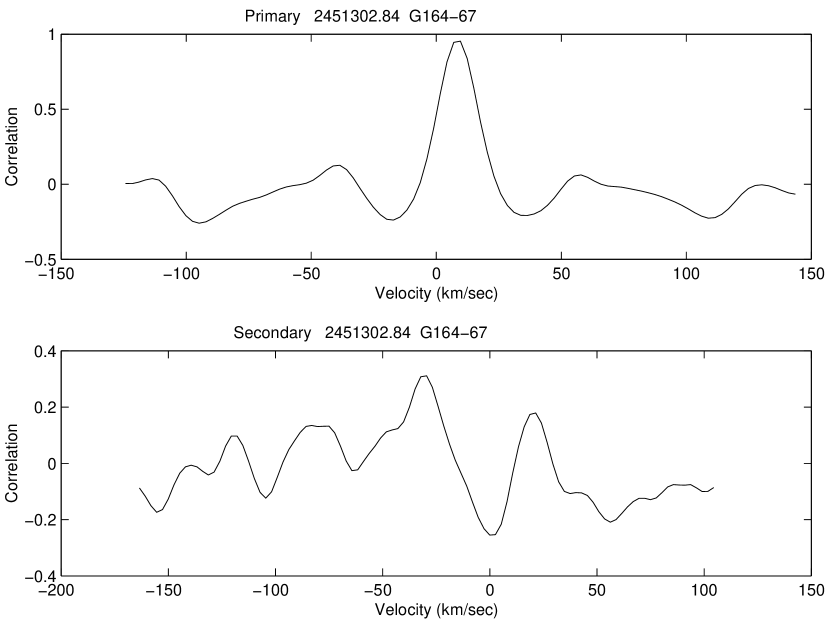
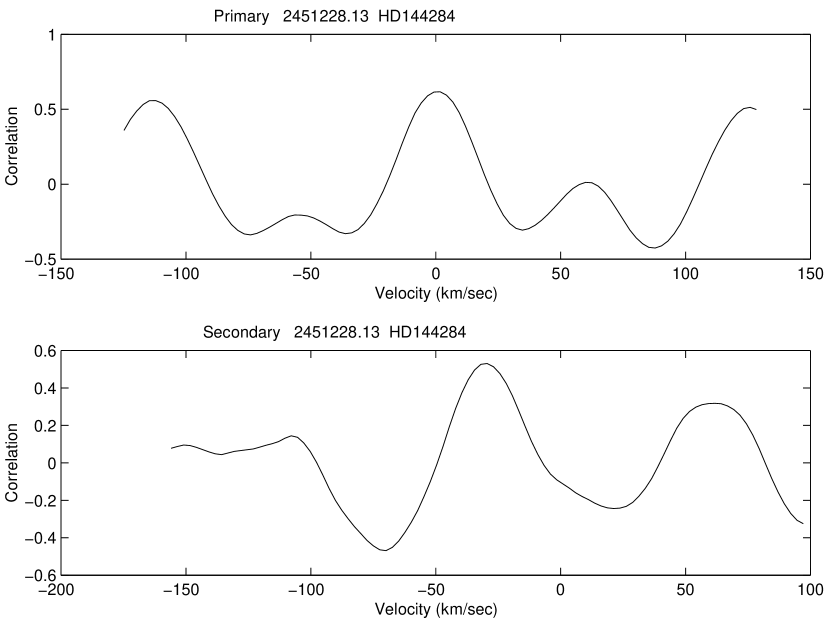
While all observed spectra yielded reliable primary velocities, not all spectra gave reliable secondary velocities. This is because the secondary peak was not always sufficiently prominent, depending on several factors including the SNR of the observed spectrum, the velocity difference between the primary and the secondary, the small differences between the actual spectra of the primary and the secondary on one hand and their templates on the other, and the light ratios between the primary and the secondary. The first two can change between one exposure and another, and can explain why we could derive a reliable secondary velocity from one spectrum and not from the other. For our analysis we chose only spectra that yielded cross correlation functions for which we judged the secondary peak to be high enough above the other spurious peaks of the correlation. Our somewhat stringent criterion led us to accept only 10 secondary velocities for the three stars, all listed in Table 2. Figures 35 depicts the correlation functions derived by TODCOR for G147-36, G164-47, and HD 144842. The velocity uncertainty for the former two objects is 1.5 km/s and for the latter is 2 km/s, because of its high rotational velocity.
| JD | Inst. | |||||
| (2450000+) | (km/s) | |||||
| G147-36 km/s | ||||||
| 807.06 | C | 15.56 | 104.83 | |||
| 1228.01 | C | 5.52 | 112.54 | |||
| 1529.96 | P | 12.85 | 107.84 | |||
| 1532.98 | P | 63.51 | 8.22 | |||
| G164-67 km/s | ||||||
| 1302.84 | C | 8.49 | -30.57 | |||
| 1529.90 | P | 8.77 | -33.82 | |||
| = | ||||||
| HD 144284 km/s | ||||||
| 806.15 | C | -28.93 | 45.48 | |||
| 807.15 | C | -8.48 | 0.81 | |||
| 1228.13 | C | 0.73 | -30.08 | |||
| 1484.71 | C | -27.09 | 43.90 | |||
| = | ||||||
6 The Mass Ratios
6.1 Derivation from Systemic Velocities
Table 2 shows the results of deriving the mass ratios using only the velocities, drawn from the previous single-lined orbital solutions. The velocity appears as the first entry for each binary. The Julian date, instrument used, component velocities, and derived mass ratio are then listed for each individual observation. The last entry in each section is the average value and uncertainty of the individual mass ratios.
6.2 Global Solution for Binary Parameters
In this subsection we present the full double-lined orbital solutions for the three orbits, derived with our ORB code (Mazeh et al., 1993, 2001). To derive the double-lined solution, we assign different uncertainties to the primary and secondary velocities of the different measurements. We estimated that the uncertainty of the previous velocities of G147-36 and G164-67 (Latham et al., 2001) are 0.5 km/s, and those of HD 144284 (Duquennoy & Mayor, 1991) are 1 km/s. The latter somewhat bigger uncertainty is attributable to the large rotational width of the stellar lines. The scatter we find for these velocities (see Table 3) is very close to these estimates.
The uncertainty of the secondary velocities depends strongly on the free spectral range, the number and depth of the absorption lines, and, mainly, on the light ratio between the primary and the secondary. Using two different sets of data, obtained with CSHELL and Phoenix, complicates the analysis. Therefore, our uncertainty estimates are poorly constrained. We estimated that the uncertainty of our secondary velocities for G147-36 and G164-67 are 1.5 km/s and those of HD 144284 are 2 km/s, again because of the large rotational velocity of the latter.
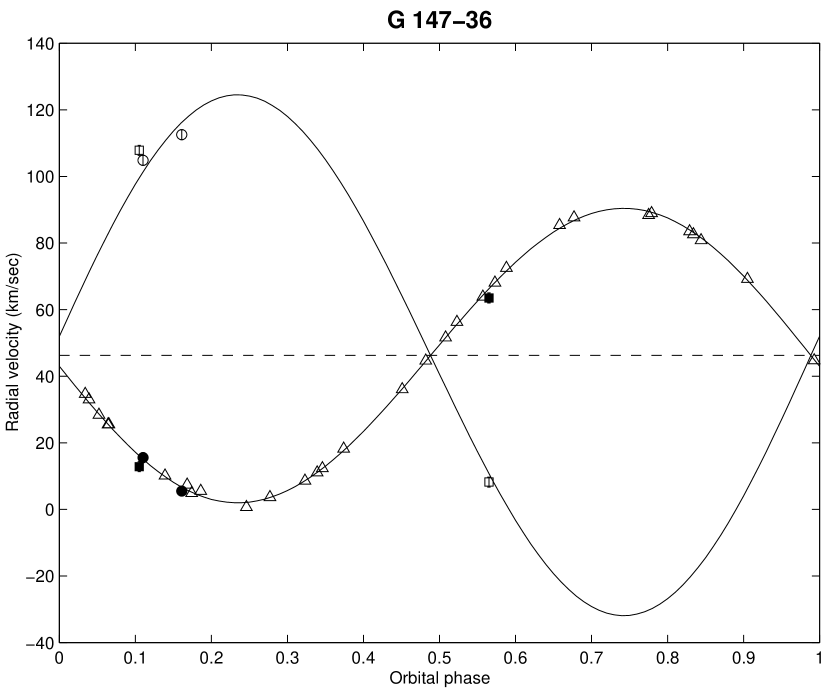
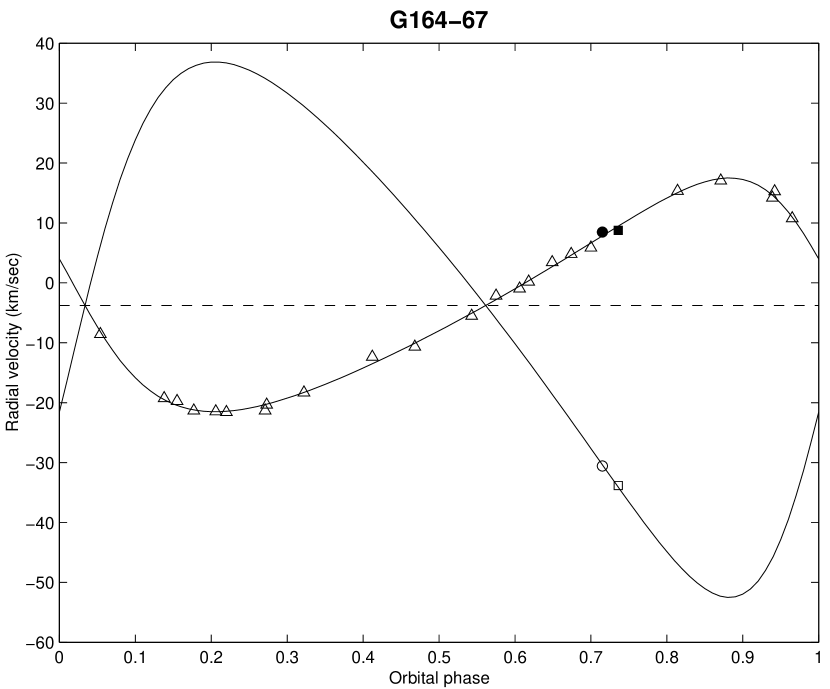
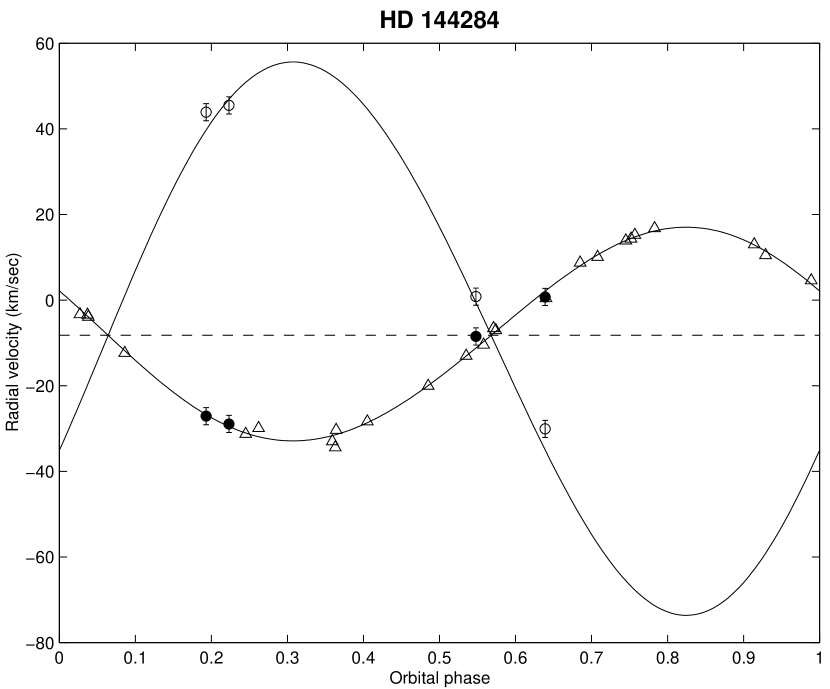
Table 3 presents our results, giving the derived values of the period, P, in days, eccentricity, e, longitude of the periastron, , in degrees, time of periastron passage T∘, in J.D.2440000, primary velocity amplitude, , in km/s, and the center-of-mass velocity, , in km/s. The only new parameter coming from the secondary radial velocities is the velocity amplitude of the secondary, , in km/s, from which we derived the mass ratio . Finally, Table 3 lists , and , in km/s — the r.m.s. of the residuals of the old and new velocities of the primary, and the new secondary velocities. The orbital elements derived here are entirely consistent with the original published values. The orbits are plotted in Figures 68.
The scatter for the primary and the secondary velocities, listed in Table 3, gives an external estimate of our precision. As can be seen from Table 3, these estimates are based on extremely small numbers, only two measurements in the case of G164-67. It is therefore not surprising that the secondary radial-velocity scatter ranges from 4.0 to 0.23 km/s. Our estimates for the uncertainty of the secondary velocities are between these two values.
Table 4 is a summary of the mass ratios and masses estimated for the three binaries. The primary masses for G147-36 and G164-67 are from Carney et al. (1994) and for HD 144284 from Mazeh et al. (1997). The latter is based only on the spectral type of the system. Arbitrarily, we assigned an uncertainty of 0.1 to these primary mass estimates. The table also lists the minimum mass ratios derived from the SB1 orbits. Statistically, the derived mass ratios are expected to be close to the minimum values, but never smaller. This is indeed the case, within the range, for all three binaries.
| G 147-36 | G 164-67 | HD 144284 | |
| P | 6.572037 | 16.19429 | 3.0708216 |
| 0.000027 | 0.00067 | 0.0000069 | |
| e | 0.0051 | 0.2947 | 0.039 |
| 0.0030 | 0.0079 | 0.012 | |
| 100 | 71.9 | 63 | |
| 30 | 1.7 | 15 | |
| T | 7231.21 | 5785.327 | 5971.98 |
| 0.56 | 0.071 | 0.13 | |
| 46.329 | -3.76 | -8.23 | |
| 0.090 | 0.11 | 0.20 | |
| K1 | 44.04 | 19.53 | 25.10 |
| 0.13 | 0.16 | 0.31 | |
| K2 | 78.4 | 46.2 | 66.0 |
| 1.6 | 4.6 | 2.2 | |
| 0.61 | 0.54 | 1.0 | |
| N | 31 | 23 | 25 |
| 2.8 | 0.57 | 1.7 | |
| N | 4 | 2 | 4 |
| 4.0 | 0.23 | 2.7 | |
| N | 4 | 2 | 4 |
| q | 0.562 | 0.423 | 0.380 |
| 0.011 | 0.042 | 0.013 |
| System | ||||
|---|---|---|---|---|
| G147-36 | 0.73 | 0.59 | 0.562 | 0.41 |
| 0.1 | 0.03 | 0.011 | 0.06 | |
| G164-67 | 0.93 | 0.26 | 0.423 | 0.39 |
| 0.1 | 0.01 | 0.042 | 0.06 | |
| HD 144284 | 1.2 | 0.18 | 0.380 | 0.46 |
| 0.1 | 0.01 | 0.013 | 0.04 |
7 Discussion
The work presented here demonstrates the potential of IR spectroscopy for detecting faint low-mass secondaries in single-lined spectroscopic binaries and deriving their mass ratios. We have shown that with the CSHELL and the Phoenix spectrographs we can reach a mass ratio of . To date, this is among the smallest known mass ratios for a main-sequence spectroscopic binary. Mazeh et al. (1997), observing in the red part of the visual spectrum, derived mass ratios of and for two binaries.
The detection of a secondary spectrum and the derivation of its radial velocity is hindered by the presence of the bright primary in the combined spectrum. For our purposes, the bright spectrum of the primary is a strong background source that has to be removed from the combined spectrum before we can measure the secondary radial velocity. The subtraction of the primary leaves behind noise, which ideally would be determined by Poisson statistics, but in reality is determined by the imperfect match between the primary spectrum and its template. To reach the faint stellar secondaries, we have to exploit every possible advantage available to improve the SNR of the secondary spectrum.
In this work we have used two such advantages. We observed the binaries in the IR regime, where the light ratio of the primary/secondary is much smaller than in the visual, and we used the two-dimensional cross-correlation analysis of TODCOR to extract the maximum amount of spectral information from the observed spectrum. To improve on this further, we need high sensitivity IR spectra covering as large a spectral range as possible. Fortunately, IR echelle spectrometers providing several orders simultaneously are now coming into operation at the large aperture telescopes. We have begun systematic surveys to detect low-mass secondaries in both main-sequence and PMS binaries (Prato et al., 2001b).
References
- Baraffe et al. (1998) Baraffe, I., Chabrier, G., Allard, F., and Hauschildt, P. H. 1998, A&A, 337, 403
- Basri & Marcy (1997) Basri, G., & Marcy, G. W. 1997, in AIP Conf. Proc 393, Star Formation, Near and Far, eds. S. Holt & L. G. Mundy (New York: AIP), 228
- Bate (2000) Bate, M. R. 2000, MNRAS, 314, 33
- Boss (1993) Boss, A. P. 1993, in The Realm of Interacting Binaries, eds. J. Sahade, G.E. McCluskey & Y. Kondo, Astrophysics and Space Science Library, 177, 355
- Carney & Latham (1987) Carney, B. W., & Latham, D. W. 1987, AJ, 92, 116
- Carney et al. (1994) Carney, B. W., Latham, D. W., Laird, J. B., & Aguilar, L. A. 1994, AJ, 107, 2240
- Cayrel de Strobel, et al. (1992) Cayrel de Strobel, G., et al. 1992, A&AS, 95, 273
- Clarke (1995) Clarke, C. J. 1995, A&AS, 223, 73
- Duquennoy & Mayor (1991) Duquennoy A., & Mayor, M. 1991, A&A, 248, 485
- Halbwachs et al. (2000) Halbwachs, J.-L., Arenou, F., Mayor, M., Udry, S., & Queloz, D. 2000, A&A, 355, 581
- Han et al. (2001) Han, I., Black, D. C., & Gatewood, G. 2001, ApJ, 548, L57
- Henry & McCarthy (1990) Henry, T. J., & McCarthy, D. W., Jr. 1990, ApJ, 350, 334
- Jorissen et al. (2001) Jorissen, A., Mayor, M. & Udry, S. 2001, A&A, submitted, (astro-ph/0105301)
- Keenan & McNeil (1989) Keenan, P. C., & McNeil, R. C. 1989, ApJS, 71, 245
- Latham (1985) Latham, D. W. 1985, in Stellar Radial Velocities, IAU Colloq. 88, eds. A.G.D. Philip and D.W. Latham (Schenectady: Davis Press), p. 21
- Latham et al. (2001) Latham, D. W., Stefanik, R. P., Torres, G., Davis, R. J., Mazeh, T., Carney, B. W., & Laird, J. B. 2001, AJ, submitted
- Leggett (1992) Leggett, S. K. 1992, ApJS, 82, 351
- Livingston & Wallace (1991) Livingston, W., & Wallace L., 1991, An Atlas of the Solar Spectrum in the Infrared from 1850 to 9000 cm-1, (NOAO:Tucson)
- Mazeh (1999) Mazeh, T. 1999, PhR, 311, 317
- Mazeh et al. (1993) Mazeh, T., Krymolowski, Y., & Latham, D. W., 1993, MNRAS, 263, 775
- Mazeh et al. (1997) Mazeh, T., Martin, E. L., Goldberg, D., & Smith, H.A. 1997, MNRAS, 284, 341
- Mazeh et al. (2000) Mazeh, T., Prato, L., Simon, M., & Goldberg, E. 2000, in Birth and Evolution of Binary Stars, Poster Proc. of IAU Symp. 200, eds. B. Reipurth and H. Zinnecker, p. 22
- Mazeh et al. (2001) Mazeh, T., et al. 2001, MNRAS, 325, 343
- Meyer et al. (1998) Meyer, M. R., Edwards, S., Hinkle, K. H., and Strom, S. E. 1998, ApJ 508, 397
- Pourbaix (2001) Pourbaix, D. 2001, A&A, 369, L22
- Pourbaix & Arenou (2001) Pourbaix, D., & Arenou, F. 2001, A&A, 372, 935
- Prato (1998) Prato, L. 1998, Ph.D. Thesis, SUNY Stony Brook
- Prato et al. (2001a) Prato, L., et al. 2001, BAAS, 33, 849
- Prato et al. (2001b) Prato, L., et al. 2001, ApJ, submitted
- Simon et al. (2000) Simon, M., Dutrey, A., & Guilloteau, S. 2000, ApJ, 545, 1034
- Steffen et al. (2001) Steffen A., Mathieu, R.D., Lattanzi, M. G., Latham, D. W., Mazeh, T., Prato, L., Simon, M., & Zinnecker, H. 2001, AJ, in press
- Wallace & Livingston (1992) Wallace, L., & Livingston, W., 1992, An Atlas of a Dark Sunspot Umbral Spectrum in the Infrared from 1970 to 8640 cm-1 (NOAO:Tucson)
- Wilson (1941) Wilson, O.C. 1941, ApJ, 93, 29
- Zucker & Mazeh (1994) Zucker, S., & Mazeh, T. 1994, ApJ, 420, 806
- Zucker & Mazeh (2001a) Zucker S., & Mazeh, T. 2001a, ApJ, in press
- Zucker & Mazeh (2001b) Zucker S., & Mazeh, T. 2001b, ApJ, submitted, (astro-ph/0106042)