Interaction of Radio Lobes with the Hot Intracluster Medium: Driving Convective Outflow in Hydra A
Abstract
The radio lobes of Hydra A lie within cavities surrounded by a rim of enhanced X-ray emission in the intracluster gas. Although the bright rim appears cooler than the surrounding gas, existing Chandra data do not exclude the possibility that the rim is produced by a weak shock. A temperature map shows that cool gas extends out along the radio axis of Hydra A. The age of the radio source and equipartition pressure of the radio lobe argue against a shock, and comparison with similar structure in the Perseus Cluster also suggests that the rim is cool. We show that the cool bright rim cannot be the result of shock induced cooling, or due to the effect of magnetic fields in shocks. The most likely source of low entropy (cool) gas is entrainment by the rising cavity. This requires some means of communicating the bouyant force on the cavity to the surrounding gas. The magnetic field required to produce the Faraday rotation in Hydra A has the appropriate properties for this, if the Faraday screen is mainly in this bright rim. In Hydra A, the mass outflow due to the rising cavities could be sufficient to balance cooling driven inflow, so preventing the build up of low entropy gas in the cluster core.
1 Introduction
The high spatial and spectroscopic resolution of the Chandra X-ray Observatory has permitted detailed observations of the interaction between radio sources and hot gas in elliptical galaxies and clusters of galaxies. Cavities containing radio lobes have been found in the X-ray emitting gas in a rapidly growing number of such systems (e.g. Böhringer et al., 1993; Carilli et al., 1994; McNamara et al., 2000; Vrtilek et al., 2000; Kraft et al., 2000; Finoguenov & Jones, 2001; Blanton et al., 2001; McNamara, 2001; Schindler et al., 2001). Many of these are cooling flow clusters, where Chandra and XMM data now show that there is very little gas below temperatures of about 1 keV (e.g. David et al., 2001; Peterson et al., 2001).
The lack of cool gas in cooling flow clusters, and the strong association of radio sources with these objects (Burns, 1990) suggest that radio sources provide the energy required to stop copious amounts of gas from cooling to low temperatures in cooling flows (David et al., 2001; Fabian et al., 2001; Churazov et al., 2001). Furthermore, it is argued on other grounds that the total power of radio jets is substantially larger than the radio power of the lobes that they feed (Pedlar et al., 1990; Bicknell & Begelman, 1996), as required if they are to heat the intracluster medium enough to quench cooling flows.
The powerful Fanaroff-Riley class 1 radio source Hydra A (3C218; Ekers & Simkin, 1983; Taylor et al., 1990; Taylor, 1996) shows a striking example of cavities caused by radio lobes. McNamara et al. (2000) found that the radio lobes of Hydra A have carved holes in the surrounding intracluster gas similar to those caused by the radio lobes of 3C84 in the Perseus Cluster (Böhringer et al., 1993; Fabian et al., 2000). Here we consider what the X-ray observations tell us about the interaction between the radio lobes of Hydra A and the intracluster gas. Although the discussion is centered on the Chandra observations of Hydra A, we consider similarities between Hydra A and other systems, especially the lobes of Perseus A (Fabian et al., 2000).
Our basic finding is that the SW cavity of Hydra A is surrounded by a region of enhanced X-ray emission which is cooler than ambient gas at the same radius elsewhere in the cluster. In conventional models (e.g. Clarke et al., 1997; Heinz et al., 1998), an expanding radio source generates a shock. While this phase is transient, what we see now in the Hydra A cluster does not support a jet power that substantially exceeds its radio power. Furthermore, it is surprising that the coolest gas appears to be closest to the radio lobes. We focus here on the origin of the cool gas.
In §2 we discuss the Chandra data in the region of the SW radio lobe in detail. In §3 we consider several shock processes that may play some role in producing the bright rim. In §4 we argue that the radio observations are more consistent with the radio lobes being in local pressure equilibrium than with them being overpressured. In §5 we argue that the bright rim is most probably low entropy gas lifted by the buoyantly rising cavity from closer to the cluster center. We also discuss the implications for the magnetic field in the cool gas of the rim.
We adopt a flat CDM cosmology (, ) with a Hubble constant of , which gives a luminosity distance of 240 Mpc and an angular scale of 1.05 kpc per arcsec for the Hydra A Cluster.
2 X-ray observations of the region around the radio lobes
The Chandra X-ray data used here are the same as discussed by McNamara et al. (2000) and David et al. (2001), consisting of a total exposure of 40 ks taken on 1999 October 30. Of this, 20 ks is with ACIS-I at the aim point and 20 ks with ACIS-S at the aim point. Raw and smoothed X-ray maps of the region around the lobes are shown in McNamara et al. (2000). Details of the data analysis, including screening and background subtraction, are given in McNamara et al. (2000) and David et al. (2001).
We focus on the SW cavity, since it is better defined in the X-ray image. As well as the count deficit in this cavity, the raw image shows a bright ‘rim’ of excess emission surrounding it. However, because the gas around the cavity is not uniform and the total number of photons in this part of the image is modest, it is difficult to extract a surface brightness profile for the cavity. Instead we have used circles centered on the SW cavity, at , (J2000), with radii of , and , and determined the background subtracted surface brightness for the combined ACIS-I and ACIS-S data in the sector between position angles and in the resulting annuli (omitting the complex region towards the nucleus; see Fig. 1). The resulting counts per pixel in the 0.5 – 7 keV band are given in Table 1. The bright rim shows as a 20% (8.6 sigma) excess over the mean of the two adjacent annuli.
We find, for ACIS-S data, that using the 0.5 – 3 keV and 3 – 7 keV bands to define a hardness ratio gives the greatest discrimination for temperature variations around the values of interest. Table 2 gives the ratio of 3 – 7 keV to 0.5 – 3 keV counts for the cleaned and background subtracted ACIS-S data for the 3 regions used in Fig. 1: the cavity; the bright rim surrounding the cavity; the annulus outside the bright rim. The hardness ratio is also given for a circular region with a radius of at the same distance from the nucleus as the center of the cavity, but in a direction perpendicular to the radio axis. Hardness ratios for 3, 4 and 7 keV gas, obtained from XSPEC simulated ACIS-S spectra of an absorbed MEKAL model with hydrogen column density equal to the galactic foreground value, the abundance of heavy elements set to 0.4 and a redshift of 0.0538 are also given.
The hardness ratio for the gas in the bright rim around the SW lobe is inconsistent with gas hotter than 4 keV at the level, and inconsistent with gas hotter than 7 keV at the level. The bright rim appears cooler than gas at the same distance from the nucleus in the direction perpendicular to the radio axis, but only at the 2.0 sigma level. No significant differences in hardness ratio between the cavity, its bright rim and the surrounding annulus are found in these data.
A temperature map of the central of Hydra A together with the 6 cm radio contours is shown in Fig. 2. The temperature map was computed following the technique of Houck, Wise, & Davis (2001 in preparation). Using the ACIS-S3 Chandra observation of Hydra A, a grid of adaptively sized extraction cells were selected to contain a minimum of 3000 counts each and then fit with a simple MEKAL thermal plasma model including a foreground Galactic absorption fixed at the nominal value of . The abundance was also held fixed at a value of 0.40, consistent with the values determined by David et al. (2001). Temperature maps computed allowing and to vary show similar structure.
The main result here is that the bright rim appears to be at least as soft (cool) as ambient gas at the same radius. This is the most puzzling feature of these observations, and is discussed at length below. The situation is similar for the cavities in the Perseus Cluster (Fabian et al., 2000). From the temperature map, we also note that the the cooler gas extends outward, beyond the cavities, along the direction of the radio source axis.
McNamara et al. (2000) found that compared to the surrounding emission there is a total deficit of about 2000 counts within the SW cavity, in the energy band 0.5 – 7.0 keV. We can use this to constrain the location of the cavity relative to the plane of the sky. For the ambient temperature of 3.4 keV (David et al., 2001), we can convert the count deficit into an emission measure. Treating the cavity as a sphere of radius 20 kpc, we can then convert this to a gas density. Given the uncertainty in the count deficit, the result, , is close to the density of ambient gas at the same radius ( at kpc; David et al., 2001). In order to produce such a large deficit, the the cavity must be nearly devoid of X-ray emitting gas, and the projected distance from the center of the cavity to the nucleus is close to the actual distance. Since at kpc, the radio axis cannot be much more than from the plane of the sky.
The geometrical uncertainties and the variation in the ambient gas properties from one side to the other of the SW cavity make it difficult to disentangle “background” cluster emission from emission within the cavity, preventing us from placing stringent quantitative limits on the level of X-ray emission within the cavity. However, we can place limits on emission by hotter gas within the cavity. To do this, first we fit a single temperature MEKAL model to the spectrum of the SW cavity, to account for “background” cluster emission, then we fit a two temperature model, with the lower temperature fixed at the value found from the single temperature fit. The single temperature fit gives (at 90%) keV and an abundance of 0.4, consistent with the ambient gas temperature and abundance at kpc (David et al., 2001). Abundances were fixed at this value in the two temperature model, leaving only the normalization of the two thermal components as free parameters in the fit. 90% upper limits (for one interesting parameter; ) on the normalization of the hotter component are given in Table 3, as fractions of the total emission measure, and as upper limits on the density of a uniform gas filling the cavity. Although it is not our main focus here, these limits place some constraint on the nature of the “radio plasma” in the cavity. We note that for keV, the pressure of the hot component could exceed the ambient pressure in the cavity.
3 Shock processes and the bright rim
As discussed above, there is little evidence for any X-ray emission in the immediate region of the radio lobes, that is in the radio lobe “cavities.”. Our focus is on the nature and origin of the X-ray emission surrounding the cavities. Apart from the cavity, the most significant feature of this region is the rim of bright emission surrounding the SW cavity (we assume that the structure of the NE cavity is similar). Since there is no evidence of non-thermal emission, our discussion is based on the assumption that the X-ray emission is entirely thermal.
The simplest explanation for the presence of the bright rim is that the expanding radio lobe is compressing (shocking) the surrounding gas, and we consider this next, in §3.1. However, while we cannot rule it out, it is not consistent with soft emission from the bright rim. Even if the radio lobes are not driving shocks now, in the standard model, the initial radio outburst drives shocks (e.g. Heinz et al., 1998), so we consider some other shock processes that may have played a role in the formation of the bright rims. In §3.2 we show that shock induced cooling does not help to explain the presence of the cooler gas. In §3.3, on the assumption that the Faraday screen lies close to the SW radio lobe, we show that the magnetic pressure near to the lobe may be significant. We then show that the magnetic field in this region may be enhanced by shocks. However, the presence of a magnetic field in the shock increases the entropy jump in the gas, so does not help to explain the presence of the cool gas around the radio lobes.
3.1 Radio lobe driven shocks
In view of the energetic nature of radio sources, and this one in particular, we consider whether expanding radio plasma in the cavities is driving a shock into the surrounding intracluster medium. McNamara et al. (2000) have already argued that there is no evidence for a shock in Hydra A, while Fabian et al. (2000) and Blanton et al. (2001) find similar results in Perseus and A2052. Here we consider the issues in more detail, showing that strong shocks around the cavities would be easily detected, hence that any shocking of gas around the cavities must be weak. We argue that the enhanced X-ray emission from the rim of the cavities is probably not due to a shock.
The sensitivity of the ACIS detectors on Chandra is a slowly decreasing function of gas temperature. This is quantified in Fig. 3, where we show relative count rate in the ACIS S3 chip in the bands 0.5 – 3 keV, 3 – 7 keV and 0.5 – 7 keV (dash-dot, dashed and solid curves, respectively) as a function of gas temperature, for gas with a fixed emission measure. The curves are normalized to give a count rate of 1 in the 0.5 – 7 keV band at a temperature of 3.5 keV. The ratio of 3 – 7 keV to 0.5 – 5 keV count rate is also shown (dotted). Note the very modest decline ( percent) in the 0.5 – 7 keV count rate as varies from 3.5 to 80 keV. This makes it clear that hot gas is not easily hidden.
As well as raising the temperature, a shock compresses gas, tending to increase its brightness. This is illustrated by the uppermost curve in Fig. 3, which shows the count rate in the 0.5 – 7 keV band for a fixed mass of gas shocked from 3.5 keV. That is, it shows the relative count rate from a fixed amount of gas that has been compressed by the appropriate factor for a shock that would raise it from 3.5 keV to the given temperature. Even for a postshock temperature of 80 keV, shocked gas is about 2.7 times brighter than the unshocked 3.5 keV gas. Thus, shocked gas will generally be brighter than unshocked gas, at least until it returns to local pressure equilibrium. This can only fail under the most extreme conditions, where the postshock temperature is well in excess of 80 keV.
We now consider a simple model of a shock driven by an expanding radio lobe. In this model a jet is assumed to feed energy into the cavity, causing it to expand supersonically and drive a shock into the surrounding gas. Following Heinz et al. (1998), we assume that energy is fed into the lobe at a constant rate, and that the lobe plasma is relativistic (). To keep the model simple, we also assume that the shock expands into uniform gas and so is spherical. As discussed below, radiative cooling can be ignored during passage of the shock.
The state of this model is completely determined by the ratio of the amount of energy injected into the lobe to the initial quantity of thermal energy in the region swept up by the shock. At first, injected energy dominates and the shock is strong. During this stage the shocked gas forms a thin shell between the expanding radio lobe and the shock. The shocked flow is self-similar, with the shock radius given by , where is the density of the unshocked gas, is the rate at which the jet feeds energy to the cavity and is the time. The width of the shocked gas is . As it expands, the shock weakens and the shell of swept up gas thickens. At late times, when the shock is very weak, the pressure is nearly uniform, and the expanding lobe is surrounded by a layer of hot shocked gas that connects smoothly to the surrounding ambient gas.
We obtained surface brightness profiles for this model by embedding the spherically symmetric shocked flow into a cube of uniform (unshocked) gas, and projecting the resulting X-ray emission onto the sky, using the conversion to Chandra count rate given in Fig. 3. The length of the cube was set to 55 kpc, to give the observed cluster background count rate ( in ACIS-S) for the ambient (unshocked) gas density at 30 kpc from the cluster center (; David et al., 2001). Fig. 4a shows the resulting 0.5 – 3 keV and 3 – 7 keV surface brightness profiles (in arbitrary units, but with consistent relative normalization) at a time when the pressure jumps by a factor of 1.65 in the shock (shock Mach number of 1.23). At this stage, the ratio of the energy injected to the thermal energy swept up is 1.1. Fig. 4b shows the corresponding 3 – 7 to 0.5 – 3 keV hardness ratio profile. The preshock temperature was set to 3.67 keV to match the hardness ratio in the region around the SW cavity, outside the bright rim (; Table 2).
Although this model shows about the right peak contrast in surface brightness between the bright rim and the surrounding region, averaged over the rim region to correspond to Table 1, the contrast is 12% instead of the observed 20%. On the other hand, the average surface brightness of the rim is 52% greater than that of the cavity, considerably larger than the observed brightness ratio (and formally unacceptable). Although it is poorly determined, the model gives about the right relative width for the rim and cavity. It predicts that emission from both the shocked rim and the cavity should be harder than from the surrounding gas, with a hardness ratio of 0.103, marginally inconsistent with what is observed (2.7 sigma too high, allowing for the error in hardness of the rim and of the surrounding region).
The near constant, elevated hardness ratio for the whole of the shocked region is a robust feature of these models. Lines of sight passing through the cavity also pass through shocked gas in front of and behind the cavity, adding a similar hard component across the whole shocked region.
Figs 5a and b, are the same as Figs 4a and b, but for a shock pressure jump close to 5.0 (Mach number ). In this case, the energy injected is about 2.7 times the thermal energy swept up. The surface brightness profile shows a narrower, brighter rim. However, the jump in average surface brightness from the unshocked region to the rim is 22%, close to the observed value. The jump from the cavity to the rim is 61% for this model. The hardness ratio in the shocked region is 0.113, about 3.9 sigma too high.
Interpretation of these results is complicated by non-uniformity of the gas surrounding the cavity and the geometric uncertainties. Neither model is a good fit to the data, but, given the uncertainties, it is hard to completely exclude a weak shock with our data. We will adopt the position that the Mach 1.23 shock is about the strongest that is consistent with the data. For this model, the pressure in the lobe is close to 1.3 times the pressure of the unshocked gas. We emphasize that, while we cannot completely rule out models in which the radio lobe is mildly overpressured, such a model is barely consistent with what is observed. The observations certainly do not suggest that the radio lobes are more than mildly overpressured compared to the ambient gas.
If the unshocked gas were multiphase (Fabian, 1994), it would not significantly change the appearance of the shock as deduced here. Shock strength depends on the pressure jump, so that a multiphase gas starting in local pressure equilibrium would experience much the same density and temperature jump in every phase. Since apparent brightness is not sensitive to gas temperature (Fig. 3), the brightness of all phases would be affected in much the same way by the shock. Thus, the phase that predominates the emission would be little altered by a shock, and the surface brightness and hardness profiles would not be much different from those for single phase gas.
3.2 Shock induced cooling
Our purpose here is to show that shock induced cooling is negligible for the gas around the radio lobes. In general, a shock weakens quickly as it expands. For example, in the model used above, while the shock is strong (self-similar), the postshock pressure decreases with shock radius as (more slowly than a point explosion due to the energy injection). As a result, after gas is swept up by the shock, its pressure declines significantly in one shock crossing time, , where is the shock velocity. In most cases, the gas pressure will eventually return close to its value before the shock, in a few sound crossing times for the region significantly affected by the shock.
The cooling time of the gas is
| (1) |
where , , and are the pressure, temperature, electron and proton number density of the gas, respectively, and is the cooling function. Under an adiabatic change , so that the cooling time scales as . This is a decreasing function of temperature for the range of temperatures of interest, so that as the gas pressure declines after passage of the shock the cooling time increases (unless cooling is fast enough to make the pressure change significantly non-adiabatic). When the shocked gas eventually returns to near its preshock pressure, it will have greater entropy due to the shock. This almost inevitably means that its cooling time is ultimately increased by the shock.
Thus, if the shock is to enhance cooling significantly, the cooling time of the gas immediately behind the shock needs to be comparable to the shock crossing time. Taking the temperature, electron density and abundance of the gas in the vicinity of the lobes as 3.4 keV, and 0.4 solar, respectively (David et al., 2001), its cooling time y. This is about 2 orders of magnitude longer than the sound crossing time of the lobes, which is close to y for a radius of 20 kpc (the sound crossing time to the center of the cluster is about 50% longer). The shock crossing time is shorter than the sound crossing time, so that in order for shock induced cooling to be significant, the postshock cooling time needs to be much shorter than the preshock cooling time.
For gas hotter than keV, cooling is mainly due to thermal bremsstrahlung, so that and . For a ratio of specific heats , the shock jump conditions may be written as
| (2) |
and
| (3) |
where subscripts ‘0’ and ‘1’ refer to preshock and postshock conditions respectively, and
| (4) |
is the square of the shock Mach number minus 1 ( measures shock strength). Using these results, it is straightforward to show that the postshock cooling time is minimized for and the minimum postshock cooling time is 0.62 times the preshock cooling time.
Although the cooling function is not exactly proportional to , the essential result, that the decrease in cooling time in a shock is modest at best, is inescapable. In order for the postshock cooling time to be comparable to the shock crossing time, the preshock cooling time would need to be close to the sound crossing time. If that were the case, then the gas could barely be hydrostatic. In any case, from the numbers given above, the cooling time is roughly 2 orders of magnitude greater than the sound crossing time. In the same manner, we can rule out appreciable shock induced cooling in all similar systems.
This argument applies equally well to shock induced cooling associated with a shock enveloping the two radio lobes, as described by Heinz et al. (1998). The cool gas in the vicinity of the radio lobes is not the result of shock induced cooling.
3.3 Magnetohydrodynamic shocks
Like many cluster center radio sources, Hydra A has a large rotation measure (Taylor & Perley, 1993), up to or more for the SW radio lobe. The gas in the immediate vicinity of the radio lobes is an excellent candidate for the Faraday screen. Indeed, if the difference in Faraday rotation between approaching and receding jets is due to the extra path to the receding jet (Garrington et al., 1988), then the bulk of the Faraday rotation must arise in the region close to the lobes.
In view of this, we take the depth of the Faraday screen to be comparable to the size of the lobes, that is kpc. The rotation measure map of Taylor & Perley (1993) shows coherent structure on a scale of about , so we take the coherence length of the magnetic field to be kpc. The rotation measure is if the field is uniform and along the line of sight, but this is reduced by a factor of roughly due to random variation of the field direction along the line of sight (all quantities in the units used here; e.g. Kim et al., 1991). Taking , as above, requires a magnetic field strength in the Faraday screen of up to (exceeding the equipartition field strength in the lobes; Taylor et al., 1990), although a more typical value would be . For a gas temperature of 3.4 keV, the gas pressure is , while the magnetic pressure is up to , approaching 30% of the gas pressure. The magnetic field strength is quite uncertain. If the main part of the Faraday screen is more closely wrapped around the lobes, then the field strength could be large enough to make the magnetic pressure dynamically important. In view of this, it is interesting to consider what happens to the gas and magnetic field in a shock.
There are two matters of interest here. First, could shocking of the gas help to account for the strength of the magnetic field in this region, hence the presence of the Faraday screen? Second, if gas in the X-ray bright rim around the cavities is in local pressure equilibrium, then the gas in it must have higher density, hence lower entropy, than the surrounding gas. If the magnetic pressure in this gas is also significant, then its thermal pressure must be lower than that of the ambient gas, requiring even lower entropy to get the same X-ray brightness. We consider how a magnetic field can affect these things in a shock.
A general magnetohydrodynamic (MHD) shock can have one of three forms, Alfvén, slow or fast mode (e.g. Melrose, 1986). For the case of interest, where the magnetic pressure is smaller than the gas pressure and the shock is driven by excess pressure, the mode of interest is always the fast mode. In order to keep the discussion simple, we will consider in detail only the case of a transverse MHD shock, where the shock propagates perpendicular to the magnetic field, but we have done the calculations for shocks at any inclination to the field. For a transverse shock, only the magnitude of the magnetic field changes in the shock, and the component of velocity parallel to the shock front is continuous at the shock, so we can choose a frame in which the flow is perpendicular to the shock front. In that frame, the shock jump conditions may be written
| (5) | |||||
| (6) | |||||
| (7) |
and
| (8) |
where , and are the gas density, velocity and pressure, respectively, is the magnetic field, and subscripts ‘0’ and ‘1’ refer to preshock and postshock values, respectively. The specific enthalpy is , where is the ratio of specific heats (we assume ). The Alfvén speed, , is given by .
Defining the shock compression ratio , we readily deduce from the jump conditions that and . Using these in the momentum and energy jump conditions then gives
| (9) |
where is the speed of sound in the unshocked gas, . This equation determines the shock speed, , in terms of the compression ratio and the physical properties of the unshocked gas. Note that, as for hydrodynamic shocks, the maximum compression ratio is (for ). This applies to MHD shocks at any angle to the field.
We can use these results to determine the gas pressure jump,
| (10) |
where is the standard measure of the ratio of thermal to magnetic pressure in the unshocked plasma (e.g. Melrose, 1986), and for the case of interest here. Magnetized and unmagnetized gas in local equilibrium need to have the same total pressure, , where is the magnetic pressure. A shock propagating through both will also produce nearly the same jump in total pressure. Thus, to compare the effects of shocks in magnetized and unmagnetized gas, we need to compare shocks that produce the same jump in total pressure, which is
| (11) |
The effect of the shock on the relative size of magnetic and gas pressure is measured by
| (12) |
This is plotted as a function of total pressure jump in Fig. 6, for a few values of . From the figure we see that moderately strong shocks, with total pressure jumps , can produce a modest decrease in . However, the reduction is no more than about 13%. Strong shocks always increase , i.e. the gas pressure is larger relative to the magnetic pressure after a strong shock. Although no results are shown here, if the angle between the shock front and the direction of the magnetic field exceeds about , can only increase in the shock.
The tendency of shocks to increase is due to the upper limit on shock compression. Since this cannot exceed a factor of 4, the magnetic field increases by 4 at most, and the magnetic pressure by no more than a factor of 16. On the other hand, there is no limit on the increase in thermal pressure. As a result, thermal pressure is always dominant in a sufficiently strong shock.
As noted above, the (total) pressure will generally return close to its original value after passage of a shock. Under adiabatic expansion, the gas pressure varies as , but the variation of depends on whether the expansion is primarily 1-dimensional, giving , isotropic, giving , or somewhere in between (we ignore the singular case of 1-d expansion parallel to the magnetic field). Because of this, might change in either direction during re-expansion. However, for the self-similar shock flow of §3.1, the re-expansion is isotropic, so that . As long as magnetic pressure is not dominant and the flow is roughly spherical, we can expect similar behaviour. Since gas pressure dominates after the shock, the re-expansion will decrease the density by about a factor of . From Fig. 6, we can see that this would give a net reduction in , provided that the shock is not too strong.
Shocks where the magnetic field is not parallel to the shock front produce a greater increase in than the transverse shocks considered here. In particular, if the field is perpendicular to the shock front, the increase in will not be undone by re-expansion. Nevertheless, if the orientation of the field relative to the shock front is random, then the typical angle between shock front and field is , and it remains true that a shock producing a total pressure jump of , followed by isotropic re-expansion will cause a net reduction in . Thus, as long as the shock is not extremely strong, its net effect is to decrease . So repeated shocking may help to account for the moderately strong magnetic field in the vicinity of the extended radio source.
We now consider the effect of a MHD shock on entropy. Using as a measure of entropy, the entropy jump in the shock is
| (13) |
This is plotted as a function of the jump in total pressure for a few values of in Fig. 7, where we see that the magnetic field increases the shock entropy jump (also true for any angle between the shock and magnetic field). This result is closely related to the rise in in the shock. Since a strong shock is always dominated by gas pressure, the rise in gas pressure, hence entropy, must be greater in the presence of a magnetic field.
This has the opposite sense to that required to explain the bright rim around the radio lobes. If the bright rims of the radio lobes do have a significant magnetic field, then shocks will increase the entropy of the gas in them more than the entropy of other non-magnetized gas. In local pressure equilibrium after such shocks, the magnetized gas would then be less dense and less X-ray luminous than surrounding non-magnetized gas. Either this gas is not significantly magnetized, or it has not been subjected to significant shocks. Alternatively, the dense gas may be replaced in each radio outburst.
Note that no attempt was made to allow for the effects of particle acceleration on these MHD shocks (e.g. Berezhko & Ellison, 1999). If particle acceleration is very efficient, it can produce a substantial cosmic ray pressure in the shock and the results above are modified significantly. Of course, in that case the shocked gas would also be a strong radio source.
4 Implications of radio observations
Based on the radio properties of Hydra A, the radio lobes are not likely to be currently driving shocks into the intracluster medium. The physical quantity controlling shocks is excess pressure (e.g. equation 2), so that the pressure in the lobes must exceed the ambient gas pressure if they are to drive shocks into the intracluster gas. However, under the usual assumptions, Taylor et al. (1990) found that the equipartition pressure in the radio lobes is about an order of magnitude smaller than the pressure of the hot gas. This is unlikely to be the actual pressure in the lobes (it would imply that they are collapsing in about 1 sound crossing time), and so requires that the radio source is a long way from equipartition, has a low filling factor, or most of the pressure in the lobes is due to protons (or electrons with low gamma, etc.). The same applies to the radio lobes in Perseus and A2052 (Fabian et al., 2000; Blanton et al., 2001). While this does not prove that the lobes cannot be overpressured, it argues against this, supporting the case that they are not driving shocks now.
Using the spectral properties of the remote lobe N of the radio nucleus, Taylor et al. (1990) estimated the age of the radio source to be y. Similar reasoning would make the inner lobes about an order of magnitude younger. Also based on synchrotron aging arguments, they found that the flow velocity in the SW lobe . While we cannot rule out mildly supersonic expansion, the Chandra data for Hydra A are inconsistent with expansion of the SW lobe at Mach 2, i.e. a shock velocity of in 3.4 keV gas, at the level. A shock at moving into 3.4 keV gas would produce a postshock temperature close to 97 keV. The shocked gas would be highly visible to the Chandra detectors (extrapolating Fig. 3 slightly) and hard, and we can rule this out. More generally, the lobes cannot expand or move through the 3.4 keV intracluster gas supersonically without creating a shock. Furthermore, at such highly supersonic speed, the shock would remain close to a moving lobe, making it easy to find. While we cannot rule out that plasma circulates within the radio lobe at , this is implausible, and it seems more likely that one or more of the assumptions used to determine this velocity is invalid. The preponderance of cool gas close to the radio lobes (Fig. 2) argues strongly against supersonic motion of the lobe boundaries. In that case, the region around the SW lobe will be close to local pressure equilibrium, and the X-ray luminous gas in the rim surrounding the lobe must be cooler than adjacent, less X-ray luminous gas. This is consistent with a reduced hardness ratio in the bright rim around the lobe (Table 2).
5 Discussion
While we cannot rule out a weak shock producing the bright rim in Hydra A, the evidence does not favour this. Furthermore, in the Perseus cluster where the data are clearer, the bright emission around the cavities is the coolest in the central region of the cluster (Fabian et al., 2000). In the following we assume this is also the case in Hydra A.
This leaves open the issue of the origin of the cool gas in the bright rim. If it is cooler than the surrounding gas while at the same pressure (or lower, §3.3), then it has lower entropy. Unless it is produced somehow by the presence of the radio lobes (no mechanism considered above does this), then it must come from where the lowest entropy gas normally resides, at or near to the cluster center (the entropy gradient is weak, but non-zero in the central region of the Hydra A Cluster; David et al., 2001). In that case the most obvious way to move the gas is by some form of entrainment, as proposed to account for cool gas associated with the radio structure in M87 (Böhringer et al., 1995; Churazov et al., 2001). However, the large mass of gas involved (even more so in Perseus), and its association with the lobes rather than the jets, suggest that the rising lobes themselves have pushed or dragged the low entropy gas to its current location. A rising “bubble” or cavity moves when denser gas flows down past it. So, while the buoyant force on the cavity is sufficient to move a mass of gas comparable to that displaced by the cavity, some physical mechanism must communicate this force to the surrounding gas to entrain it. Gas and cosmic ray pressure in the cavity or magnetic stresses may do this, but it is unclear whether the resulting stresses are stable enough to lift an appreciable mass of gas with the cavity. For this to work, the radio lobes and cavities must also have risen from a place closer to the active nucleus where they were formed.
Another issue is how the dense gas in the rim remains where it is. If gas in the bright rim is denser than the surrounding gas, then it is negatively buoyant. By Archimedes’ principle, the net force per unit volume on overdense gas is , where is the difference between its density and that of the ambient gas, and is the acceleration due to gravity, so the acceleration of the gas is , where is its density. Unless this is counterbalanced, the gas will accelerate inward, falling a distance in . Taking the gravitating mass within 30 kpc of the cluster center to be (David et al., 2001) and kpc, about the radius of the shell of cool gas, this gives an infall time y. We do not have a good estimate for , but the shock simulations suggest that the density in the shell is about twice the ambient gas density, giving y. If the age of the lobe exceeds this, then the cool gas should have fallen away from the radio lobe if it was not held in place. This issue is closely related to the need for a force to drag the gas along with the rising lobe.
There are two ways that the gas might be supported by magnetic fields. Either magnetic stresses could tie it to the cavity, supporting the excess weight of the gas by the positive buoyant force on the cavity, or the entrained gas might have acquired a strong but inhomogeneous magnetic field. In the former case, the low entropy gas would be reasonably homogeneous and its pressure close to the ambient pressure. In §3.3 we estimated with a coherence length of in the Faraday screen. Such a field would produce a force per unit volume of about . On the other hand, if the overdensity, , in the cool gas is similar to the ambient density at 30 kpc from the cluster center (), then using the numbers above for at 30 kpc, the bouyant force per unit volume is . The magnetic field is quite uncertain, but these numbers are sufficiently close to make this a serious possibility.
Alternatively, if the gas consists of an intimate, but inhomogeneous, mixture of cool gas and strong magnetic field, then the mean density of the mixture can be close to the ambient density, but the X-ray brightness greater (Böhringer et al., 1995). To illustrate this, consider the extreme case of a mixture of regions devoid of gas with regions devoid of magnetic field. Regions devoid of gas would have a magnetic pressure equal to the ambient gas pressure, requiring (, keV in the ambient gas) , which is large compared to the equipartition field in the lobe (Taylor et al., 1990). If the gas in this mixture has density and filling factor , then the mean density of the mixture is . To be neutrally buoyant, this must equal the ambient density, , and then the mean emission measure per unit volume of the mixture , so this region is brighter.
The former means of supporting the gas agrees better with the properties of the Faraday screen. Furthermore, the magnetic stresses required to keep the cool gas close to the radio lobe are much the same as those required to explain how this gas was lifted by the rising lobe. The cavity would have formed closer to the AGN and risen to its current location in about its buoyant rise time (cavity radius , distance to cluster center , ; David et al., 2001). Although such a system may not be very stable, this is not much longer than the sound crossing time, and instabilities may have developed slowly enough to allow it to evolve to its current state. The patchy gas distribution around the cavity in M84 (Finoguenov & Jones, 2001) may represent a later stage of such a cavity, when the instability is well developed and a large part of the cool gas has fallen back to the center. There are also signs of instability in the Chandra image of A2052 (Blanton et al., 2001). In particular, the spur of bright emission in the northern radio cavity of A2052 may be due to part of the rim falling inward. In a cluster, the weight of the cool gas could limit the rise of the cavity until it falls away. If the cavity is not disrupted in this process, it could then rise relatively slowly, with the rate of rise determined by the rate at which the low entropy gas detaches from it. We note that the lifting of cool gas described here differs from that invoked by Churazov et al. (2001), where the gas is pulled along in the wake of the rising cavity. Quilis et al. (2001) also model a hot bubble forming near a cluster center. While their model shows a transient density enhancement at its outside edge during bubble formation, it does not show a dense rim like that surrounding the SW lobe of Hydra A.
The north – south extension of the cooler gas, outside the region of the cavities (Fig. 2) suggests that the lifting of low entropy gas with rising “bubbles” of radio plasma is an ongoing process. The prevalence of radio sources in cooling flow clusters (Burns, 1990), combined with their relatively short lifetimes, suggests that there are repeated radio outbursts. The extended region of cooler gas may be the trail left by the rise of earlier cavities. This ongoing process is also hinted at by the X-ray feature associated with more remote radio structure north of the cluster center (Forman et al., 2000). The maximum mass that could be supported by the SW cavity at its present position is the mass of gas it displaces ( kpc, ). If such a mass was lifted out of the cluster center in a radio outburst every y, it would amount to outflow of about , largely accounting for the lack of mass deposition by the cooling flow (see David et al., 2001). On the other hand, if the radio plasma is relativistic, the total energy in the cavity is (as above and keV), and the mean energy input associated with the cavities would be . This is comparable to the mean power needed to stop mass deposition by the cooling flow, , for and an initial temperature of gas in the cooling flow keV. Thus, if there is an efficient mechanism for lifting the gas with the cavities and for thermalizing some of the energy in the cavity, in the case of Hydra A the radio outbursts could be sufficient to balance the energy loss in the cooling flow (cf. Soker et al., 2001). Because the bubbles and associated cool gas rise much faster than the cooling gas flows inward, the bulk of the cooling flow is hardly affected by the outflow, and so would form a steady (homogeneous) cooling flow. This is essentially the situation outlined in David et al. (2001). Of course, Hydra A is an exceptionally luminous radio source, and it is not yet clear whether this could apply in other cooling flow clusters. The energetics of the simulation by Quilis et al. (2001) resemble those of Hydra A. However, their simulation was run for a time only about equal to the initial central cooling time of the gas, making it hard to draw conclusions about the long term effects of the energy injection on a cooling flow.
David et al. (2001) found that the iron and silicon abundances of the hot intracluster medium increase inward in the central kpc of the Hydra A Cluster. As they noted, the large-scale circulation described above would tend to mix heavy elements throughout the region of the circulating flow. The total mass of iron causing the excess central abundance is comparable to the total iron yield from type Ia supernovae in the cD galaxy over its lifetime. Together with the strong central concentration of the iron excess, this points to the cD galaxy as the source of the excess iron. However, half of the excess iron lies beyond kpc, so that its distribution is almost certainly more extended than the light of the cD galaxy, as we should expect if it is mixed outward. The extent of a steady cooling flow is determined by the time since the last major merger. While this is not known for the Hydra A Cluster, the cooling time at kpc is about y (David et al., 2001), so that the region of enhanced iron abundance coincides plausibly with the region of the steady cooling inflow. On the other hand, while some enriched gas can circulate out to kpc or beyond, if all of the gas did this, the heavy elements would need to replaced on about the cooling timescale in order to maintain the abundance gradient. Since the cooling time is less than y for kpc this seems implausible. It is more likely that part of the enriched gas circulates over a range of radius well inside kpc. This is consistent with the (unstable) buoyant lifting outlined above, where gas falls away from a cavity as it rises, so that different parts of the gas circulate over different ranges of . Although we do not have a detailed model for this process, it is evident that the abundance gradient will provide a strong constraint on such models if the excess heavy elements do all originate in the cD galaxy.
As shown in §3.3, moderately strong magnetohydrodynamic shocks can increase the ratio of magnetic to gas pressure. The magnetic field required to help carry the cool gas out with the cavity and to make the Faraday screen around the radio lobes may be enhanced by repeated moderate shocks due to outbursts of Hydra A. Alternatively, the magnetic field may be a relic of the radio activity in these outbursts, or due to a combination of these effects.
6 Conclusions
The cavity in the hot intracluster medium containing the SW radio lobe of Hydra A has a bright rim of X-ray emission. X-ray emission from this rim is marginally softer than that from ambient gas at the same distance from the center of the Hydra A Cluster.
We have considered a simple model in which the bright rim is due to a shock driven by the expanding radio lobe of Hydra A. This model predicts that X-ray emission from the cavity and rim is harder than the surrounding X-ray emission and does not fit the data well, but we cannot rule out models with a weak shock. The most likely interpretation is that gas in the bright rim is cooler than ambient gas, and this is consistent with what is found in the Perseus cluster. A temperature map shows that cooler gas extends along the radio axis of Hydra A, beyond the cavities.
Even though cooling times are relatively short, we have shown that shocks in Hydra A and similar systems are too fast to induce significant cooling of the gas. Furthermore, if the magnetic pressure is significant, then, for a given shock strength (total pressure jump), shocks induce a greater entropy jump in magnetized gas than in non-magnetized gas, so there does not appear to be any way that shocks can account directly for the presence of the cooler gas. On the other hand, repeated shocking may help to produce strong magnetic fields near to the center of the cluster.
The most plausible origin of the cool gas around the cavities is closer to the cluster center. If the cavities were formed deeper within the cluster core than we now find them, they could have lifted lower entropy gas from these regions as they rose. This requires a means of communicating the buoyant force on a cavity to surrounding gas, and the most likely candidate for this is magnetic stresses. In the Hydra A Cluster, the magnitude of the magnetic field required to do this is consistent with that required to account for Faraday rotation in the radio lobes. The amount of gas lifted in this way from the cluster center may be sufficient to balance inflow of low entropy gas due to the cooling flow.
References
- Berezhko & Ellison (1999) Berezhko, E. G., & Ellison, D. C., 1999, ApJ, 526, 385
- Bicknell & Begelman (1996) Bicknell, G. V., & Begelman, M. C., 1996, ApJ, 467, 597
- Blanton et al. (2001) Blanton, E. L., Sarazin, C. L., McNamara, B. R., & Wise, M. W., ApJ, 558, L15
- Böhringer et al. (1993) Böhringer, H., Voges, W., Fabian, A. C., Edge, A. C., & Neumann, D. M. 1993, MNRAS, 264, L25
- Böhringer et al. (1995) Böhringer, H., Nulsen, P. E. J., Braun, R., & Fabian, A. C., 1995, MNRAS, 274, L67
- Burns (1990) Burns, J. O., 1990, AJ, 99, 14
- Carilli et al. (1994) Carilli, C. L., Perley, R. A., & Harris, D. E., 1994, MNRAS, 270, 173
- Churazov et al. (2001) Churazov, E., Bruggen, M., Kaiser, C., Bohringer, H., & Forman, W., 2001, ApJ, 554, 261
- Clarke et al. (1997) Clarke, D. A., Harris, D. E., & Carilli, C. L., 1997, MNRAS, 284, 981
- David et al. (2001) David, L. P., Nulsen, P. E. J., McNamara, B. R., Forman, W. R., Jones, C., Ponman, T., Robertson, B., & Wise, M., 2001, ApJ, 557, 546
- Ekers & Simkin (1983) Ekers, R. D., & Simkin, S. M. 1983, ApJ, 265, 85
- Fabian (1994) Fabian, A. C., 1994, ARA&A, 32, 277
- Fabian et al. (2000) Fabian, A. C., Sanders, J. S., Ettori, S., Taylor, G. B., Allen, S. W., Crawford, C. S., Iwasawa, K., Johnstone, R. M., & Ogle, P. M., MNRAS, in press (astro-ph/0007456)
- Fabian et al. (2001) Fabian, A. C., Mushotzky, R. F., Nulsen, P. E. J., & Peterson, J. R., MNRAS, 321, L20
- Finoguenov & Jones (2001) Finoguenov, A., & Jones, C., 2001, ApJ, 547, L107
- Forman et al. (2000) Forman, W., David, L., Jones, C., Markevitch, M., McNamara, B., & Vikhlinin, A., 2000, in “Constructing the Universe with Clusters of Galaxies,” eds. F. Durret & D. Gerbal, IAP, Paris
- Garrington et al. (1988) Garrington, S. T., Leahy, J. P., Conway, R. G., & Laing, R. A., 1988, Nature, 331, 147
- Heinz et al. (1998) Heinz, S., Reynolds, C. S., & Begelman, M. C. 1998, ApJ, 501, 126
- Kim et al. (1991) Kim, K.-T., Tribble, P. C., & Kronberg, P. P., 1991, ApJ, 379, 80
- Kraft et al. (2000) Kraft, R. P., Forman, W., Jones, C., Kenter, A. T., Murray, S. S., Aldcroft, T. L., Elvis, M. S., Evans, I. N., Fabbiano, G., Isobe, T., Gerius, D., Karovska, M., Kim, D.-W., Prestwich, A. H., Primini, F. A., Schwartz, D. A., Schreier, E. J., & Vikhlinin, A. A., 2000, ApJ, 531, L9
- McNamara et al. (2000) McNamara, B. R., Wise, M., Nulsen, P. E. J., David, L. P., Sarazin, C. L., Bautz, M., Markevitch, M., Vikhlinin, A., Forman, W. R., Jones, C., & Harris, D. E. 2000, ApJ, 530, L135
- McNamara (2001) McNamara, B. R., in “Proceedings of XXI Moriond conference: Galaxy Clusters and the High Redshift Universe Observed in X-rays,” eds D. Neumann, F. Durret, & J. Tran Thanh Van
- Melrose (1986) Melrose, D. B., 1986, “Instabilities in Space and Laboratory Plasmas,” Cambridge University Press, Cambridge
- Pedlar et al. (1990) Pedlar, A., Ghataure, H. S., Davies, R. D., Harrison, B. A., Perley, R., Crane, P. C., & Unger, S. W., 1990, MNRAS, 246, 477
- Peterson et al. (2001) Peterson, J. A., Paerels, F. B. S., Kaastra, J. S., Arnaud, M., Reiprich, T. H., Fabian, A. C., Mushotzky, R. F., Jernigan, J. G., & Sakelliou, I., 2001, A&A, 365, L104
- Quilis et al. (2001) Quilis, V., Bower, R. G., & Balogh, M. L., 2001, MNRAS, in press (astro-ph/0109022)
- Schindler et al. (2001) Schindler, S., Castillo-Morales, A., De Filippis, E., Schwope, A., & Wambsganss, J., 2001, A&A, 376, L27
- Soker et al. (2001) Soker, N., White, R. E., III, David, L. P., & McNamara, B. R., 2001, ApJ, 549, 832
- Taylor (1996) Taylor, G. B. 1996, ApJ, 470, 394
- Taylor & Perley (1993) Taylor, G. B., & Perley, R. A., 1993, ApJ, 416, 554
- Taylor et al. (1990) Taylor, G. B., Perley, R. A., Inoue, M., Kato, T., Tabara, H., & Aizu, K. 1990, ApJ, 360, 41
- Vrtilek et al. (2000) Vrtilek, J. M., David, L. P., Grego, L., Jerius, D., Jones, C., Forman, W., Donnelly, R. H., & Ponman, T. J., 2000, in “Constructing the Universe with Clusters of Galaxies,” eds. F. Durret & D. Gerbal, IAP, Paris
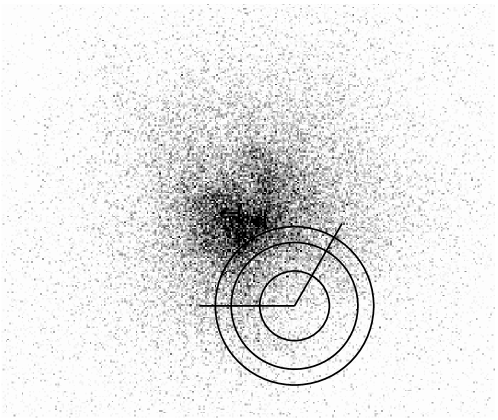
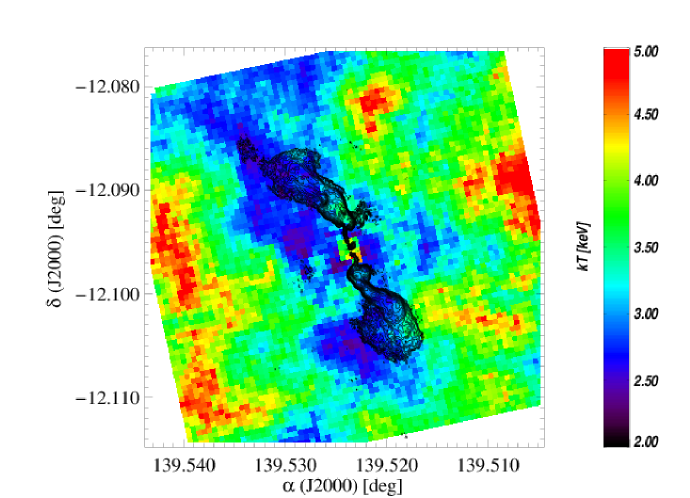


TABLE 1
Surface brightness in the SW lobe
| Annulus | Surface Brightness | error |
|---|---|---|
| (ct/pixel) | (ct/pixel) | |
| – | 2.260 | 0.047 |
| – | 2.724 | 0.034 |
| – | 2.285 | 0.032 |
Notes: Counts are from the combined, cleaned ACIS-I and ACIS-S data. Rings were centered on , (J2000). Only counts in the range of position angle – with respect to the center of the rings, and in the 0.5 – 7 keV energy range were included. Background subtraction was carried out using the same procedure as in David et al. (2001).
TABLE 2
Hardness ratios for regions around the SW cavity
| Region | –– | error |
|---|---|---|
| Cavity | 0.0808 | 0.0088 |
| Bright rim | 0.0799 | 0.0056 |
| Outside bright rim | 0.0932 | 0.0065 |
| Perpendicular to the radio axis | 0.0947 | 0.0049 |
| XSPEC simulated 3 keV gas | 0.0763 | |
| XSPEC simulated 4 keV gas | 0.101 | |
| XSPEC simulated 7 keV gas | 0.144 |
Notes: The first 3 regions coincide with the regions used in Table 1.
TABLE 3
Limits on hot gas emission from within the SW cavity
| Hot fraction | ||
|---|---|---|
| (keV) | (%) | () |
| 4 | ||
| 5 | ||
| 6 | ||
| 7 | ||
| 8 | ||
| 10 | ||
| 15 | ||
| 20 | ||
| 30 |
Notes: These are 90% upper limits for one parameter of interest () on the fraction of the emission measure from the SW cavity in a two temperature model that can come from a component of the given temperature. The 3rd column gives the electron density of a uniform gas filling the cavity that would give the maximum allowed emission measure for the hot component.