X-ray Evidence for Spectroscopic Diversity of Type Ia Supernovae:
We present the results of a detailed element abundance study of hot gas in M87, observed by XMM-Newton. We choose two radial bins, and ( for EMOS; hereafter the central and the outer zones), where the temperature is almost constant, to carry out the detailed abundance measurements of O, Ne, Mg, Si, S, Ar, Ca, Fe and Ni using EPIC-PN (EPN) and -MOS (EMOS) data. First, we find that the element abundance pattern in the central compared to the outer zone in M87 is characterized by SN Ia enrichment of a high (roughly solar) ratio of Si-group elements (Si, S, Ar, Ca) to Fe, implying that Si burning in SN Ia is highly incomplete. In nucleosynthesis modeling this is associated with either a lower density of the deflagration-detonation transition and/or lower C/O and/or lower central ignition density and observationally detected as optically subluminous SNe Ia in early-type galaxies. Second, we find that SN Ia enrichment has a systematically lower ratio of the Si-group elements to Fe by 0.2 dex in the outer zone associated with the ICM of the Virgo cluster. We find that such a ratio and even lower values by another 0.1 dex are a characteristic of the ICM in many clusters using observed Si:S:Fe ratios as found with ASCA. Third, the Ni/Fe ratio in the central zone of M87 is solar (meteoritic), while values around 3 times solar are reported for other clusters. In modeling of SN Ia, this implies a reduced influence of fast deflagration SN Ia models in the chemical enrichment of M87’s ISM. Thus, to describe the SN Ia metal enrichment in clusters, both deflagration as well as delayed detonation scenarios are required, supporting a similar conclusion, derived from optical studies on SNe Ia. We discuss implications of our results for observations of SN Ia and also suggest a link between the element abundances observed in the M87 X-ray halo with the observed characteristics of M87 globular clusters.
Key Words.:
galaxies: individual: M87 — galaxies: clusters: individual: Virgo — X-rays: galaxies — supernovae: general1 Introduction
Element abundance patterns favoring a strong role of SNe Ia in the iron group production, as indicated by solar and subsolar ratios of alpha-process elements (Mg and Si) to iron, were found in elliptical galaxies, groups of galaxies, and centers of clusters of galaxies (Finoguenov et al. 1999; Finoguenov & Ponman 1999; Hwang et al. 1999; Finoguenov, David, Ponman 2000, hereafter FDP; Dupke & White 2000b). As a consequence of the strong role of SN Ia in the enrichment of the hot gas, X-ray observations are well suited to put constraints on the element production by SN Ia.
Compared to previous results, largely provided by ASCA, the high collecting area of the XMM X-ray telescopes and the sensitivity at low and high energies now offers the possibility also to study the O, Ar and Ca abundance, as well as to improve on the statistical significance of measurements of other elements, like Si, S, Fe, Ni. Addition of the O abundance is particularly important for estimation of the SN II contribution, since other indicators, like Ne and Mg are flawed due to their proximity to iron L-shell complex (Mushotzky et al. 1996). Although, some O abundance estimates were already available with ASCA, calibration problems impose systematic uncertainties in the obtained results (e.g. Mushotzky et al. 1996), so ASCA’s estimates of the SN II role were based on the Si/Fe ratio, which has the disadvantage of Si being also contributed by SN Ia. Therefore knowledge of the Oxygen abundance provides the best means to separate the enrichment by the two types of supernovae.
| Z, A | EPN | EMOS | ||||
|---|---|---|---|---|---|---|
| units♮ | theory♯ | |||||
| O 16.00 | 0.546 (0.521:0.566) | 0.366 (0.341:0.402) | 0.535 (0.514:0.554) | 0.386 (0.365:0.411) | 8.51e-4 | 8.51e-4 |
| Si 28.11 | 1.121 (1.075:1.145) | 0.602 (0.557:0.650) | 1.242 (1.223:1.260) | 0.657 (0.632:0.673) | 3.55e-5 | 3.58e-5 |
| S 32.10 | 0.933 (0.884:0.964) | 0.406 (0.360:0.457) | 0.973 (0.951:0.995) | 0.406 (0.379:0.434) | 1.62e-5 | 1.84e-5 |
| Ar 36.33 | 0.953 (0.843:1.040) | 0.463 (0.322:0.587) | 0.851 (0.793:0.905) | 0.392 (0.318:0.465) | 3.63e-6 | 3.62e-6 |
| Ca 40.13 | 1.429 (1.273:1.562) | 0.786 (0.597:0.975) | 1.296 (1.207:1.379) | 0.622 (0.515:0.718) | 2.29e-6 | 2.19e-6 |
| Fe 55.92 | 0.599 (0.577:0.624) | 0.336 (0.308:0.363) | 0.650 (0.632:0.668) | 0.344 (0.320:0.360) | 4.68e-5 | 3.23e-5 |
| Ni 58.78 | 1.337 (1.163:1.628) | 2.573 (1.655:3.497) | 0.800 (0.000:2.532) | 1.78e-6 | 1.77e-6 | |
Note: — errors are quoted on the 68% confidence level. All element abundances are derived using the K-shell lines.
| Z, A | EPN | EMOS | ||||
|---|---|---|---|---|---|---|
| units♮ | theory♯ | |||||
| Ne 20.15 | 0.370 (0.271:0.483) | 0.447 (0.334:0.563) | 0.419 (0.356:0.485) | 0.290 (0.215:0.353) | 1.23e-4 | 1.24e-4 |
| Mg 24.34 | 0.590 (0.542:0.633) | 0.208 (0.145:0.277) | 0.630 (0.595:0.659) | 0.238 (0.203:0.275) | 3.80e-5 | 3.84e-5 |
| Ni 58.78 | 0.963 (0.852:1.078) | 0.612 (0.444:0.789) | 0.886 (0.800:0.965) | 0.978 (0.550:1.068) | 1.78e-6 | 1.77e-6 |
Note: — errors are quoted on the 68% confidence level. The Ni abundance is derived using the Ni L-shell lines.
♮ Reference abundance values, used in our (and most X-ray) abundance determinations with the results tabulated in columns (2–5). These units correspond to solar photospheric values from Anders & Grevess (1989).
♯ Solar abundances, as tabulated in Woosley and Weaver (1995). These units correspond to meteoritic values from Anders & Grevess (1989) and are used in Figs.1-4 to simplify the comparison with the commonly used logarithmic values of the abundance, .
With addition of observational data on many extra elements, X-ray observations become sensitive to various ad-hoc assumptions in the modeling of SNe explosion. For example, the O/Si ratio in SN II ejecta can place constraints on the energy release during the explosion (Nakamura et al. 2000). In this regard, the observation of M87, where SN Ia products dominate in the abundance pattern, potentially leads to a refinement of SN Ia models. Since enrichment of the intracluster gas typically requires SN Ia ( on scales of a BCG), it presents an extremely good averaging of any possible difference in the scenarios for SN Ia explosions. Since SNe Ia are adopted as standard candles for high-redshift distance measurements, understanding of SN Ia enrichment in clusters, where accumulation of SN Ia products might have started at redshifts of about 2 (Finoguenov, Arnaud, David 2001), can help to minimize the systematics of these measurements, resulting most importantly in constraints on the value for (Höflich, Wheeler & Thielemann 1998).
Data on SN Ia reveal that brighter events tend to have a broader light-curve. This behavior is caused by a variation in a SN Ia yield for (e.g. Mazzali et al. 2001) and is modeled by a variation in the density of the deflagration-detonation transition (DDT) (Khokhlov 1991, however see Niemeyer 1999). Allowed densities typically take a range of g cm-3 and are reached (with time) by the expanding WD from originally a few times g cm-3 (therefore these models bear the name delayed detonation). A lower transition density is associated with a reduced 56Ni production and consequently with a dimmer SN Ia. Umeda et al. (1999) proposed that it is the mass fraction of Carbon in the CO WD that controls the DDT, such that a lower Carbon mass fraction corresponds to a dimmer event. In addition, Umeda et al. (1999) point out that a smaller C/O ratio produces a small buoyancy force, thus leading to a slower deflation and to a dimmer SN. Using C/O as a determining factor, Umeda et al. (1999) showed that the observed systematics in SN Ia could be consistently explained from the point of view of the galactic evolution, as the C/O ratio varies systematically with stellar mass (Umeda et al. 1999a). Some SN Ia may not exhibit any DDT, but instead an acceleration of the burning front propagation from initially a few per cent up to 30 per cent of the sound speed. These models are called convective deflagration (Nomoto et al. 1984, Iwamoto et al. 1999). In our modeling we will use the nucleosynthesis calculations of Nomoto et al. (1997), where convective deflagration is represented by the W7 model and three delay-detonation models WDD1, WDD2, and WDD3 are given, where the last digit refers to the DDT density in units of g cm-3. Differences in nucleosynthesis yields among the models, important for our observation, could be subdivided into two groups: Si-Ca/Fe and Ni/Fe ratios. The former is an indication of incompleteness of the Si group burning into the iron group and the latter, which is a tracer of 58Ni/56Fe is an indicator of neutron-rich isotope production, which depends on the efficiency of electron capture in the core of the exploding white dwarf. Fast deflagration, like the original W7 model of Nomoto et al. (1984) and its combinations with slow initial deflagration (WS15W7), typically yields larger 58Ni/56Fe ratio, compared to slow initial deflagration followed by detonation: 58Ni/56Fe is 4.3, 2.7, 1.5, 1.3 solar for W7, WS15W7, WS15DD3, WS15DD1 models, respectively (Iwamoto et al. 1999).
The particular interest in the observation of M87 comes from its proximity, which allows us to resolve the temperature structure, complications due to X-ray emission of central AGN, the jet and the radio-lobes and to achieve high photon statistics, needed in order to determine less abundant elements. In view of the finite spatial resolution of the X-ray telescopes, we can derive element abundances much closer to the center in M87 than for any other central cluster region and thus measure the element abundance patterns within a region mostly dominated by SN Ia ejecta.
2 Results
This Paper reports a detailed analysis of the element abundances from the data of the XMM-Newton (Jansen et al. 2001) performance verification observation of M87, described elsewhere (Böhringer et al. 2001; Belsole et al. 2001). In the following analysis we will exclude the spatial zones contaminated by the X-ray emission from the jet and radio-lobes. Initial results of the determination of element abundances in M87 are presented in Böhringer et al. (2001) and Molendi & Gastaldello (2001), where strong gradients where found in the Fe, Si and S abundance, while the O abundance did not show significant variations. In the central half arcminute, an abundance decrease in all the elements is observed, which may be explained by resonance scattering and temperature structure (Matsushita et al. 2001a). The de-projected temperature profile exhibits two shelves at and radii (hereafter the central and the outer zones), at the level of 1.6 and 2.5 keV (for more details of the de-projection technique and the choice of the regions for spectrum extraction see Matsushita et al. 2001b, hereafter MBFB). Therefore, at these radii, while achieving high statistics in the spectral extraction we still have a simple temperature model, which assures the robustness of our results. For the central region, the removal of projection effects of the outer cluster emission is done by subtracting the scaled spectra from outer parts. Since the cluster gas temperature is nearly isothermal for radii far beyond , such a subtraction is not necessary for the outer zone. We use the XMMSAS version of April 2001, where e.g. for EPN it is for the first time possible to estimate and remove the induced background due to the Out-of-Time Events, include split events into the spectral analysis, and to produce a refined CTI (charge transfer inefficiency) correction. We use the vignetting corrected data according to the in-flight calibrations. We use Lockman hole observations for background subtraction. The EMOS and EPN detector response matrices used are from the June 2001 release. More details on the primary data reduction are given in MBFB.
For a 17 Mpc distance to M87, the angular scale is 5 kpc/arcminute and the radial boundaries for the inner and the outer zones correspond to 5–15 kpc and 40–80 kpc, respectively. We note that for our choice of the extraction radii, the effects of resonance scattering are not important. For example the optical depth for O lines responsible for the abundance determination is less than 0.4 (Matsushita et al. 2001a). While such an estimate is complicated for Fe, we note that the Fe abundances derived using L- and K-shell lines agree well with each other, while effects of resonance scattering differ.
Two specific approaches applied in the spectral modeling have to be noted: to account for the calibration uncertainties in the low-energy response of the EPN we limit the spectral fits to energies above 0.5 keV. To avoid problems with the mismatch between the low and high energy vignetting in the EMOS calibration files we fit the low and high energy part of the EMOS spectrum for the outer zone separately. The residuals in the EMOS spectral fitting in the 1.2–2.0 keV energy range, which result in a 10% higher Si abundance compared to the EPN values, are attributed to calibration problems and cannot be corrected for at present. This also reduces the confidence in the Al abundance determination. Therefore we postpone the study of the Al abundance to a later work.
Fits to the EPN data for the outer zone are carried out in the 0.5–7 keV band, because at higher energies the spectrum is dominated by the background. This prevents us from a determination of the Ni abundance with the EPN using K-shell lines for the outer zone. In all other cases, the spectral fitting is done using the 0.5–10 keV energy band. In determining the data for Table 2, where only measurements using K-shell lines are presented, we excise the 0.7-1.6 keV energy range from spectral analysis, which also removes a dependence of the derived temperature on the shape of Fe L-shell peak. The temperature is determined instead by the shape of the bremsstrahlung radiation at high energies. We use the MEKAL model (Mewe et al. 1985, Mewe and Kaastra 1995, Liedahl et al. 1995), fixing the He, C and N abundance to their solar values. Given the systematics in using the present-day plasma codes to fit the Fe L-shell line complex (Phillips et al. 1999), some care is needed in the abundance determination using K-shell lines for Ne and Mg (Mushotzky et al. 1996) and L-shell lines for Ni, as their lines are located within the blend of Fe L-shell lines. The exact spectral shape of this blend is sensitive to the presence of a low temperature component, identified in the central part of M87 by MBFB.
![[Uncaptioned image]](/html/astro-ph/0110516/assets/x1.png)
We also observe the residuals in the spectral fitting due to uncertainties in the MEKAL plasma code and uncertainties in the detector energy response. To check the influence of residual temperature structure, we performed the spectral extraction in , and annuli, also ignoring projection effects. Comparison of the determined element ratios to Fe shows remarkably similar results, while residuals in spectral fits to Fe L-shell lines are smallest for and . We also conclude that just using the extracted spectra from (excluding the jet) without performing the de-projection, results in exactly the same abundance ratios. Since we find the projection effects to be negligible, we present the results of the simple spectral extraction of data in the annulus. This allows us to increase the statistics of the measurement, important for abundance measurements of rare elements and makes it easier for other observers to reproduce our results. Spectra, used in the final analysis are displayed in Fig.2. For the determination of the Fe abundance as listed in Table 2 we use K-shell lines, while to model the spectral presence of Fe L-shell lines we add an additional spectral component with separately fitted temperature and verify the results by applying the APEC code (Smith et al. 2001), available in XSPEC v11, in place of the MEKAL code. As the confidence in the abundance determination for Ne, Mg and Ni in this way is still somewhat compromised, we present our results for them separately (Table 2). A solar Mg/O abundance ratio is detected for the central zone, while in the outer zone the Mg/O abundance ratio is slightly sub-solar. In the outer zone, however, when we fix the temperature and the iron abundance on the level determined by the high energy continuum and the Fe K-shell lines, solar Mg/O is reproduced for EPN, while such analysis of EMOS data is complicated, as we cannot use the normalization of the continuum derived at high energies, due to insufficient calibration of the vignetting below keV, as discussed above and in MBFB. We therefore conclude that the Mg/O ratio is consistent with the solar value for the outer zone in M87.
![[Uncaptioned image]](/html/astro-ph/0110516/assets/x2.png)
The structure of Tables 2 and 2 is similar and is defined as follows. In column 1 we identify the element, EPN measurements are presented in columns 2 & 3 and EMOS in columns 4 & 5 for the central and the outer zones, respectively. Confidence intervals are stated at the 68% level. As there is a difference between the definition of the solar abundances used in the X-ray analysis and in theoretical modeling of chemical enrichment (the first corresponds to photospheric values and second to the meteoritic values from Anders & Grevesse 1989), we provide in columns 6 & 7 the reference values for both, where for col 7 we use tabulations of Woosley & Weaver (1996). Major differences in the abundance scales, are in iron (theoretical units are 1.45 times lower) and sulphur (theoretical units are 1.14 times higher). While the data in columns 2–5 are given using the reference values in column 6, we will use throughout this paper the theoretical scaling and also conventional units of elemental abundance, , marked with [] ([Z/H] in Fig.2 and [Z/Fe] and [Z/O] in Fig.3).
3 Modeling
3.1 Test of SN Ia and SN II model yields
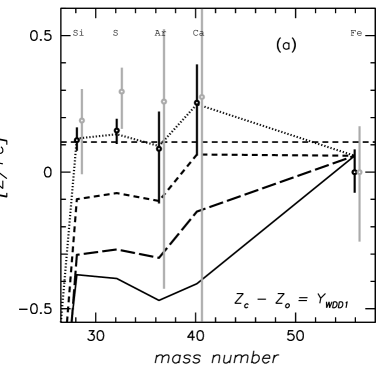
In modeling the results, we aimed to test the SN Ia and SN II nucleosynthesis models. We illustrate our thread of thought in Fig.3, where the labeling at the bottom right corner of each panel indicates the data and modeling used. The label indicates the measurement in the central (inner) and – outer zones, and denotes usage of theoretical yields for SN II and different models of SN Ia of Nomoto et al. (1997) with the differences outlined above. Error bars are plotted at the 68% confidence level.
There is an increased role of SN II in the outer zone as compared to the inner zone, as is best seen in the increase of [O/Fe] by almost 0.2 dex in Fig.2. To test the SN Ia yields, we first consider the inner zone, after subtracting the SN II contribution to the observed abundance patterns. For that we have to i) choose the SN II yields and ii) to normalize the SN II element patterns. For the latter point we can use the elements whose abundance is not affected by SN Ia enrichment. Given the possible systematic uncertainties in our measurements of Ne and Mg, we choose O as such an index. The modeling of SN II is quite complicated and at present differs significantly among various authors (Gibson, Loewenstein, Mushotzky 1997). We thus used two methods to estimate the SN II contribution and check the consistency of the results.
The first method (method 1) is independent of any modeling of the SN II yields. We subtract the outer zone element pattern, normalized to the relative O abundance in the inner and outer zone. The resulting element pattern is shown in Fig.3a. With this method we correctly subtract the SN II contribution. We note that indeed Ne and Mg (taking into account that Mg/O ratio in the outer zone is consistent with the solar value, as discussed in §2), which are enriched by SN II, are consistently removed in this way. The drawback of this method is that we also remove a fraction of the SN Ia contribution, existing in the outer region. The resulting patterns would be representative of the SN Ia pattern, only if the SN Ia overall yields are the same in the inner and outer regions. They can very well differ, if the various SN Ia types contribute in different proportions in the two regions.
The element abundance pattern, obtained in this way exhibits Si:S:Ar:Ca proportions typical of SNe Ia yields, with a high Si/Fe ratio (0.1 dex), corresponding well to WDD1 models of Nomoto et al. (1997). The high degree of incompleteness of Si burning in SNe Ia, thus found for M87 center, is in agreement with the conclusion based on the analysis of HST observations, that SNe Ia in early-type galaxies are, in general, subluminous (Howell 2001). In addition, another supporting argument comes from the consideration of the Ni abundance in M87. Although, we cannot produce a meaningfully constrained difference in Ni abundance between the central and the outer zone, the Ni/Fe ratio for the central zone, using EPN data on Ni K-shell lines, is of the solar value. Here errors are given at the 68% confidence. Abundance measurements are from K-shell lines for both Ni and Fe and theoretical units for solar element abundance are used. This value is much lower than the Ni/Fe ratio of 3 times solar found by Dupke & White (2000a), which favors the W7 model of SN Ia by Nomoto et al. (1997).
The second method (method 2) depends on the SN II modeling, but is free of any assumption on the radial variation of the SN Ia yields. We subtract, from the inner zone pattern, the SNe II yields from Nomoto et al. (1997a), again normalized to the O abundance. This is shown in Fig.3b. This leads to a roughly similar abundance pattern as found with the previous method, but significant differences are observed. Let us first assume, for the sake of the discussion, that the abundance pattern determined with the first method gives correctly the SN Ia yields in the inner region, since a good agreement is observed with the WDD1 model. The differences observed, when using method 2, would thus indicate incorrect SN II yield modeling. By comparing Fig.3a and Fig.3b, we first note that S is over-subtracted. Ca is under-subtracted relative to Si and Ar, although marginally since the Ca yield in SN Ia based on the measurements in Fig.3a has a large error bar. Finally the Si/Fe ratio is by 0.1 dex lower, compared to Fig.3a, although only on the 90% confidence level, given large error bars on Fe in Fig.3a. We now examine if such discrepancies can be removed by modifying the corresponding SN II yield for these elements in a reasonable way.
For sulphur, we require a reduction in SN II yields of Nomoto et al. (1997a) by a factor of two to three in order to match the observations. This, indeed, has been known to be a problem of SN II modeling already from ASCA observations of cluster outskirts, where the abundance pattern favors SN II (the number ratio is 20:1 for SN II:Ia compared to 20:12 for the central zone in M87) (Mushotzky et al. 1996; Loewenstein & Mushotzky 1996; FDP). For example from the Si:S:Fe ratios in the Centaurus cluster (Finoguenov, Arnaud, David 2001) we conclude that Nomoto et al. (1997a) SN II yields for S should be reduced by a factor of 2.5. The resulting [S/Si] yield in SN II is -0.6 dex. Note that this makes S a good SN Ia indicator, especially in the central zone of M87, where the S/Fe ratio by SN Ia takes a solar value.
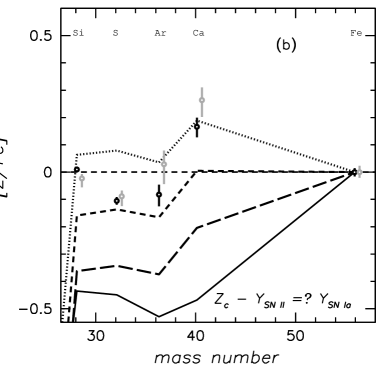
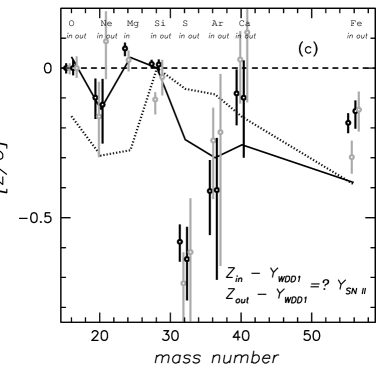
We then consider the problem with the Si/Fe ratio apparent in Fig.3b. We again assume that the SN Ia yields are those from the WDD1 SN Ia model and we illustrate the corresponding requirements on SN II model yields, by subtracting the WDD1 SN Ia yields from the measured abundance pattern in both the central and the outer zones. The model normalization is chosen to achieve the [S/Si] of -0.6 dex, as discussed above. The results are presented in Fig.3c. We show the SN II model yields of Nomoto et al. (1997a) with the solid line and the SN II yields of Woosley & Weaver (1995) for solar metallicity and averaged using the Salpeter IMF with the dotted line. Models are normalized to Si, since SN II yields for Si are similar among different authors. As is seen from the Figure, to explain the data while assuming the WDD1 model for SN Ia yields, the SN II plot should exhibit a high Fe/Si ratio. This is unacceptable, given ASCA observations (FDP), as well as observations of the stellar abundance pattern (e.g. Timmes, Woosley and Weaver 1995). This indicates that simply changing the SN II yields is not sufficient. The inconsistency between the abundance pattern derived with method 1 and method 2 is also due to a variation of the SN Ia yields with radius.
On the other hand, varying SN Ia models will not strongly help in reducing the Ca/Si ratio in Fig.3c, so our observation hints toward a solar Ca/Si ratio in SN II models, in agreement with stellar data (e.g. Timmes et al. 1995). The Ca/O ratio is least dependent on the adopted S/Si ratio and is still close to solar even when the sulphur production in SN II is set to zero. We also note, that O/Si ratio, which is claimed to be uncertain by a factor of 3 ( dex, Gibson, Loewenstein, Mushotzky 1997), is in fact very well reproduced in Nomoto et al. (1997a) SN II models (O/Si ratio is reproduced to better than 10%). 111Now we can see that systematic difference in Si abundance between EPN and EMOS measurements for the center is likely to be a problem for EPN (probably due to systematics in the background subtraction), as already at the outer zone, EPN value is on the same level as EMOS data.
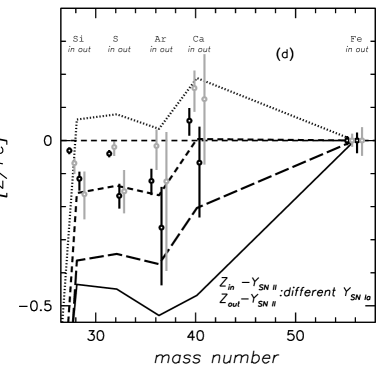
In a last step, we thus consider the Nomoto et al. (1997a) SN II model yields, modified as suggested by our analysis: Si:Ca ratio is solar, while [Si/S] is 0.6 dex. We subtracted these yields both in the inner and outer region (both shown in Fig.3d) and check the consistency of the derived abundance pattern with the SN Ia theoretical yields. The SN Ia yields for the outer zone correspond well to the WDD2 model of Nomoto et al. (1997). For the inner regions they lie in between the WDD1 and WDD2 model. We note that, in both cases, the Si:S:Ar:Ca ratios are correct. The actual difference in the SN Ia yields between the central and the outer zone amounts to 0.1 dex for Si group elements and is detected on a confidence level exceeding 99% for Si and S, and marginally for Ar and Ca.
At this point, we have established that our data exhibit a variation in SN Ia model yields between the central and the outer zones, relative ratios for Si:S:Ar:Ca are correct in SN Ia models of Nomoto et al. (1997), Si:Ca ratios in SN II models should be solar within 0.1 dex, while [Si/S] is 0.6 dex (similar to ASCA conclusion on [Si/Fe] FDP), and that Nomoto et al. (1997a) SN II model yields consistently describe O:Ne:Mg:Si:Ar within 0.05 dex. Our conclusion regarding the Si-Ca group could be formulated as follows: peaks on Si and Ca relative to Ar and S (as seen in Fig.2) are due to SN II, not SN Ia models and should become even stronger in the cluster outskirts, where the SN II abundance pattern dominates.
Finally, it should also be noted, that our conclusion regarding SN Ia yields, can be based on Ar, which, as a noble gas, cannot be locked into dust. So we can rule out the possibility that the abundance pattern in M87 is heavily modified by condensation into dust and dust sputtering (Allen and Fabian 1998; Aguirre et al. 2001).
3.2 Contribution from different SN Ia types
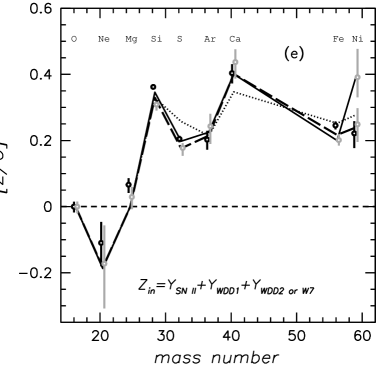
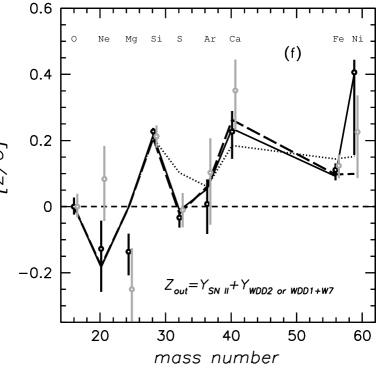
As expected from the above analysis, the observation of M87 could be described by a set of delayed detonation models. Using the theoretical SN Ia yields and the modified SN II yields, SN number ratios for WDD1:WDD2:II of 8:3:20 and 0:7:20, for the inner and the outer zones, respectively, fit the data well, as illustrated in Figs.3e and 3f. In these figures we also illustrate the change due to improved SN II yields (compare the dotted and the dashed lines).
However, this is not the only solution. The factor of two higher Ni/Fe ratio, reported for some other clusters of galaxies by Dupke & White (2000a) using ASCA observations, requires a large variation of neutron rich isotope production in SN Ia models, beyond the reach of delayed detonation models in both the level of Ni/Fe found by Dupke & White (2000a) and the variation in Ni/Fe ratio by a factor of 2, implied by a comparison of M87 data with the data of Dupke & White (2000a). Therefore, to explain the combined data, introduction of deflagration models of Nomoto et al. (1997) is required. The need for both deflagration and detonation scenarios in order to explain the element abundance pattern independently confirms the conclusion of Hatano et al. (2000) on the spectroscopic diversity of SN Ia. Two scenarios of SN Ia explosion, indicated by their study and also supported by X-ray observations, as summarized above, detonation and deflagration, introduce two free parameters related to SN Ia modeling: the mixture of delayed detonation models (controls the average Si/Fe groups abundance ratio in delayed deflagration models) plus a relative role of deflagration-to-detonation scenario (acts both on Si/Fe and Ni/Fe ratios). So, for a final answer, both Si/Fe group ratios and Ni/Fe are equally important.
To illustrate the point, in Figs.3f and 3g we show that the W7 model in combination with the WDD1 model can also describe the observed data in the central and the outer zones. SN number ratios for WDD1:W7:II are 10:2:20 and 5:3:20 for the inner and the outer zones, respectively. It is clear that using the existing data on the Ni/Fe ratio for the outer zone of M87 it is not possible to discriminate between WDD2 and a mix of WDD1 and W7 models of SN Ia, while the higher reliability of Ni abundance determination using K-shell lines, detected by EPN at the M87 center, which results in Ni/Fe ratio of solar value is best modeled by a mix with W7 model.
Another aspect, related to understanding of the role of SN Ia at larger radii of clusters, is whether the SN Ia abundance pattern will continue to change with radius, reaching the W7 model yields. Observationally, the SN Ia contribution to Fe should fall less steeply compared to the S abundance. ASCA data on the Centaurus cluster shows that these two fall similarly and in fact the WDD2-like SN Ia abundance pattern holds out to kpc distance from the center. Data on MKW4 (FDP) are consistent with no further change in SN Ia pattern, but reveal a slightly higher role of the W7 model in general. An even higher role of the W7 scenario is suggested for AWM7, as Si/Fe and S/Fe ratios attributed to SN Ia are by 0.1 dex lower than the WDD2 model yields, and also in the AWM7 cluster center (Finoguenov & Ponman 1999). Future XMM observations will therefore be of interest to study another aspect related to WDD1:W7 mix – a link to chemical evolution of galaxies.
3.3 Hypernovae
The consideration of nova and sub-Chandrasekar mass models for Type Ia SNe would be important in the explanation of the rare elements (Woosley et al. 1997), which is not relevant here. The metal production by hypernovae is not considered here as these events are thought to be rare. If there is an association of hypernovae with an early Population III, the level of corresponding metal enrichment, assuming uniform mixing, should be a few orders of magnitude lower than the level observed in M87 (Madau, Ferrara, Rees 2000). Formal application of the hypernovae yields (as a substitution for SN II), when normalized to O, result in overproduction of S and Ni and are at odds with either Mg, Si or Fe. The most energetic cases of HN models can be formally used in place of SN Ia WDD models, as they mostly produce the Si–Ca group (Nakamura et al. 2000). Consideration of hypernovae in the interpretation of element abundances determined in clusters of galaxies by XMM is given by Loewenstein (2001). Given the essentially SN-II type origin of hypernovae, it is logical to attribute their appearance in the ISM of M87 to the stellar mass loss, which implies that there is still (as we consider a hypernova scenario unlikely) no extra energy input to ICM associated with the observed level of chemical enrichment of the X-ray gas.
4 Discussion
4.1 Implications
The enhanced Si production in SN Ia, suggested by our observations, has a strong influence on the determination of the role of SN Ia in element production in clusters of galaxies, since Si and Fe abundances are the most easily available for measurements at X-rays. Already at 70 kpc distance from the center, the abundance pattern attributed to SN Ia is reminiscent of the WDD2 yields. Therefore, in the analysis of the ICM abundance pattern, as opposite to study of ISM of BCG, it is the WDD2 model yields that have to be considered.
The low iron yield, corresponding to the WDD1 scenario (M⊙ compared to M⊙ in W7 model), helps to reduce a discrepancy between the estimation of SN Ia rates and measured element abundances in X-ray halos of early-type galaxies (for details see Arimoto et al. 1997; Finoguenov & Jones 2000 and §4.2). In view of the varying Fe yield in SN Ia models, for SN Ia rate estimates it is better to use weighted Si and Fe abundances, since is constant in SN Ia models, as almost no elements lighter than Si are produced in significant amounts, as well as few elements heavier than Fe group, while the initial mass of the exploding star is fixed. The weighting method is to use (after separation of SN II contribution) half of the Si abundance, add Fe abundance and use an effective yield for iron and silicon of 0.9 M⊙.
Observational evidence for a high Ni/Fe ratio, present in the literature, which is a specific feature of the W7 SN Ia model, could partly be due to confusion with the effect of resonance line scattering. Our results on the variation in SN Ia produced element abundance pattern implies that Ni/Fe can vary by a factor. A proper justification, which requires either high spatial (physical) resolution to study the abundance profiles in the central part of cluster or high energy resolution to separate the contribution of the Fe Kβ line from Ni Kα line, is needed to finally conclude on both the SN Ia type and the effect of resonance line scattering.
Iwamoto et al. (1999) worked on the refining of the SN Ia models in application to the chemical evolution of Milky Way. There, SN Ia yields span a narrower (by 0.2 dex) range in Si-Ca/Fe ratios, in comparison to models of Nomoto et al. (1997), which is insufficient to describe our measurements and therefore requires further investigation of the parameter space in SN Ia models. We note for example that the lowest DDT density used in their calculations is g cm-3. Thus, we conclude that within the frame of modeling of Iwamoto et al. (1999), our data favor a somewhat lower DDT density, which is in agreement with initial studies of Khokhlov (1991). However, the exact relation between the DDT density and the resulting Si/Fe ratio is strongly model dependent.
From the studies of Umeda et al. (1999) we conclude that the calibration of a variety of SN Ia models against the solar abundance pattern is poorly connected to the SN Ia abundance pattern observed in clusters of galaxies, as there is a systematic variation in the channels leading to SN Ia explosion. For example, the abundance pattern in M87 changing with radius from prevalence of SN Ia to ”solar” proportion of SN II and Ia and further on to dominance of SN II, will at no point resemble the solar element composition.
4.2 Population synthesis view
Apart from the information we can gain about the importance of different SN Ia and SN II models in the heavy element enrichment process in the intergalactic medium, there are also some possible implications on the stellar evolution scenario in M87 that can be drawn from the observed abundance patterns. One aspect of the problem considered above essentially consists of an explanation of the abundance pattern by enrichment with mostly SN II and an additional contribution of SN Ia to adjust the deviation in the abundance distribution.
We can now address some further questions related to the connection of the intracluster gas and the stellar population and implications from a comparison of absolute abundances between the stellar component and the X-ray emitting gas. The current approach to the modeling of the X-ray element abundance pattern consists of fitting the stellar abundance pattern (thought to be dominated by SN II) with extra SN Ia added to the hot gas (e.g. Loewenstein & Mathews 1991). As this approach fails in the attempt to combine the X-ray abundance measurements, optical abundance measurements, and results of SN Ia searches (Loewenstein et al. 1994; Arimoto et al. 1997; Finoguenov & Jones 2000), there is a need for modification in the underlying assumptions, such as the SN rate – iron production relation (Finoguenov & Jones 2000), metallicity dependence of SN Ia rate (Kobayashi et al. 1998; Umeda et al. 1999; Finoguenov & Jones 2000), closed-box approximation of the X-ray halo (Davis & White 1996), as well as complexity of interpretation of the X-ray emission in early-type galaxies (Matsushita et al. 2000), recently resolved with the advent of Chandra (e.g. Finoguenov & Jones 2001), as well as a revision of the results form the optical spectroscopy (Kobayashi & Arimoto 1999). In this section we would like to shed light on one more issue, concerning the relation of the observed stellar metallicities to metallicity of the stellar mass loss.
Since M87 sits at the bottom of the Virgo cluster potential, we need to justify that the X-ray gas at the center of M87 is related to the M87 ISM, rather then the ICM of the Virgo cluster, to ensure the usage of the closed-box approach. Matsushita (2001) analyzed a number of early-type galaxies observed by ROSAT and established the direct correspondence between the temperature of the galactic X-ray halo and the stellar velocity dispersion (often expressed as ). This component exhibits a good correlation with the optical luminosity of the galaxy. Thus, the ability to explain the temperature of the central zone of M87 consistently, is essential to ensure robustness of interpretation of the absolute level of element abundances. In the center of M87, a cold X-ray component ( keV) is found by MBFB, which corresponds to . This component is associated with the radio jet and thus is protected from adiabatic compression and thermal conductivity, suggested to act on the ISM of cluster galaxies (e.g. Vikhlinin et al. 2001). Subsequent rise of the temperature could either be a result of adiabatic compression or thermal conduction. We note, however, that an increased velocity dispersion is detected for globular clusters in outskirts of M87 and the reconstructed behavior of the M/L ratio with radius matches the X-ray determination (Romanowsky & Kochanek 2001). So in fact the mass loss from the stellar component corresponding to the same globulars should result in the observed X-ray temperature without invoking any cooling/heating into its explanation. SN Ia provide 0.4 and 0.2 keV/particle at the central and outer zones, respectively, but this input may be spent on adiabatic expansion work. Thus, the considerations given above are not changed. The observed element abundance could be diluted by the inflow of the Virgo ICM. Within this scenario, we can use a systematic change in SN Ia pattern with radius to determine the dilution factor. The idea is to determine the contribution to Fe abundance from the SNe Ia pattern characteristic to Virgo ICM in both the center and the outer zones. In the center this value will be lower, because it is diluted by the stellar mass loss, while additional enrichment from SN Ia has a different element abundance pattern. We take the SN Ia element abundance pattern found in the outer zone to represent the in-flowing gas and assuming that M87 SN Ia are of WDD1 type. The dilution factor obtained in this way equals 2, and the resulting stellar O abundance factor is 0.83 solar and SN Ia rate is SNu (supernova units), assuming (see Finoguenov & Jones 2000 for details of the calculation). One can see that this modification, although yielding a level for SN Ia rate, consistent with optical searches (Cappellaro et al. 1997), still does not completely solve the discrepancy in stellar metallicity.
Since the stellar abundance pattern is thought to be dominated by SN II and given the significant input of SN Ia for the Si abundance, discussed above, we select O for a comparison of the ISM and stellar abundances. We note that the O abundance appears a factor of two lower than current optical estimates of Kobayashi & Arimoto (1999), assuming its slight oxygen overabundance relative to iron in stars.
The deviation in the derived stellar abundance between the optical and X-ray data is moderate and we note that an interesting solution is traced in M87 globulars. The latter display two major populations of metal rich (MRC) and metal poor clusters (MPC). The former follows the distribution of the field stellar population, while the latter is distributed differently than the stellar light in M87 (Harris 2001). McLaughlin (1999) proposed to use the X-ray gas in the estimation of the efficiency of the MPC production and concluded that efficiency of globular cluster formation is universal. This either means that the efficiency of star formation is not universal (McLaughlin 1999), or, as we propose here, that the metal-poor field stellar population, related to the MPC, had an IMF low-mass cut-off at high mass (Larson IMF) and thus left a few stars shining until now. While the IMF slope is governed by the turbulence pattern (e.g. Elmegreen 1993), the proposed bi-modality of the IMF finds its origin in the sensitivity of the Jeans mass to the temperature of the medium. The formation of the GC requires high density, so it is essentially insensitive to the temperature, which makes GC better tracers of the star formation (Larson 1998). In the proposed scenario, the metallicity of the X-ray gas would reflect the abundance pattern of both metal-rich and metal-poor stellar populations, while only the metal-rich field stellar population is optically seen. Since populations of the MRC and MPC in M87 are equally abundant (Harris 2001), a factor of two lower metallicity in X-rays could easily be explained. An important aspect of this scenario is the accumulation time of the X-ray gas in the central zone, since it should exceed the time since the putative die out of the metal-poor field stellar population of M87. The influence of the hidden stellar population on the chemical enrichment of the ICM and its effect on the Faber-Jackson relation are discussed in Elbaz, Arnaud, Vangioni-Flam (1995); Zepf & Silk (1996); Larson (1998).
While the Larson IMF may not be the only explanation, metal-poor field stars were likely accompanying metal-poor GC till a certain point, but may become lost to the cluster potential (Elmegreen B. 2001, private communication). This alternative does not change the consideration given above, as the X-ray gas still represents the abundance of both metal rich and metal poor stellar populations, while only the metal-rich field stellar population is observed optically.
The possible introduction of hypernovae models in the explanation of the abundance pattern in the central zone will not change the above consideration, as they are not contributing to O, given the observed metallicities for the Si–Ca group.
The scenario, presented above, suggests a difference in the element abundance in the hot X-ray halos of galaxies with different properties of GCs (a deviation between optical and X-ray abundance should correlate with GC specific frequency), which is worth further investigation.
5 Conclusions
Taking advantage of a nearly constant temperature behavior in the and ( for EMOS) annuli in M87 (the central and the outer zones), we have derived the detailed element abundance pattern in M87 using XMM-Newton observations with EPIC-PN and EPIC-MOS detectors. Given the prevalence of a SN Ia origin for most elements, we were able to put model-independent constraints on the SN Ia yields, requiring, in particular, a high Si, S, Ar and Ca to iron ratio in the central zone of M87. We detect a variation in the SN Ia yields between the central and the outer zones, which we relate to an increased incompleteness of Si burning in the SN Ia, responsible for the M87 ISM enrichment. This result is also related to subluminous SN Ia found optically in early-type galaxies. In addition, the Ni/Fe ratio, in the central zone of M87 is (meteoritic) solar, while values around 3 times solar are reported for other clusters. In modeling of SN Ia, this implies a reduced influence of fast deflagration SN Ia models in chemical enrichment of M87’s ISM. Thus, to describe the combined X-ray data on clusters of galaxies in terms of present SN Ia nucleosynthesis models, both (fast) deflagration as well as delayed detonation scenarios are required, independently supporting a similar conclusion, derived from optical studies of SNe Ia. We propose to use the SN Ia contribution to both Si and Fe abundance for X-ray estimates of the SN Ia rate. Regarding the SN II yields, we demonstrate that the Si:Ca ratio should be solar within 0.1 dex, while [Si/S] is 0.6 dex, similar to the ASCA conclusion on [Si/Fe] (FDP), and that the Nomoto et al. (1997a) SN II model yields consistently describe O:Ne:Mg:Si:Ar within 0.05 dex. Finally, we compare the derived O abundance with metallicity measurements using integrated optical light and speculate on the importance of the stellar mass loss from the metal-poor stars that previously accompanied the metal-poor globulars of M87.
Acknowledgements.
The authors thank Ken’ichi Nomoto, Chiaki Kobayashi, Nikolai Chugai, Bruce Elmegreen, Friedrich-Karl Thielemann, Paolo Mazzali and the referee, Michael Loewenstein, for their comments on the paper. The authors acknowledge useful communications of Elena Belsole regarding the issues of EMOS data analysis. The paper is based on observations obtained with XMM-Newton, an ESA science mission with instruments and contributions directly funded by ESA Member States and the USA (NASA). The XMM-Newton project is supported by the Bundesministerium fuer Bildung und Forschung, Deutschen Zentrum fuer Luft und Raumfahrt (BMBF/DLR), the Max-Plank Society and the Haidenhaim-Stiftung. AF acknowledges receiving the Max-Plank-Gesellschaft Fellowship.References
- (1) Aguirre, A., Hernquist, L., Katz, N., Gardner, J., Weinberg, D. 2001, ApJ, 556, L11
- (2) Allen, S. and Fabian, A. 1998, MNRAS, 297, 63
- (3) Anders, E. and Grevesse, N. 1989, Geochimica et Cosmochimica Acta, 53, 197
- (4) Arimoto, N., Matsushita, K., Ishimaru, Y., Ohashi, T., Renzini, A. 1997, ApJ, 477, 128
- (5) Belsole, E., Sauvageot, J.L., Böhringer, H., Worrall, D.M., Matsushita, K., et al. 2001, A&A, 365, L188
- (6) Böhringer, H., Belsole, E., Kennea, J., Matsushita, K., Molendi, S., et al. 2001, A&A, 365, L181
- (7) Cappellaro, E., Turatto, M., Tsvetkov, D., Bartunov, O., Pollas, C., Evans, R. and Hamuy, M. 1997, A&A, 322, 431
- (8) Davis, D.S., White, R.E. III 1996, ApJ, 470, L35
- (9) Dupke R.A., White III R.E., 2000a, ApJ, 528, 139
- (10) Dupke, R.A., White, R.E. III 2000b, ApJ, 537, 123
- (11) Elbaz, D., Arnaud, M., Vangioni-Flam, E. 1995, A&A, 303, 345
- (12) Elmegreen, B.G. 1993, ApJ, 419, L29
- (13) Finoguenov, A., Jones, C., Forman, W. and David, L. 1999, ApJ, 514, 844
- (14) Finoguenov, A., and Ponman T.J. 1999, MNRAS, 305, 325
- (15) Finoguenov, A., David, L.P., Ponman, T.J. 2000, ApJ, 544, 188; FDP
- (16) Finoguenov, A., and Jones, C. 2000, ApJ, 539, 603
- (17) Finoguenov, A., Arnaud, M., David, L.P. 2001, ApJ, 555, 191
- (18) Finoguenov, A., and Jones, C. 2001, ApJ, 547, L107
- (19) Gibson, B.K., Loewenstein, M., and Mushotzky, R.F. 1997, MNRAS, 290, 623
- (20) Harris, W.E. 2001, Star Clusters, Swiss Soc. for A&A (eds. Labhardt, L., and Binggeli, B.), Springer-Verlag, Berlin, p.223
- (21) Hatano, K., Branch, D., Lentz, E.J., Baron, E., Filippenko, A.V., Garnavich, P.M. 2000, ApJ, 543, L49
- (22) Höflich P., Wheeler J.C., Thielemann F.K., 1998, ApJ, 495, 617
- (23) Howell, D.A. 2001, ApJ 554, L193
- (24) Hwang, U., Mushotzky, R.F., Burns, J.O., Fukazawa, Y., White, R.A. 1999, ApJ, 516, 604
- (25) Iwamoto, K., Brachwitz, F., Nomoto, K., Kishimoto, N., Umeda, H., Hix, W.R., Thielemann, F.-K. 1999, ApJS 125, 439
- (26) Jansen, F., Lumb, D., Altieri, B., et al. 2001, A&A, 365, L1
- (27) Khokhlov, A. 1991, A&A, 245, 114
- (28) Kobayashi, C., Tsujimoto, T., Nomoto, K., Hachisu, I., Kato, M. 1998, ApJ, 503, 155
- (29) Kobayashi, C., Arimoto, N. 1999, ApJ, 527, 573
- (30) Larson, R.B. 1998, MNRAS, 301, 569
- (31) Liedahl, D.A., Osterheld, A.L., and Goldstein, W.H. 1995, ApJ, 438, L115
- (32) Loewenstein, M., and Mathews, W.G. 1991, ApJ, 373, 445
- (33) Loewenstein, M., Mushotzky, R.F., Tamura, T., Ikebe, Y., Makishima, K., Matsushita, K., Awaki, H., and Serlemitsos, P.J. 1994, ApJ, 436, L75
- (34) Loewenstein, M., Mushotzky, R.F. 1996, ApJ, 466, 695
- (35) Loewenstein, M. 2001, ApJ, 557, 573
- (36) Madau, P., Ferrara, A., Rees, M.J. 2000, ApJ, 555, 92
- (37) Matsushita, K., Ohashi T., Makishima K., 2000, PASJ, 52, 685
- (38) Matsushita, K. 2001, ApJ, 547, 693
- (39) Matsushita, K. et al. 2001a, A&A, in preparation
- (40) Matsushita, K., Belsole, E., Finoguenov, A., Böringer, H. 2001b, A&A, submitted; MBFB
- (41) Mazzali, P.A., Nomoto, K., Cappellaro, E., Nakamura, T., Umeda, H., Iwamoto, K. 2001, ApJ, 547, 988
- (42) McLaughlin, D. 1999, AJ, 117, 2398
- (43) Mewe, R., Gronenschild, E.H.B.M., and Oord, G.H.J. 1985, A&AS, 62, 197
- (44) Mewe, R., Kaastra, J. 1995, Internal SRON-Leiden report
- (45) Molendi, S., and Gastaldello, F. 2001, A&A, 375, L14
- (46) Mushotzky, R.F., Loewenstein, M., Arnaud, K.A., Tamura, T., Fukazawa, Y., Matsushita, K., Kikuchi, K., and Hatsukade, I. 1996, ApJ, 466, 686
- (47) Nakamura, T., Umeda, H., Iwamoto, K., Nomoto, K., Hashimoto, M., Hix, W.R., Thielemann, F.-K. 2001, ApJ, 555, 880
- (48) Niemeyer, J.C. 1999, ApJ, 523, L57
- (49) Nomoto, K., Thielemann, F.-K., Yokoi, K. 1984, ApJ, 286, 644
- (50) Nomoto, K., Iwamoto, K., Nakasato, N., Thielemann, F.-K., Brachwitz, F., Tsujimoto, T., Kubo, Y., Kishimoto, N. 1997, Nuclear Physics, A621, 467
- (51) Nomoto, K., et al. 1997a, Nuclear Physics, A616, 79
- (52) Phillips, K., Mewe, R., Harra-Murnion, L., Kaastra, J., Beiersdorfer, P., Brown, G., Liedahl, D. 1999, A&AS, 138, 381
- (53) Romanowsky, A.J., Kochanek, C.S. 2001, ApJ, 553, 722
- (54) Smith, R.K., Brickhouse, N.S., Liedahl, D.A., Raymond, J.C. 2001, ApJ, 556, L91
- (55) Timmes, F., Woosley, S., Weaver, T. 1995, ApJS, 98, 617
- (56) Umeda, H., Nomoto, K., Kobayashi, C., Hachisu, I., Kato, M. 1999, ApJ, 522, L43
- (57) Umeda, H., Nomoto, K., Yamaoka, H., Wanajo, S. 1999a, ApJ, 513, 861
- (58) Vikhlinin, A., Markevitch, M., Forman, W.R., Jones, C., 2001, ApJ, 555, L87
- (59) Woosley, S.E., Hoffman, R.D., Timmes, F.X., Weaver, T.A., Thielemann, F.-K. 1997, Nuclear Physics, A621, 445
- (60) Woosley, S.E., and Weaver, T.A. 1995, ApJS 101, 181
- (61) Zepf, S.E., Silk, J. 1996, ApJ, 466, 114