Abstract
Comptonization of the cosmic microwave background (CMB) radiation by hot gas in clusters of galaxies - the Sunyaev-Zeldovich (S-Z) effect - is of great astrophysical and cosmological significance. In recent years observations of the effect have improved tremendously; high signal-to-noise images of the effect (at low microwave frequencies) can now be obtained by ground-based interferometric arrays. In the near future, high frequency measurements of the effect will be made with bolomateric arrays during long duration balloon flights. Towards the end of the decade the PLANCK satellite will extensive S-Z surveys over a wide frequency range. Along with the improved observational capabilities, the theoretical description of the effect and its more precise use as a probe have been considerably advanced. I review the current status of theoretical and observational work on the effect, and the main results from its use as a cosmological probe.
1 Introduction
The cosmological significance of the spectral signature imprinted on the CMB by Compton scattering of the radiation by electrons in a hot intergalactic medium was realized early on by Zeldovich & Sunyaev (1969). A more important manifestation of this effect occurs in clusters of galaxies (Sunyaev & Zeldovich 1972). Measurements of this S-Z effect with single-dish radio telescopes were finally successful some 15 years later (for general reviews, see Rephaeli 1995a, Birkinshaw 1999). Growing realization of the cosmological significance of the effect has led to major improvements in observational techniques, and to extensive theoretical investigations of its many facets. The use of interferometric arrays, and the substantial progress in the development of sensitive radio receivers, have led to first images of the effect (Jones 1993, Carlstrom et al. 1996). Some 40 cluster images have already been obtained with the OVRO and BIMA arrays (Carlstrom et al. 1999, Carlstrom et al. 2001). Theoretical treatment of the S-Z effect has also improved, starting with the work of Rephaeli (1995b), who performed an exact relativistic calculation and demonstrated the need for such a more accurate description.
The S-Z effect is essentially independent of the cluster redshift, a fact that makes it unique among cosmological probes. Measurements of the effect yield directly the properties of the hot intracluster (IC) gas, and the total dynamical mass of the cluster, as well as indirect information on the evolution of clusters. Of more basic importance is the ability to determine the Hubble () constant and the density parameter, , from S-Z and X-ray measurements. This method to determine , which has clear advantages over the traditional galactic distance ladder method based on optical observations of galaxies in the nearby universe, has been yielding increasingly higher quality results. But substantial systematic uncertainties, due largely to modeling of the thermal and spatial distributions of IC gas, need still to be reduced in order to fully exploit the full potential of this method. Sensitive spectral and spatial mapping of the effect, and the minimization of systematic uncertainties in the S-Z and X-ray measurements, constitute the main challenges of current and near future work in this rapidly progressing research area.
I describe the effect and review some of the recent observational and theoretical work that significantly improved its use as a precise cosmological probe. Progress anticipated in the near future is briefly discussed.
2 Exact Description of the Effect
The scattering of the CMB by hot gas heats the radiation, resulting in a systematic transfer of photons from the Rayleigh-Jeans (R-J) to the Wien side of the (Planckian) spectrum. An accurate description of the interaction of the radiation with a hot electron gas necessitates the calculation of the exact frequency re-distribution function in the context of a relativistic formulation. The calculations of Sunyaev & Zeldovich (1972) are based on a solution to the Kompaneets (1957) equation, a nonrelativistic diffusion approximation to the exact kinetic (Boltzmann) equation describing the scattering. The result of their treatment is a simple expression for the intensity change resulting from scattering of the CMB (temperature ) by electrons with thermal velocity distribution (temperature ),
| (1) |
where . The spatial dependence is contained in the Comptonization parameter, , a line of sight integral (through the cluster) over the electron density (); is the Thomson cross section. The spectral function,
| (2) |
where is the non-dimensional frequency, is negative in the R-J region and positive at frequencies above a critical value, , corresponding to GHz. Typically in a rich cluster along a line of sight through the center, and the magnitude of the relative temperature change due to the thermal effect is in the R-J region.
The above thermal intensity change is the full effect only if the cluster is at rest in the CMB frame. Generally, the effect has a second component when the cluster has a finite (peculiar) velocity in the CMB frame. This kinematic (Doppler) component is
| (3) |
where is the line of sight component of the cluster peculiar velocity, is the Thomson optical depth of the cluster. The related temperature change is (Sunyaev & Zeldovich 1980).
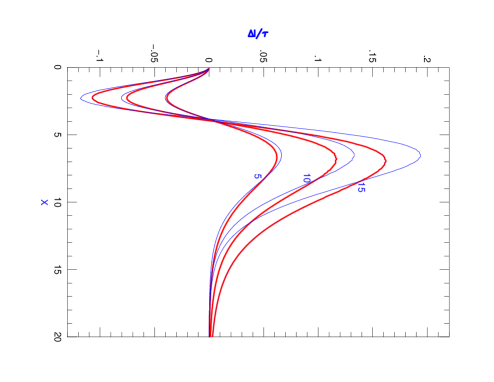
The quantitative nonrelativistic description of the two components of the S-Z effect by Sunyaev & Zeldovich (1972) is generally valid at low gas temperatures and at low frequencies. Rephaeli (1995b) has shown that this approximation is insufficiently accurate for use of the effect as a precise cosmological probe: Electron velocities in the IC gas are high, and the relative photon energy change in the scattering is sufficiently large to require a relativistic calculation. Using the exact probability distribution in Compton scattering, and the relativistically correct form of the electron Maxwellian velocity distribution, Rephaeli (1995b) calculated in the limit of small , keeping terms linear in (single scattering). Results of this semi-analytic calculation, shown in Figure 1, demonstrate that the relativistic spectral distribution of the intensity change is quite different from that derived by Sunyaev & Zeldovich (1972). Deviations from their expression increase with and can be quite substantial. These are especially large near the crossover frequency, which shifts to higher values with increasing gas temperature.
The results of the semi-analytic calculations of Rephaeli (1995b) generated considerable interest which led to various generalizations and extensions of the relativistic treatment. Challinor & Lasenby (1998) generalized the Kompaneets equation and obtained analytic approximations to its solution for the change of the photon occupation number by means of a power series in = . Itoh et al. (1998) adopted this approach and improved the accuracy of the analytic approximation by expanding to fifth order in . Sazonov & Sunyaev (1998) and Nozawa et al. (1998) have extended the relativistic treatment also to the kinematic component obtaining – for the first time – the leading cross terms in the expression for the total intensity change () which depends on both and . An improved analytic fit to the numerical solution, valid for , and ( GHz), has recently been given by Nozawa et al. (2000). In view of the possibility that in some rich clusters , the approximate analytic expansion to fifth order in necessitates also the inclusion of multiple scatterings, of order . This has been accomplished by Itoh et al. (2000), and Shimon & Rephaeli (2001).
The more exact relativistic description of the effect should be used in all high frequency S-Z work, especially when measurements of the effect are used to determine precise values of the cosmological parameters. Also, since the ability to determine peculiar velocities of clusters depends very much on measurements at (or very close to) the crossover frequency, its exact value has to be known. This necessitates knowledge of the gas temperature since in the exact relativistic treatment the crossover frequency is no longer independent of the gas temperature, and is approximately given by GHz (Nozawa et al. 1998a). Use of the S-Z effect as a cosmological probe necessitates also X-ray measurements to determine (at least) the gas temperature. Therefore, a relativistically correct expression for the (spectral) bremsstrahlung emissivity must be used (Rephaeli & Yankovitch 1997). In the latter paper first order relativistic corrections to the velocity distribution, and electron-electron bremsstrahlung, were taken into account in correcting values of that were previously derived using the nonrelativistic expression for the emissivity (see also Hughes & Birkinshaw 1998). Nozawa et al. (1998b) have performed a more exact calculation of the relativistic bremsstrahlung Gaunt factor.
Scattering of the CMB in clusters affects also its polarization towards the cluster. Net polarization is induced due to the quadrupole component in the spatial distribution of the radiation, and when the cluster peculiar velocity has a component transverse to the line of sight, (Sunyaev & Zeldovich 1980, Sazonov & Sunyaev 1999). The leading contributions to the latter, kinematically-induced polarization, are proportional to and . Itoh et al. (2000) have included relativistic corrections in the expression they derived for the kinematically induced polarization.
3 Recent Measurements
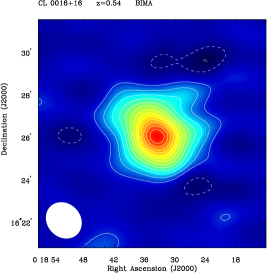
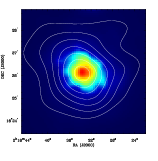
The quality of S-Z measurements has increased very significantly over the last seven years mainly as a result of the use of interferometric arrays. Telescope arrays have several major advantages over a single dish, including insensitivity of the measurements to changes in the atmospheric emission, sensitivity to specific angular scales and to signals which are correlated between the array elements, and the high angular resolution that enables nearly optimal subtraction of signals from point sources. With the improved sensitivity of radio receivers it became feasible to use interferometric arrays for S-Z imaging measurements (starting with the use of the Ryle telescope by Jones et al. 1993). Current state-of-the-art work is done with the BIMA and OVRO arrays; images of some 35 moderately distant clusters (in the redshift range ) have already been obtained at GHz (Carlstrom et al. 1999, 2001). The S-Z image of the cluster CL0016+16, observed at 28 GHz with the BIMA array (Carlstrom et al. 1999), is shown in the upper frame in Figure 2. The ROSAT X-ray image is superposed on the contour lines of the S-Z profile in the lower frame. These images nicely demonstrate the good agreement between the orientation of the X-ray and S-Z brightness distributions, as well as the relative smallness of the X-ray size () in comparison with the S-Z size () of the cluster.
Work has begun recently with the CBI, a new radio (26-36 GHz) interferometric array (in the Chilean Andes) of small (0.9m) dishes on a platform with baselines in the 1m to 6m range. The spatial resolution of the CBI is in the range, so (unlike the BIMA and OVRO arrays) it is suitable for S-Z measurements of nearby clusters. Some 9 clusters have already been observed with the CBI (Udomprasert et al. 2000).
S-Z observations at higher frequencies include measurements with the SuZIE array, and the PRONAOS and MITO telescopes. Three moderately distant clusters were measured with the small (2X3) SuZIE array: A1689 & A2163 (Holzapfel et al. 1997a, 1997b), and recently the cluster A1835 was observed at three spectral bands centered on 145, 221, 279 GHz (Mauskopf et al. 2000). Observations at four wide spectral bands (in the overall range of 285-1765 GHz) were made of A2163 with the PRONAOS atmospheric 2m telescope (Lamarre et al. 1998), leading to what seems to be the first detection of the effect by a balloon-borne experiment. The new 2.6m MITO telescope – which currently operates at four spectral bands and has a large beam – was used to observe the effect in the Coma cluster (D’Alba et al. 2001).
The sample of observed clusters now includes the distant (z=0.45) cluster RXJ 1347 which was measured to have the largest determined Comptonization parameter, (Pointecouteau et al. 1999). The observations were made with the Diabolo bolometer operating at the IRAM 30m radio telescope. The Diabolo has a beam, and a dual channel bolometer (centered on 2.1 and 1.2 mm). Four other clusters were also observed with the Diabolo bolometer (Desert et al. 1998).
4 The S-Z Effect as a Cosmological Probe
The fact that the S-Z effect is (essentially) independent of the cluster redshift makes it a unique cosmological probe. This feature, its simple well understood nature, and the expectation that the inherent systematic uncertainties associated mainly with modeling of the IC gas can be reduced, have led to ever growing observational and theoretical interest in using the effect for the determination of cluster properties and global cosmological parameters. (For extensive discussions of use of the effect as a probe, see the reviews by Rephaeli 1995a, and Birkinshaw 1999.)
In principle, high spatial resolution measurements of the S-Z effect yield the gas temperature and density profiles across the cluster. Cluster gas density and temperature profiles have so far been mostly deduced from X-ray measurements. S-Z measurements can more fully determine these profiles due to the linear dependence of on (and ), as compared to the dependence of the (thermal bremsstrahlung) X-ray brightness profile. This capability has been reached for the first time in the analysis of the interferometric BIMA and OVRO images (Carlstrom et al. 2001).
The cluster full mass profile, , can be derived directly from the gas density and temperature distributions by solving the equation of hydrostatic equilibrium (assuming, of course, the gas has reached such a state in the underlying gravitational potential). This method has already been employed in many analyses using X-ray deduced gas parameters (e.g. Fabricant et al. 1980). Grego et al. (2001) have recently used this method to determine total masses and gas mass fractions of 18 clusters based largely on the results of their interferometric S-Z measurements. Isothermal gas with the familiar density profile, , was assumed. The core radius, , and were determined from analysis of the S-Z data, whereas the X-ray value of the temperature was adopted. Mean values of the gas mass fraction were found to be in the range (where is the value of in units of km s-1 Mpc-1) for the currently popular open and flat, -dominated, CDM models. Note that the deduction of an approximate 3D density and temperature distributions from their sky-projected profiles requires use of a deprojection algorithm. Such an algorithm was developed by Zaroubi et al. (1998).
Measurement of the kinematic S-Z effect yields the line of sight component of the cluster peculiar velocity (). This is observationally feasible only in a narrow spectral band near the critical frequency, where the thermal effect vanishes while the kinematic effect – which is usually swamped by the much larger thermal component – is maximal (Rephaeli & Lahav 1991). SuZIE is the first experiment with a spectral band centered on the crossover frequency. Measurements of the clusters A1689 and A2163 (Holzapfel et al. 1997b) and A1835 (Mauskopf et al. 2000) yielded substantially uncertain results for (, , and km s-1, respectively). Balloon-borne measurements of the effect with PRONAOS have also yielded insignificant determination of the peculiar velocity of A2163 (Lamarre et al. 1998).
Most attention so far has been given to the determination of the Hubble constant, , and the cosmological density parameter, , from S-Z and X-ray measurements. Briefly, the method is based on determining the angular diameter distance, , from a combination of , the X-ray surface brightness, and their spatial profiles. Averaging over the first eight determinations of (from S-Z and X-ray measurements of seven clusters) yielded km s-1 Mpc-1 (Rephaeli 1995a), but the database was then very non-uniform and the errors did not include systematic uncertainties. Repeating this with a somewhat updated data set, Birkinshaw (1999) deduced essentially a similar mean value ( km s-1 Mpc-1), but noted that the individual measurements are not independent, so that a simple error estimation is not very meaningful. A much larger S-Z data set is now available from the interferometric BIMA and OVRO observations, and since the redshift range of the clusters in the sample is substantial, the dependence on is appreciable. A fit to 33 cluster distances gives km s-1 Mpc-1 for , and km s-1 Mpc-1 for , with direct observational errors of (Carlstrom et al. 2001). The main known sources of systematic uncertainties (see discussions in Rephaeli 1995a, and Birkinshaw 1999) are presumed to introduce an additional error of (Carlstrom et al. 2001). The current number of clusters with S-Z determined distances is sufficiently large that a plot of vs. redshift (a Hubble diagram) is now quite of interest, but with the present level of uncertainties the limits on the value of are not very meaningful (as can be seen from figure 11 of Carlstrom et al. 2001).
The S-Z effect induces anisotropy in the spatial distribution of the CMB (Sunyaev 1977, Rephaeli 1981); this is the main source of secondary anisotropy on angular scales of few arcminutes. The magnitude of the temperature anisotropy, can be as high as on angular scales of a few arcminutes, if the gas evolution in clusters is not too strong (Colafrancesco et al. 1994). Because of this, and the considerable interest in this range of angular scales – multipoles (in the representation of the CMB temperature in terms of spherical harmonics) – the S-Z anisotropy has been studied extensively in the last few years. The basic goal has been to determine the S-Z anisotropy in various cosmological, large scale structure, and IC gas models. The anisotropy is commonly characterized by the dependence of its power spectrum. The strong motivation for this is the need to accurately calculate the power spectrum of the full anisotropy in order to make precise global parameter determinations from the analysis of large stratospheric and satellite databases. In addition, mapping the S-Z anisotropy will yield direct information on the evolution of the cluster population.
Results from many calculations of the predicted S-Z anisotropy are not always consistent even for the same cosmological and large scale structure parameters. This is simply due to the fact that the calculation involves a large number of input parameters in addition to the global cosmological parameters (e.g. the present cluster density, and parameters characterizing the evolutionary history of IC gas), and the sensitive dependence of the anisotropy on some of these. The anisotropy can be more directly estimated from simulations of the S-Z sky, based largely on results from cluster X-ray surveys and the use of simple scaling relations (first implemented by Markevitch et al. 1992).
The observational capabilities of upcoming long duration balloon-borne experiments and satellites are expected to result in detailed mapping of the small angular scale anisotropy. These have motivated many recent works; Colafrancesco et al. (1997), and Kitayma et al. (1998), have calculated the S-Z cluster number counts in an array of open and flat cosmological and dark matter models, and da Silva et al. (1999) have carried out hydrodynamical simulations in order to generate S-Z maps and power spectra. Cooray et al. (2000) have, in particular, concluded that the planned multi-frequency survey with the Planck satellite should be able to distinguish between the primary and S-Z anisotropies, and measure the latter with sufficient precision to determine its power spectrum and higher order correlations.
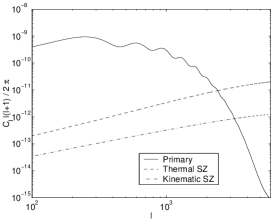
The main characteristics of the predicted power spectrum of the induced S-Z anisotropy are shown in Figure 3. Plotted are the angular power spectra, , vs. the multipole, , for both the primary and S-Z induced anisotropies in the (currently fashionable) flat cosmological model with (where is the cosmological constant) and with a CDM density parameter . The figure is from the work of Sadeh and Rephaeli (2001), who studied the S-Z anisotropy in the context of treatment (which is an extension of the approach adopted by Colafrancesco et al. 1997) which is based on a Press & Schechter cluster mass function, normalized by the observed X-ray luminosity function (see also Colafrancesco et al. 1994). IC gas was assumed to evolve in a simple manner consistent with the results of the EMSS survey carried out with the Einstein satellite. The primary anisotropy was calculated using the CMBFAST code of Seljak & Zaldarriaga (1996). The solid line shows the primary anisotropy which dominates over the S-Z anisotropy for . The S-Z power is largely due to the thermal effect; this rises with and is maximal around . In this model, the S-Z power spectrum contributes a fraction of 5% (10%) to the primary anisotropy at (). It can be concluded from this (and other studies) that the S-Z induced anisotropy has to be taken into account, if the extraction of the cosmological parameters from an analysis of measurements of the CMB power spectrum at is to be precise.
5 Future Prospects
The S-Z effect is a unique cosmological and cluster probe. In the near future sensitive observations of the effect with ground-based and balloon-borne telescopes, equipped with bolometric multi-frequency arrays, are expected to yield high-quality measurements of its spectral and spatial distributions in a The capability to measure the effect at several high-frequency bands (in the range GHz) will make it possible to exploit the S-Z characteristic spectrum as a powerful diagnostic tool. The main limitation on the accuracy of the cosmological parameters will continue to be due to systematic uncertainties. Therefore, the most significant results will be obtained from measurements of the effect in nearby clusters, , where systematic uncertainties can be most optimally reduced. The combination of S-Z measurements of a large number of clusters with the new generation of bolometric arrays, and the improved X-ray data which are currently available from observations of clusters with the XMM and Chandra satellites, will greatly improve the accuracy of the derived values of cluster masses, and of the Hubble constant. In particular, it will be possible to measure with an overall uncertainty of just .
References
- Birkinshaw (1999) Birkinshaw, M. (1999) Title, Phys.Rep., 310, p.97
- Carlstrom et al. (1996) Carlstrom, J.E., Joy, M. and Grego, L. (1996), ApJ, 456, p. L75
- Carlstrom et al. (1999) Carlstrom, J.E. et al. (1999), Physica Scripta, 60
- Carlstrom et al. (2001) Carlstrom, J.E. et al. (2001), astro-ph/0103480
- Colafrancesco et al. (1994) Colafrancesco, S., Mazzotta, P., Rephaeli, Y. and Vittorio, N. (1994), ApJ, 433, p.454
- Colafrancesco et al. (1997) Colafrancesco, S., Mazzotta, P., Rephaeli, Y. and Vittorio, N. (1997), ApJ, 479, p.1
- Challinor and Lasenby (1998) Challinor, A. and Lasenby, A. (1998), ApJ, 510, p.930
- Cooray et al. (2000) Cooray, L., Hu, W. and Tegmark, M. (2000), astro-ph/0002238.
- D’Alba et al. (2001) D’Alba, L. et al. (2001), astro-ph/0010084
- da Silva et al. (1999) da Silva, A.C. et al. (1999), astro-ph/9907224
- Desert et al. (1998) Desert, F.X. et al. (1998), New Astron., 3, p.655
- Fabricant et al. (1980) Fabricant, D.M., Lecar, M. and Gorenstein, P. (1980), ApJ, 241, p.552
- Grego et al. (2001) Grego, L. et al. (2001), ApJ, in press
- Holzapfel et al. (1997a) Holzapfel, W.L. et al. (1997a), ApJ, 480, p.449
- Holzapfel et al. (1997b) Holzapfel, W.L. et al. (1997b), ApJ, 481, p.35
- Hughes and Birkinshaw (1998) Hughes, J.P. and Birkinshaw, M. (1998), ApJ, 501, p.1
- Itoh et al. (1998) Itoh, N., Kohyama, Y. and Nozawa, S. (1998), ApJ, 502, p.7
- Itoh et al. (2000) Itoh, N., Nozawa, S. and Kohyama, Y. (2000), astro-ph/0005390
- Jones et al. (1993) Jones, M. et al. (1993), Nature, 365, p.320
- Kitayama et al. (1998) Kitayama, T et al. (1998), PASJ, 50, p.1
- Kompaneets (1957) Kompaneets, A.S. (1957), Soviet Phys.-JETP, 4, p.730
- Lamarre et al. (1998) Lamarre, J.M. et al. (1998), ApJ, 507, p.L5
- Markevitch et al. (1998) Markevitch, M. et al. (1998), ApJ, 395, p.326
- Mauskopf et al. (2001) Mauskopf, P.D. et al. (2001), ApJ, 538, p.505
- Nozawa et al. (1998a) Nozawa, S., Itoh, N. and Kohyama, Y. (1998a), ApJ, 507, p.530
- Nozawa et al. (1998b) Nozawa, S., Itoh, N. and Kohyama, Y. (1998b), ApJ, 508, p.17
- Nozawa et al. (2000) Nozawa, S. et al. (2000), ApJ, 536, p.31
- Pointecouteau et al. (1999) Pointecouteau, E. et al. (1999), ApJ, 519, p.L115
- Rephaeli (1981) Rephaeli, Y. (1981), ApJ, 351, p.245
- Rephaeli (1995a) Rephaeli, Y. (1995a), ARAA, 33, p.541
- Rephaeli (1995b) Rephaeli, Y. (1995b), ApJ, 445, p.33
- Rephaeli and Lahav (1991) Rephaeli, Y. and Lahav, O. (1991), ApJ, 372, p.21
- Rephaeli and Yankovitch (1997) Rephaeli, Y. and Yankovitch, D. (1997), ApJ, 481, p.L55
- Sadeh and Rephaeli (2001) Sadeh, S. and Rephaeli, Y. (2001), preprint
- Sazonov and Sunyaev (1998) Sazonov, S.Y. and Sunyaev, S.Y. (1998), ApJ, 508, p.1
- Sazonov and Sunyaev (1999) Sazonov, S.Y. and Sunyaev, S.Y. (1999), MN, 310, p.765
- Seljak and Zaldarriaga (1996) Seljak, U. and Zaldarriaga, M. (1996), ApJ, 469, p.437
- Shimon and Rephaeli (2001) Shimon, M. and Rephaeli, Y. (2001), preprint
- Sunyaev (1977) Sunyaev, R.A. (1977), Comm.Ap.Sp.Phys., 7, p.1
- Sunyaev and Zeldovich (1972) Sunyaev, R.A. and Zeldovich, Y.B. (1972), Comm.Ap.Sp.Phys., 4, p.173
- Sunyaev and Zeldovich (1980) Sunyaev, R.A. and Zeldovich, Y.B. (1980), MN, 190, p.413
- Udomprasert et al. (2000) Udomprasert, P.S., Mason, B.S. and Readhead, A.C.S. (2000), astro-ph/0012248
- Zaroubi (1998) Zaroubi, S., et al. (1998), ApJ, 500, p.L87
- Zeldovich and Sunyaev (1969) Zeldovich, Y.B. and Sunyaev, R.A., (1969), Comm.Ap.Sp.Phys., 4, p.301