Is There an Advection Dominated Accretion Flow in Radio Galaxies with Double-Peaked Balmer Lines ?
Abstract
In order to examine the prediction that the broad-line radio galaxies (BLRGs) with double-peaked Balmer lines harbor an accretion disk characterized by an advection-dominated accretion flow (ADAF) in their nuclei, we investigate narrow emission-line flux ratios of the narrow-line regions which are photoionized by the nuclear continuum radiation. We compile data from the literature and confirm the pioneering work of Eracleous & Halpern that the BLRGs with the double-peaked Balmer emission exhibit larger flux ratios of both [O i]6300/[O iii]5007 and [O ii]3727/[O iii]5007 than the BLRGs without the double-peaked Balmer emission. To examine whether or not these properties are attributed to the difference in the spectral energy distribution (SED) of the ionizing radiation between the BLRGs with and without the double-peaked Balmer emission, we perform photoionization model calculations using two types of input continuum radiation; one has the strong big blue bump which is expected for standard optically-thick accretion disks and another does not exhibit a strong big blue bump as expected for optically-thin ADAFs. We find that the data of the BLRGs with the double-peaked Balmer lines are consistent with the models adopting the SED without a strong big blue bump while the data of the BLRGs without the double-peaked emission lines are well described by the models adopting the SED with a strong big blue bump. On the other hand, the observed differences in the NLR emission is hard to be explain by the difference in the contribution of shocks. These results support the idea that the double-peaked Balmer lines arise at an outer region of an accretion disk which is illuminated by an inner, geometrically-thick ADAF.
Subject headings:
accretion, accretion disks - galaxies: active - galaxies: nuclei - line: profiles - quasars: emission lines1. INTRODUCTION

It has been reported that double-peaked broad Balmer lines are seen in the optical spectra of some broad-line radio galaxies (BLRGs) [e.g., Osterbrock, Koski, & Phillips 1976; Halpern & Filippenko 1988; Pérez et al. 1988; Halpern 1990; Veilleux & Zheng 1991; Colina, Lípari, & Macchetto 1991; Eracleous & Halpern 1994 (EH94); Halpern & Eracleous 1994; Sulentic et al. 1995; Halpern et al. 1996] and LINERs (e.g., Storchi-Bergmann, Baldwin, & Wilson 1993; Bower et al. 1996; Ho et al. 2000; Shields et al. 2001). Since this remarkable feature may contain kinematical and geometrical information concerning the ionized gas in broad-line regions (BLRs), various models for the double-peaked emission line have been proposed up to now. Among such models, the disk-BLR model, in which the double-peaked profile is explained taking account of accretion disks as an emitter of broad emission lines, has been often investigated since Pérez et al. (1988) reported that the profile of the H emission of 3C 390.3 can be well fitted by a relativistic accretion disk model [see also Chen, Halpern, & Filippenko 1989 (CHF89); Chen & Halpern 1989 (CH89)]. However, the gravitational energy released in a standard, geometrically-thin and optically-thick accretion disk is insufficient to account for the luminosity of the BLR emission (CHF89; EH94). Moreover, if the standard disk is assumed, the effective temperature in the region where the BLR emission is expected to arise is calculated to be less than 5000 K, which is too low in BLRs (CHF89; see also Collin-Souffrin 1987). Therefore, an external heating source is required for an accretion disk to be a source of the BLR emission.
When the mass accretion rate is small compared to the Eddington value, ions in the inner disk become very hot because of lack of an efficient cooling process. The resulting high pressure produces puffed-up structure with nearly spherical inflow, which is generally called advection-dominated accretion flow (ADAF; e.g., Ichimaru 1977; Rees et al. 1982; Narayan & Yi 1995). CHF89 pointed out that this geometrically-thick ADAF can illuminate an outer disk that remains geometrically thin (see also CH89; Shields et al. 2001). This supplied energy enables the outer thin disk to radiate the BLR emission, giving rise to the double-peaked broad Balmer lines. When the mass accretion rate is high, on the contrary, we see only single-peaked (“normal”) Balmer lines which may arise in more distant regions from the nucleus compared to an accretion disk111 Eracleous & Halpern (1994) found that the BLRGs with double-peaked emission lines tend to have larger line width (both FWHM and FWZI) than those without double-peaked emission lines. This suggests that the double-peaked emission lines originate closer to the central black hole than the single-peaked broad emission lines. However, the configuration of the gas clouds emitting the single-peaked broad emission lines is not well understood. For instance, Rokaki, Boisson, & Collin-Souffrin (1992) reported that even the single-peaked broad emission lines can be fitted by some appropriate disk models (see also Corbin 1997). On the other hand, Chiang & Murray (1996) pointed out that some parts of single-peaked broad emission may come from the winds emanating from accretion disks (see also Murray & Chiang 1997). .These two situations are shown in Figure 1. This scheme seems interesting because it explains why BLRGs do not always show the double-peaked Balmer lines.
Since the ADAFs are optically thin, they do not exhibit a strong big blue bump (BBB), i.e., a thermal blue/UV component, in their spectra. Therefore, the above scheme (hereafter “illuminated-disk model”) predicts that an evident difference in the spectral energy distribution (SED) in the wavelength of UV to X-ray is expected between the BLRGs with and without the double-peaked Balmer lines (e.g., EH94). Indeed, CHF89 reported that there is no evidence for the strong BBB in Arp 102B, which is a typical example of BLRGs with double-peaked Balmer lines (see also Edelson & Malkan 1986). However, since most of the BLRGs are rather faint, the difference in the SED is hard to be observed directly, except for a few exceptions. EH94 mentioned that the difference in the SED between standard thin disks and ADAFs may affect the physical properties of ionized gas in narrow-line regions (NLRs) which are photoionized by the nuclear continuum radiation. They found that the BLRGs with double-peaked Balmer lines exhibit stronger [O i]6300 emission, which arises at NLRs, than those without double-peaked Balmer lines. This can be interpreted as the effect of the harder SED of ADAFs (see also Halpern & Eracleous 1994; Halpern 1999; Ho et al. 2000). However, there is no study to examine this interpretation quantitatively based on photoionization models. Therefore, we investigate the properties of the NLRs in the BLRGs with/without the double-peaked Balmer lines in this paper to examine whether or not the observed difference in the narrow emission-line flux ratios is owing to the difference in the SED. This attempt seems crucially important toward the understanding of not only the origin of the double-peaked emission lines but also the configuration of BLRs and accretion disks in active galactic nuclei (AGNs).
2. DATA
2.1. Classification
EH94 classified 94 BLRGs into five classes based on the profile of the H emission as follows; (1) the BLRGs with double-peaked H emission whose blue peak is stronger than the red peak and whose profile can be fitted by their relativistic disk models (12 BLRGs), (2) the BLRGs with double-peaked H emission whose blue peak is stronger than that of red peak but whose profile cannot be fitted by their relativistic disk models (4 BLRGs), (3) the BLRGs with double-peaked H emission whose red peak is stronger than the blue peak (6 BLRGs), (4) the BLRGs without double-peaked H emission but their profile show a pronounced asymmetry or a single displaced peak (9 BLRGs), and (5) the BLRGs with normal single-peaked H emission (63 BLRGs).
Here it should be noted that EH94 adopted simple relativistic disk models described by CHF89 and CH89 to fit the observed H profiles. Since these models cannot explain the observed double-peaked profiles whose red peak is stronger than the blue peak, EH94 treated only BLRGs categorized in the class of (1) as “disk-like emitters”. EH94 compared the statistical properties of the 12 disk-like emitters with those of the other 82 BLRGs in order to investigate the origin of the double-peaked Balmer lines. However, it is now recognized that some modified relativistic disk models can successfully reconstruct the profiles of double-peaked Balmer lines which cannot be explained by the models of CHF89 and CH89; e.g., disk plus hot patch models (Veilleux & Zheng 1991; Zheng, Veilleux, & Grandi 1991), accretion disk with two-arm spiral waves (Chakrabarti & Wiita 1994), and elliptical disk models (Eracleous et al. 1995; see also Syer & Clarke 1992). Therefore, we treat the first three classes of EH94 as “double-peaked BLRG” regardless of the peak strength ratio. These objects are expected to harbor a geometrically-thick ADAF in their nuclei if the illuminated-disk model is the case. Then, we call the class (4) of EH94 as “intermediate BLRG”. It is not clear whether or not the objects in this class have the ADAFs and the illuminated thin disk in their nucleus. And finally, we call the BLRG with normal single-peaked H emission as “single-peaked BLRG”. The objects in this class are expected not to have an evolved geometrically-thick ADAF. Note that a BLRG, Pictor A, is classified as a double-peak BLRG in this paper though it was classified as (5) by EH94, following some recent reports that Pictor A also has double-peaked Balmer emission (Halpern & Eracleous 1994; Sulentic et al. 1995). In summary, the EH94 sample is divided into three groups: 23 double-peaked BLRGs, 9 intermediate-type BLRGs, and 62 single-peaked BLRGs.
2.2. Data Compilation
In order to investigate the properties of ionized gas in NLRs for each group of BLRGs, we compiled data of forbidden emission-line flux ratios of the EH94 sample from the literature. The compiled emission-line flux ratios are [O i]6300/[O iii]5007, [O ii]3727/[O iii]5007, [S ii]6717,6731/[O iii]5007, and [Ne iii]3869/[O ii]3727, which are given in Table 1. For the case that a certain emission-line flux ratio of a certain object is given by more than one paper, the averaged value is given in this table. Here we do not use Balmer lines, because the narrow Balmer components of broad-line objects are often hard to measure correctly (see, e.g., Nagao, Murayama, & Taniguchi 2001c). For the same reason, estimating the amount of extinction by the Balmer decrement method (e.g., Osterbrock 1989) cannot be adopted. We cannot use other methods (e.g., using the flux ratio of [S ii]4071/[S ii]10320) because of small number of available emission-line data. Therefore, we do not make the reddening correction for the data. Note that the dust reddening of NLR emission of broad-line objects are small in general (e.g., De Zotti & Gaskell 1985; Dahari & De Robertis 1988). The data presented in Table 1 are not corrected for Galactic reddening. The effect of dust extinction on our results is discussed in section 4.2.
3. THE NARROW EMISSION-LINE FLUX RATIOS

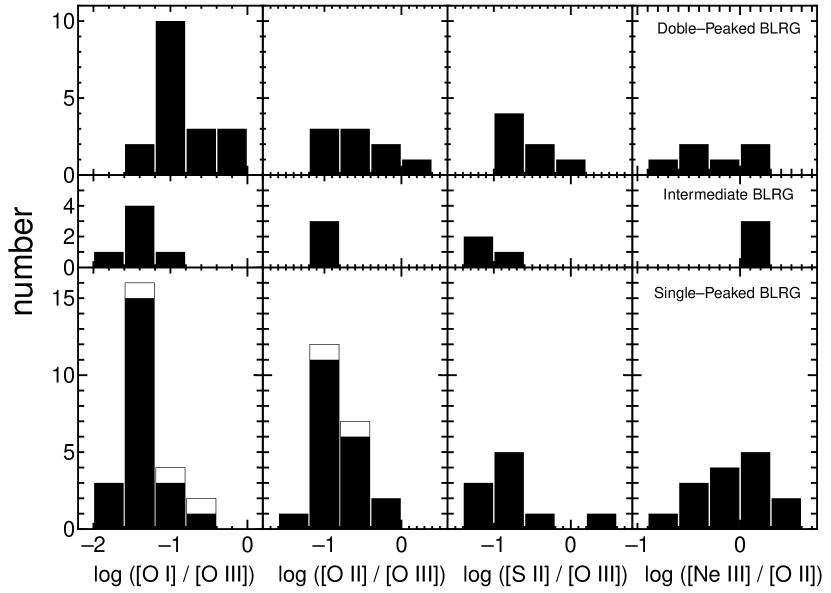
In Figure 2, we show the frequency distributions of the emission-line flux ratios of [O i]6300/[O iii]5007, [O ii]3727/[O iii]5007, [S ii]6717,6731/[O iii]5007, and [Ne iii]3869/[O ii]3727, for the double-peaked BLRGs, the intermediate BLRGs, and the single-peaked BLRGs, respectively. The mean and median values of each flux ratio for each class of BLRG are given in Table 2. Figure 2 and Table 2 clearly show that the double-peaked BLRGs exhibit larger ratios of [O i]6300/[O iii]5007 than the single-peaked BLRGs. In order to examine whether or not this difference is statistically real, we apply the Kolmogorov-Smirnov (KS) statistical test. The KS test results in a probability that the observed frequency distributions of [O i]6300/[O iii]5007 of the double-peak BLRGs and the single-peak BLRGs originate in the same underlying population of 1.21 10-5. Thus, we conclude that the flux ratio of [O i]6300/[O iii]5007 of the double-peaked BLRGs is statistically larger than that of the single-peaked BLRGs. Note that this result is consistent with the earlier remark of EH94. Although the frequency distribution of the flux ratio of [O i]6300/[O iii]5007 for the intermediate BLRGs appears to resemble that for the single-peaked BLRGs and to be different from that for the double-peaked BLRGs, it is not conclusive since the number of the sample is too small.
We cannot conclude whether or not there is any statistical difference in the flux ratios of [O ii]3727/[O iii]5007, [S ii]6717,6731/[O iii]5007 and [Ne iii]3869/[O ii]3727 among the classes of BLRGs, because the number of the objects for which these flux ratios have been measured is too small. We mention, however, that the flux ratio of [O ii]3727/[O iii]5007 appears to show the same tendency as the flux ratio of [O i]6300/[O iii]5007, i.e., the double-peaked BLRGs exhibit larger flux ratios than the single-peaked BLRGs. Note that we do not find significant difference in the flux ratio of [S ii]6717,6731/[O iii]5007 between the double-peaked BLRGs and the single-peaked BLRGs. This seems rather inconsistent with the result of EH94 that the disk-like emitters (in the definition of EH94) present larger equivalent width of [S ii]6717,6731 than the other BLRGs though the equivalent width of [O iii]5007 is similar between the disk-like emitters and the other BLRGs.
EH94 mentioned that the higher [O i]6300/[O iii]5007 ratio in double-peaked BLRGs is attributed to the relatively harder ionizing SED arising from a nuclear ADAF, which illuminates an outer thin disk and then causes the double-peaked profiles of Balmer lines (see also Halpern 1999). However, there are other possibilities that make the flux ratio of [O i]6300/[O iii]5007 high. For instance, since the critical density of the [O i]6300 transition (1.8 106 cm-3) is higher than that of the [O iii]5007 transition (7.0 105 cm-3), a high ratio of the [O i]6300/[O iii]5007 is achieved when the typical gas density is high. Thus the difference in the flux ratio of [O i]6300/[O iii]5007 between the double-peaked BLRGs and the single-peaked BLRGs may be attributed to the difference in the typical gas density in NLRs. The lower ionization parameter (i.e., the ratio of the ionizing photon density to the hydrogen density) in NLRs of the double-peaked BLRGs may be also responsible for the observed difference in the narrow emission-line flux ratios. These possibilities would not be discriminated without photoionization model calculations taking account of the SED difference predicted by the illuminated-disk model, which are presented in the following section.
4. PHOTOIONIZATION MODEL CALCULATIONS
4.1. Method
As described in section 1, the illuminated-disk model hypothesizes that the double-peaked BLRGs harbor an ADAF in their nucleus while the single-peaked BLRGs do not. In order to investigate the effect of this difference on the gas in the NLRs and on the narrow emission-line flux ratios, we perform photoionization model calculations using the publicly available code version 94.00 (Ferland 1997, 2000). Here we assume uniform density gas clouds with a plane-parallel geometry. The parameters for the calculations are (I) the hydrogen density of a cloud (), (II) the ionization parameter (), (III) the chemical composition of the gas, and (IV) the shape of the SED of the input continuum radiation. We perform several model runs covering the following ranges of parameters: 102.0 cm-3 105.0 cm-3 and 10-4.0 10-1.5. We set the gas-phase elemental abundances to be the solar ones. The adopted solar abundances relative to hydrogen are taken from Grevesse & Anders (1989) with extensions by Grevesse & Noels (1993). For simplification, dust grains in NLRs are not taken into account in our calculations.
We prepare the two SED templates for the input continuum radiation. One is a typical SED for an optically-thick, geometrically-thin accretion disk. This is characterized by a strong BBB in the wavelength range of UV–to–X-ray. We adopt the empirically constructed SED (see Nagao, Murayama, & Taniguchi 2001a) for this type of SED template (hereafter “SED with BBB”). This SED is described by the following function:
| (1) |
(see Ferland 1997; Nagao et al. 2001a). Here the following parameter set is adopted (Nagao et al. 2001a): (i) the infrared cutoff of the big blue bump component, = 0.01 Ryd, (ii) the slope of the low-energy side of the big blue bump, = –0.5, (iii) the UV–to–X-ray spectral index, = –1.35, (iv) the slope of the X-ray power-law continuum, = –0.85, and (v) the characteristic temperature of the big blue bump, = 490,000 K222This temperature is adopted to reproduce the observed soft X-ray index of nearby AGNs measured by ROSAT. See Nagao et al. (2001a) for more details.. Note that the parameter in the equation (1) is determined from the adopted value of . The last term in equation (1) is not extrapolated below 1.36 eV or above 100 keV. Below 1.36 eV the last term is simply set to zero. Above 100 keV the continuum is assumed to fall off as . The other template is a typical SED for an optically-thin ADAF. The SEDs produced by the optically-thin ADAF are expected to exhibit no strong BBB. Recently, many efforts have been made to estimate the SED generated by ADAFs theoretically (e.g., Narayan & Yi 1995; Chen, Abramowicz, & Lasota 1997; Narayan, Kato, Honma 1997; Manmoto, Mineshige, & Kusunose 1997; Kurpiewski & Jaroszyński 1999; Quataert & Narayan 1999; Manmoto 2000; Kino, Kaburaki, & Yamazaki 2000). There are, accordingly, various shapes of the calculated SEDs. Among them, we follow the SED presented by Kurpiewski & Jaroszyński (1999) for the template (hereafter “SED without BBB”). This SED exhibits no BBB component and is roughly described by single power-law continua in the range of 1012 Hz to 1020 Hz. We choose the photon index of = –0.89 (), which is predicted for the case that a non-rotating black hole is assumed (see Kurpiewski & Jaroszyński 1999). This SED is expressed by the simple power-law spectra with the exponential cutoffs at 10-4.0 Ryd and 104.0 Ryd. In this way, we have prepared the two SED templates (see Figure 3). Note that these SED templates may be too simple to predict accurate emission-line spectra radiated from NLRs in BLRGs. However, these rough SEDs can be used to investigate the effect of the presence or absence of the BBB component, which is the main difference in the SED between the accretion disk with/without an ADAF.
The calculations are stopped when the temperature falls to 3000 K, below which the gas does not contribute significantly to the observed optical emission-line spectra.
4.2. Results of Model Calculations

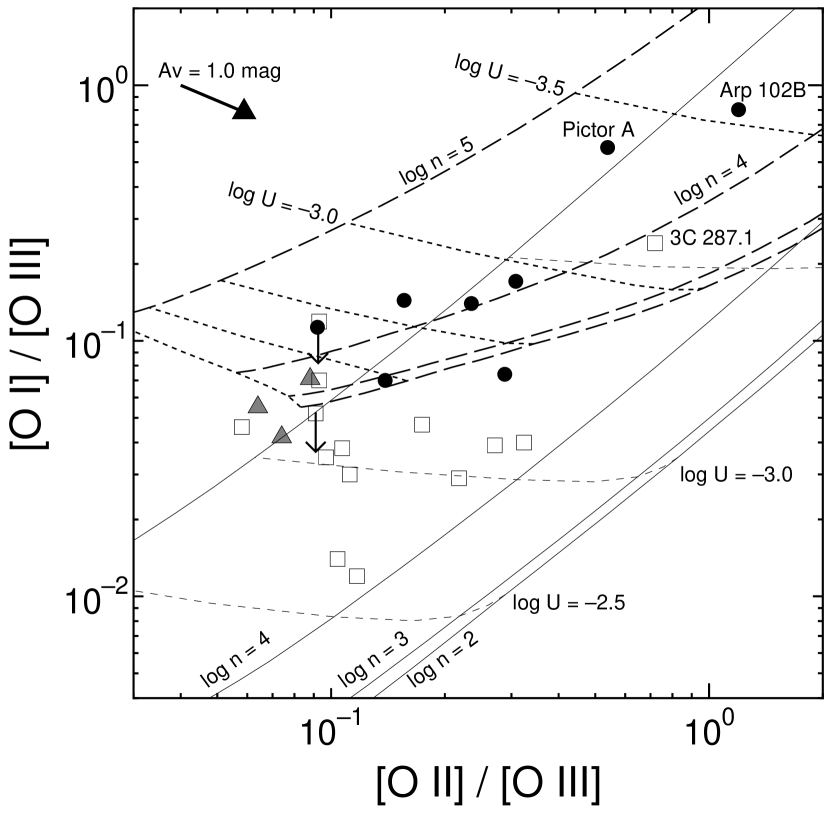
We show the results of the model calculations and compare them with the observations in Figure 4, which is a diagram of [O i]6300/[O iii]5007 versus [O ii]3727/[O iii]5007. This diagnostic diagram has been frequently used to discuss physical properties of gas in ionized regions (e.g., Baldwin, Phillips, & Terlevich 1981). As mentioned at section 2.2, the plotted data are not corrected for dust extinction. The data points will move on Figure 4 as shown by the thick arrow if the extinction correction of = 1.0 mag is applied. Note that the direction of the extinction correction is perpendicular to the direction of the difference between the data of the double-peak and single-peak BLRGs. This suggests that the difference in the narrow emission-line flux ratios between the double-peaked and single-peaked BLRGs is not caused mainly by the difference in the degree of the dust extinction. Although the data points are clearly separated between the double-peaked and single-peaked BLRGs in Figure 4, there is an exceptional object, 3C 287.1; this object is classified as a single-peaked BLRG while its locus on Figure 4 is far from the other single-peaked BLRGs. This object, on the contrary, appears to belong to the class of the double-peaked BLRG in terms of the narrow emission-line flux ratios. We speculate that this is due to the misclassification of 3C 287.1, because the red displaced peak of H is clearly seen between [N ii]6583 and [S ii]6717 in the optical spectra of this object, presented by EH94. Further observation for 3C 287.1 is necessary to examine this speculation.
As shown in Figure 4, the models adopting the SED without BBB predict a higher [O i]6300/[O iii]5007 ratio by an order of magnitude than the models adopting the SED with BBB. This tendency is consistent with the observations; i.e., the observed data of the single-peaked BLRGs are explained by the models adopting the SED with BBB in the ranges of and 104.0 cm-3 105.0 cm-3 while the observed data of the double-peak BLRGs appear to be explained introducing the models adopting the SED without BBB.
The larger flux ratios of [O i]6300/[O iii]5007 in the models adopting the SED without BBB are attributed to the fact that the SED without BBB has harder spectra, which create larger partially-ionized regions in NLRs. To see the effect of the SED shape on the ionization structure of gas in NLRs, we show the ionization fractions of hydrogen and oxygen as functions of depth into the nebula for the cases of = 102.0 cm-3 and 105.0 cm-3 in Figure 5. Here = is adopted. As shown in the top panels of Figure 5, partially ionized regions become large when the SED without BBB is adopted, compared to the case that the SED with BBB is adopted. Accordingly, the volume emissivities of low-ionization emission lines such as [O i]6300 and [O ii]3727 are higher at larger radii from the ionization source in the case that the SED without BBB is adopted, as shown in the bottom panels of Figure 5. Note that the ionization structure in the nebula is almost independent of the gas density as shown in Figure 5, though the volume emissivities of the forbidden emission lines depend on the density.
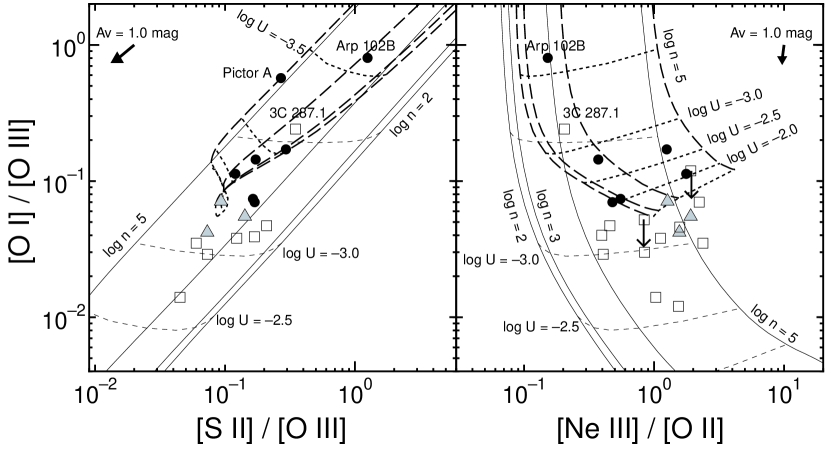
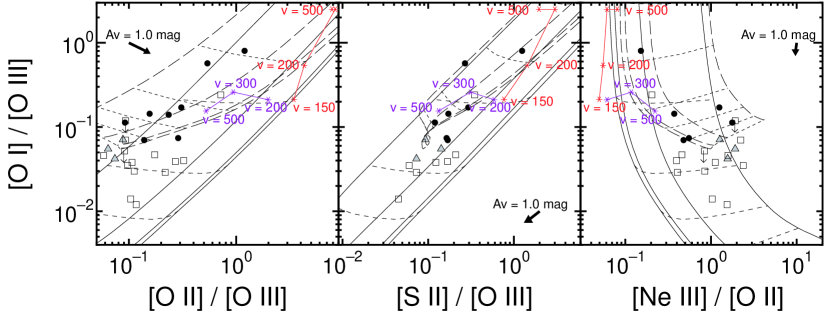
We also compare the observations with the model predictions in other diagnostic diagrams, which are presented in Figure 6. They are diagrams of [O i]6300/[O iii]5007 versus [S ii]6717,6731/[O iii]5007 and [O i]6300/[O iii]5007 versus [Ne iii]3869/[O ii]3727. Similarly to the trend in Figure 4, the data of the double-peaked BLRGs and the single-peaked BLRGs are also well separated in these diagnostic diagrams. This difference in the location of the data on the two diagrams is well explained by the idea that the gas in NLRs of the single-peaked BLRGs is photoionized by the SED with BBB while that of the double-peaked BLRGs is photoionized by the SED without BBB, which is expected in the framework of the illuminated-disk model. It is noted that 3C 287.1 is again located far from the other single-peaked BLRGs but beside the double-peaked BLRGs in the two diagrams shown in Figure 6.
5. Discussion
As presented in section 4.2, the observed difference in the narrow emission-line flux ratios can be explained consistently by the photoionization models if we take account of the SED difference between the double-peaked and the single-peaked BLRGs, which is predicted by the illuminated-disk model. However, the SED without BBB may not be a unique way to explain the difference in the observed emission-line flux ratios between the double-peaked and the single-peaked BLRGs. For instance, systematic differences in the physical properties of gas in NLRs could be the origin of the difference in the narrow emission-line flux ratios. As mentioned in section 3, the difference in the flux ratio of [O i]6300/[O iii]5007 can be also explained if the gas density in NLRs is systematically different between the two populations of BLRGs. This possibility is, however, rejected as we compare the observations with the model predictions in the diagnostic diagrams shown in Figures 4 and 6. These diagnostic diagrams suggest that there is no difference in the gas density between the double-peaked and single-peaked BLRGs if we adopted only the models with the SED with BBB (104.0 cm-3 105.0 cm-3). This means that the observed difference in the flux ratio of [O i]6300/[O iii]5007 is not caused only by a difference in the gas density in NLRs.
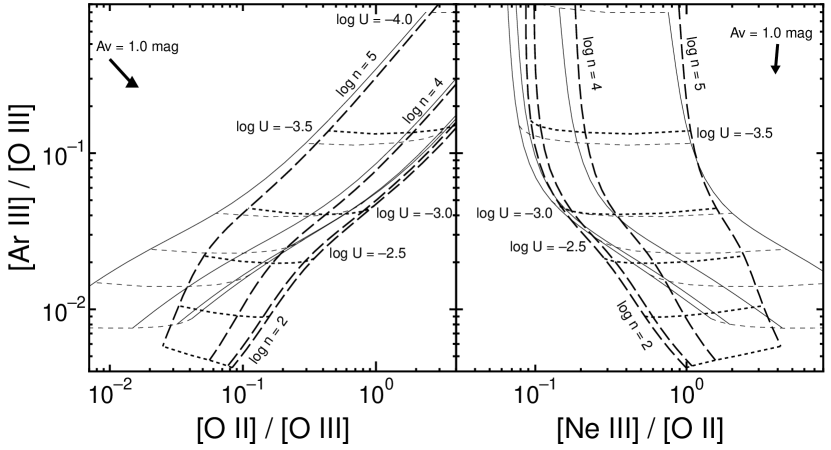
There is another possibility which can explain the observed difference in the narrow emission-line flux ratios without introducing the SED difference. Since the effect of the SED difference and the varying sequence are degenerated as displayed in Figures 4 and 6, a systematic difference in the ionization parameter of gas in NLRs between the double-peaked and the single-peaked BLRGs can be also responsible for the difference in the emission-line flux ratios. Note that Pictor A and Arp 102B, which are double-peaked BLRGs, exhibit too strong low-ionization emission lines to be explained only by the effect of the SED difference. Here it should be noted that ADAFs are expected to radiate a small number of ionizing photons compared to the standard disks, which leads to a small ionization parameter of the gas in NLRs if the gas density and the distance from the nucleus of the NLRs are independent of the type of the accretion flow in their nuclei. EH94 reported that the double-peaked BLRGs exhibit weaker non-stellar continuum radiation in optical spectra than the single-peaked BLRGs. Therefore, the difference in the narrow emission-line flux ratios between the double-peaked and the single-peaked BLRGs may be attributed to the effects of both the SED shape and the ionization parameter. Unfortunately, the current information about the narrow emission-line spectra of BLRGs is insufficient to examine the contribution of these two effects. In order to investigate this issue, future observations of optical spectra with sufficient quality (i.e., measurable rather faint emission lines) for a large sample of BLRGs is crucially necessary. For the sake of demonstration, we show two diagnostic diagrams which are possibly useful to solve the degeneracy of the effects of the SED shape and of the ionization parameter in Figure 7, in which a diagram of [Ar iii]7136/[O iii]5007 versus [O ii]3727/[O iii]5007 and a diagram of [Ar iii]7136/[O iii]5007 versus [Ne iii]3869/[O ii]3727 are displayed. Since the flux ratio of [Ar iii]7136/[O iii]5007 is almost independent of the shape of the SED especially in the range of , these diagnostic diagrams can be used to determine the ionization parameter. Then we will be able to discuss the effect of the SED shape solely, taking account of other information of the emission-line spectra.
The biconical radial outflow of gas in BLRs has been often discussed as the possible origin of the double-peaked Balmer lines as well as the illuminated-disk model (e.g., Zheng, Binette, & Sulentic 1990; Zheng et al. 1991). Here we discuss whether or not the properties of NLR emission presented in this paper constrain this radial outflow model. Since this model does not require any special accretion mechanism to generate the double-peaked Balmer lines, there is no reason to introduce the difference in the nuclear ionizing radiation between the double-peaked and the single-peaked BLRGs. However, narrow emission-line flux ratios would be different between the two groups of the BLRG if the outflow in BLRs of double-peaked BLRGs affects the outer regions and then causes a shock wave in NLRs. Since shocks generate a large partially-ionized region in the gas, strong low-ionization emission lines such as [O i]6300 arise from such shock-heated gas (Mouri, Kawara, & Taniguchi 2000 and reference therein), which seems consistent with the fact that double-peaked BLRGs exhibit stronger low-ionization emission lines than single-peaked BLRGs. Note that Stauffer, Schild, & Keel (1983) mentioned that the strong low-ionization emission lines exhibited in the spectrum of Arp 102B, a prototype of double-peaked BLRG, may be attributed to shock excitation. In order to examine whether or not the shock heating by the outflowing material of the double-peaked BLRGs is responsible for the difference in the narrow emission-line flux ratios between the double-peaked and the single-peaked BLRGs, we plot the predictions of the shock models presented by Dopita & Sutherland (1995) on the diagnostic diagrams of [O i]6300/[O iii]5007 versus [O ii]3727/[O iii]5007, [S ii]6717,6731/[O iii]5007, and [Ne iii]3869/[O ii]3727 (Figure 8). The shock models appear to predict too large flux ratios of [O ii]3727/[O iii]5007 and too small flux ratios of [Ne iii]3869/[O ii]3727 compared to the data of the double-peaked BLRGs. These results suggest that the difference in the narrow emission-line flux ratios is not caused by the shock-heated gas in NLRs. Therefore, the biconical radial outflow model seems less reasonable for the double-peaked Balmer lines. Note, however, that this result is not conclusive because we cannot exclude the possibility that the NLR emission of the double-peaked BLRGs is contributed by the shock-heated gas. For instance, the flux ratio of [Ne iii]3869/[O ii]3727 may be possibly lower in the double-peaked BLRGs than in the single-peaked BLRGs (see Table 2), although it cannot be examined statistically due to the small number of objects.
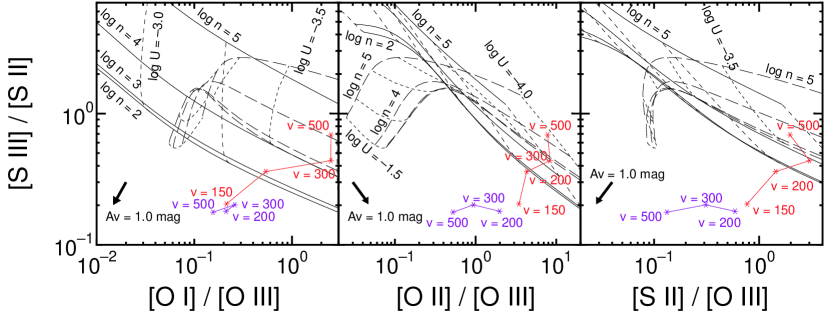
Then, which emission-line flux ratio can be used to discriminate between shocks and photoionization? The flux ratio of [O iii]4363/[O iii]5007, which is one of temperature indicators, has been often regarded as a powerful tool to discriminate between shocks and photoionization (e.g., Koski & Osterbrock 1976; Heckman 1980; Ferland & Netzer 1983; Rose & Cecil 1983; Keel & Miller 1983; Rose & Tripicco 1984). However, Nagao, Murayama, & Taniguchi (2001b) pointed out that high ratios of [O iii]4363/[O iii]5007 do not always mean the shock excitation. They showed that the photoionization models in which high-density gas clouds are taken into account can explain the observed high ratios of [O iii]4363/[O iii]5007 (see also Nagao et al. 2001c). Therefore, we focus on the emission-line flux ratio of [S iii]9532/[S ii]6717,6731. This flux ratio is expected to be low when the gas is excited by shocks, because S2+ ions cool predominantly by emission of UV lines due to the higher temperature and thus the [S iii]9532 line becomes weak when the shock contributes to the excitation significantly (e.g., Dopita 1977; Díaz, Pagel, & Wilson 1985; Díaz, Terlevich, & Pagel 1985; Bonatto, Bica, & Alloin 1989; Kirhakos & Phillips 1989; Simpson et al. 1996). Note that this tool can work even in the case that the gas density is rather high, being different from the flux ratio of [O iii]4363/[O iii]5007. We compare the photoionization models adopting the SED with/without BBB with the shock models on the diagrams of [S iii]9532/[S ii]6717,6731 versus [O i]6300/[O iii]5007, [O ii]3727/[O iii]5007, and [S ii]6717,6731/[O iii]5007 (Figure 9). It is clearly shown that these diagnostic diagrams can be used to discriminate between shock and photoionization. Further observations of the [S iii]9532 emission will make it clear whether or not the observed differences in the narrow emission-line flux ratios between the double-peaked and single-peaked BLRGs are attributed to the shock excitation.
Now we mention the intermediate BLRGs. On the diagnostic diagrams presented in Figures 4 and 6, the data of the intermediate BLRGs appear to concentrate near the data of the single-peaked BLRGs and to be separated from the data of the double-peaked BLRGs. Moreover, it seems hard to explain the observed emission-line flux ratios of the intermediate BLRGs by the photoionization models adopting the SED without BBB, since unreasonably large ionization parameters () are required (see Figures 4 and 6). This suggests that the gas clouds in NLRs of the intermediate BLRGs are photoionized by the ionizing continuum with BBB, which is expected in the case that the accretion disk in their nuclei is characterized by a standard optically-thick (and geometrically-thin) disk. We thus speculate that an ADAF occupies only a very small part of the inner accretion disk in the intermediate BLRGs. If this is the case, the thin disk can emit a substantial BBB emission (see Gammie, Blandford, & Narayan 1999). However, since the number of the intermediate BLRGs whose NLR emission is investigated is too small, further observations are necessary for the discussion of this issue in detail.
Recently, it has been reported that some of LINERs also show the double-peaked Balmer lines (e.g., Storchi-Bergmann et al. 1993; Bower et al. 1996; Ho et al. 2000; Shields et al. 2001; see also Barth et al. 2001; Eracleous & Halpern 2001). Since some lines of evidence that the LINERs harbor an ADAF in their nucleus, the reason why the LINERs show lower ionization parameters than other AGNs such as Seyfert nuclei may be the harder SED of the ionizing continuum radiation which is caused by the ADAFs. To investigate this issue, detailed photoionization model calculations for the NLR emission of LINERs will be necessary. We will investigate this issue in a subsequent paper.
6. CONCLUSION
Based on the data compilation of narrow emission-line flux ratios from the literature, we find that the data of the double-peaked BLRGs and those of the single-peaked BLRGs are clearly separated on some diagnostic diagrams which consist of the narrow emission-line flux ratios of [O i]6300/[O iii]5007, [O ii]3727/[O iii]5007, [S i]6717,6731/[O iii]5007, and [Ne iii]3869/[O ii]3727. Our photoionization model calculations show that the data of the single-peaked BLRGs are well described by the models adopting the SED with BBB in the ranges of the parameters of and 104.0 cm-3 105.0 cm-3 while the data of the double-peaked BLRGs are consistent with the models adopting the SED without BBB. This is consistent with the illuminated-disk model that predicts the existence of an ADAF, which illuminates the outer thin disk and causes the double-peaked emission lines, in a nucleus of a BLRG with the double-peaked Balmer lines.
References
- (1)
- (2) Baldwin, J. A. 1975, ApJ, 201, 26
- (3) Baldwin, J. A., Carswell, R. F., Wampler, E. J., Smith, H. E., Burbidge, E. M., & Boksenberg, A. 1980, ApJ, 236, 388
- (4) Baldwin, J. A., Phillips, M. M., & Terlevich, R. 1981, PASP, 93, 5
- (5) Barth, A. J., Ho, L. C., Filippenko, A. V., Rix, H. -W., & Sargent, W. L. W. 2001, ApJ, 546, 205
- (6) Boisson, C., Durret, F., Bergeron, J., & Petitjean, P. 1994, A&A, 285, 377
- (7) Bonatto, C., Bica, E., & Alloin, D. 1989, A&A, 226, 23
- (8) Boroson, T. A., & Oke, J. B. 1984, ApJ, 281, 535
- (9) Bower, G. A., Wilson, A. S., Heckman, T. M., & Richstone, D. O. 1996, AJ, 111, 1901
- (10) Carswell, R. F., Baldwin, J. A., Atwood, B., & Phillips, M. M. 1984, ApJ, 284, 464
- (11) Chakrabarti, S. K., & Wiita, P. J. 1994, ApJ, 434, 518
- (12) Chen, K., & Halpern, J. P. 1989, ApJ, 344, 115 (CH89)
- (13) Chen, K., Halpern, J. P., & Filippenko, A. V. 1989, ApJ, 339, 742 (CHF89)
- (14) Chen, X., Abramowicz, M. A., & Lasota, J. P. 1997, ApJ, 476, 61
- (15) Chiang, J., & Murray, N. 1996, ApJ, 466, 704
- (16) Colina, L., Lípari, S., & Macchetto, F. 1991, ApJ, 382, L63
- (17) Collin-Soufrin, S. 1987, A&A, 179, 60
- (18) Corbin, M. R. 1997, ApJ, 485, 517
- (19) Dahari, O., & De Robertis, M. M. 1988, ApJ, 331, 727
- (20) De Zotti, G., & Gaskell, C. M. 1985, A&A, 147, 1
- (21) Díaz, A. I., Pagel, B. E. J., & Wilson, I. R. G. 1985, MNRAS, 212, 737
- (22) Díaz, A. I., Terlevich, E., & Pagel, B. E. J. 1985, MNRAS, 214, L41
- (23) Dopita, M. A. 1977, ApJS, 33, 437
- (24) Dopita, M. A., & Sutherland, R. S. 1995, ApJ, 455, 468
- (25) Dultzin-Hacyan, D. 1985, Rev. Mexicana Astron. Astrof., 11, 121
- (26) Durret, F., & Bergeron, J. 1988, A&AS, 75, 273
- (27) Edelson, R. A., & Malkan, M. A. 1986, ApJ, 308, 59
- (28) Eracleous, M., & Halpern, J. P. 1994, ApJS, 90, 1 (EH94)
- (29) Eracleous, M., & Halpern, J. P. 2001, ApJ, 554, 240
- (30) Eracleous, M., Livio, M., Halpern, J. P., & Storchi-Bergmann, T. 1995, ApJ, 438, 610
- (31) Ferland, G. J. 1997, Hazy: A Brief Introduction to 94.00 (Lexington: Univ. Kentucky Dept. Phys. Astron.)
- (32) Ferland, G. J. 2000, Revista Mexicana de Astronomia y Astrofisica, 9, 153
- (33) Ferland, G. J., & Netzer, H. 1983, ApJ, 264, 105
- (34) Filippenko, A. V. 1985, ApJ, 289, 475
- (35) Gammie, C. F., Narayan, R., & Blandford, R. 1999, ApJ, 516, 177
- (36) Grandi, S. A., & Osterbrock, D. E. 1978, ApJ, 220, 783
- (37) Grevesse, N., & Anders, E. 1989, in AIP Conf. Proc. 183, Cosmic Abundance of Matter, ed. C. J. Waddington (New York: AIP), 1
- (38) Grevesse, N., & Noels, A. 1993, in Origin and Evolution of the Elements, eds. N. Prantzos, E. Vangioni-Flam, & M. Casse (Cambridge Univ. Press), 15
- (39) Halpern, J. P. 1990, ApJ, 365, L51
- (40) Halpern, J. P. 1999, in Structure and Kinematics of of Quasar Broad Line Regions, eds. C. M. Gaskell, W. N. Brandt, M. Dietrich, D. Dultzin-Hacyan, & M. Eracleous (San Francisco: ASP), 163
- (41) Halpern, J. P., & Eracleous, M. 1994, ApJ, 433, L17
- (42) Halpern, J. P., & Eracleous, M., Filippenko, A. V., & Chen, K. 1996, ApJ, 464, 704
- (43) Halpern, J. P., & Filippenko, A. V. 1988, Nature, 331, 46
- (44) Heckman, T. M. 1980, A&A, 87, 152
- (45) Ho, L. C., Rudnick, G., Rix, H. -W., Shields, J. C., McIntosh, D. H., Filippenko, A. V., Sargent, W. L. W., & Eracleous, M. 2000, ApJ, 541, 120
- (46) Hunstead, R. W., Murdoch, H. S., & Shobbrook, R. R. 1978, MNRAS, 185, 149
- (47) Ichimaru, S. 1977, ApJ, 214, 840
- (48) Keel, W. C., & Miller, J. S. 1983, ApJ, 266, L89
- (49) Kino, M., Kaburaki, O., & Yamazaki, N. 2000, ApJ, 536, 788
- (50) Koski, A. T., & Osterbrock, D. E. 1976, ApJ, 203, L49
- (51) Kurpiewski, A., & Jaroszyński 1999, A&A, 346, 713
- (52) Lawrence, C. R., Zucker, J. R., Readhead, A. C. S., Unwin, S. C., Pearson, T. J., & Xu, W. 1996, ApJS, 107, 541
- (53) Manmoto, T. 2000, ApJ, 534, 734
- (54) Manmoto, T., Mineshige, S., & Kusunose, M. 1997, ApJ, 489, 791
- (55) Maza, J., & Ruiz, M. T. 1989, ApJS, 69, 353
- (56) Morganti, R., Tadhunter, C. N., Dickson, R., & Shaw, M. 1997, A&A, 326, 130
- (57) Kirhakos, S., & Phillips, M. M. 1989, PASP, 101, 949
- (58) Morris, S. L., & Ward, M. J. 1988, MNRAS, 230, 639
- (59) Mouri, H., Kawara, K., & Taniguchi, Y. 2000, ApJ, 528, 186
- (60) Murray, N., & Chiang, J. 1997, ApJ, 474, 91
- (61) Nagao, T., Murayama, T., & Taniguchi, Y. 2001a, ApJ, 546, 744
- (62) Nagao, T., Murayama, T., & Taniguchi, Y. 2001b, ApJ, 549, 155
- (63) Nagao, T., Murayama, T., & Taniguchi, Y. 2001c, PASJ, 53, 629
- (64) Narayan, R., Kato, S., & Honma, F. 1997, ApJ, 476, 49
- (65) Narayan, R., & Yi, I. 1995, ApJ, 444, 231
- (66) Osterbrock, D. E. 1989, Astrophysics of Gaseous Nebulae and Active Galactic Nuclei (Mill Valley; University Science Books)
- (67) Osterbrock, D. E., Koski, A. T., & Phillips, M. M. 1976, ApJ, 206, 898
- (68) Pérez, E., Penston, M. V., Tadhunter, C., Mediavilla, E., & Moles, M. 1988, MNRAS, 230, 353
- (69) Phillips, M. M. 1978, ApJS, 38, 187
- (70) Quataert, E., & Narayan, R. 1999, ApJ, 520, 298
- (71) Rees, M. J., Phinney, E. S., Begelman, M. C., & Blandford, R. D. 1982, Nature, 295, 17
- (72) Richstone, D. O. & Oke, J. B. 1977, ApJ, 213, 8
- (73) Robinson, A., Binette, L., Fosbury, R. A. E, & Tadhunter, C. N. 1987, MNRAS, 227, 97
- (74) Rodríguez-Ardila, A., Pastoriza, M. G., & Donzelli, C. J. 2000, ApJS, 126, 63
- (75) Rokaki, E., Boisson, C., & Collin-Souffrin, S. 1992, A&A, 253, 57
- (76) Rose, J. A., & Cecil, G. 1983, ApJ, 266, 531
- (77) Rose, J. A., & Tripicco, M. J. 1984, ApJ, 285, 55
- (78) Shields, J. C., Rix, H. -W., McIntoch, D. H., Ho, L. C., Rudnick, G., Filippenko, A. V., Sargent, W. L. W., Sarzi, M., & Eracleous, M. 2001, in Probing the Physics of Active Galactic Nuclei by Multiwavelength Monitoring, eds. B. M. Peterson, R. S. Polidon, & R. W. Pogge (San Francisco: ASP), in press
- (79) Simpson, C., Ward, M., Clements, D. L., & Rawlings, S. 1996, MNRAS, 281, 509
- (80) Stauffer, J., Schild, R., & Keel, W. 1983, ApJ, 270, 465
- (81) Stephens, S. A. 1989, AJ, 97, 10
- (82) Storchi-Bergmann, T., Baldwin, J. A., & Wilson, A. S. 1993, ApJ, 410, L11
- (83) Sulentic, J. W., Marziani, P., Zwitter, T., & Calvani, M. 1995, ApJ, 438, L1
- (84) Syer, D., & Clarke, C. J. 1992, MNRAS, 255, 92
- (85) Tadhunter, C. N., Morganti, R., di Sergo Alighieri, S., Fosbury, R. A. E., & Danziger, I. J. 1993, MNRAS, 263, 999
- (86) Veilleux, S., & Osterbrock, D. E. 1987, ApJS, 63, 295
- (87) Veilleux, S., & Zheng, W. 1991, ApJ, 377, 89
- (88) Wills, B. J., Netzer, H., Brotherton, M. S., Han, M., Wills, D., Baldwin, J. A., Ferland, G. J., & Browne, I. W. A. 1993, ApJ, 410, 534
- (89) Yee, H. K. C., & Oke, J. B. 1978, ApJ, 226, 753
- (90) Zheng, W., Binette, L., & Sulentic, J. W. 1990, ApJ, 365, 115
- (91) Zheng, W., Pérez, E., Grandi, S. A., & Penston, M. V. 1995, AJ, 109, 2355
- (92) Zheng, W., Veilleux, S., & Grandi, S. A. 1991, ApJ, 381, 418
- (93)
| Double-Peaked BLRG | Intermediate BLRG | Single-Peaked BLRGaaThe upper-limit data are not included. | ||||
|---|---|---|---|---|---|---|
| Mean | Median | Mean | Median | Mean | Median | |
| [O i]/[O iii] | 0.216 | 0.132 | 0.048 | 0.052 | 0.053 | 0.044 |
| [O ii]/[O iii] | 0.395 | 0.288 | 0.075 | 0.074 | 0.218 | 0.114 |
| [S ii]/[O iii] | 0.348 | 0.172 | 0.103 | 0.093 | 0.505 | 0.143 |
| [Ne iii]/[O ii] | 0.762 | 0.515 | 1.581 | 1.565 | 1.095 | 0.846 |
| Name | [O i]/[O iii] | [O ii]/[O iii] | [S ii]/[O iii] | [Ne iii]/[O ii] | ReferencesaaReferences. — (1) Tadhunter et al. 1993; (2) Yee & Oke 1978; (3) Grandi & Osterbrock 1978; (4) Eracleous & Halpern 1994; (5) Stephens 1989; (6) Carswell et al. 1984; (7) Filippenko 1985; (8) Robinson et al. 1987; (9) Morganti et al. 1997; (10) Osterbrock, Koski, & Phillips 1976; (11) Lawrence 2001 (private communication); (12) Zheng et al. 1995; (13) Stauffer, Schild, & Keel 1983; (14) Hunstead, Murdoch, & Shobbrook 1978; (15) Simpson et al. 1996; (16) Lawrence et al. 1996; (17) Morris & Ward 1988; (18) Boroson & Oke 1984; (19) Phillips 1978; (20) Baldwin 1975; (21) Baldwin et al. 1980; (22) Durret & Bergeron 1988; (23) Boisson et al. 1994; (24) Dultzin-Hacyan 1985; (25) Richstone & Oke 1977; (26) Maza & Ruiz 1989; (27) Wills et al. 1993 (28) Rodríguez-Ardila, Pastoriza, & Donzelli 2000. |
|---|---|---|---|---|---|
| Double-Peaked BLRG | |||||
| 3C 17 | 0.603 | 1, 2 | |||
| 3C 59 | 0.070 | 0.139 | 0.169 | 0.478 | 3 |
| IRAS 0236.6-3101 | 0.108 | 4 | |||
| PKS 0340-37 | 0.110 | 4 | |||
| 3C 93 | 0.077 | 4 | |||
| 1E 0450.3-1817 | 0.731 | 5 | |||
| Pictor A | 0.571 | 0.539 | 0.269 | 1, 6, 7, 8 | |
| B2 0742+31 | 0.030 | 4 | |||
| PKS 0857-19 | 0.186 | 4 | |||
| PKS 1151-34 | 0.140 | 0.235 | 1, 4, 9 | ||
| Mrk 668 | 0.037 | 4 | |||
| 3C 303 | 0.251 | 4 | |||
| 3C 332 | 0.144 | 0.156 | 0.172 | 0.372 | 3 |
| 3C 382 | 0.074 | 0.288 | 0.164 | 0.552 | 2, 10 |
| 3C 390.3 | 0.113 | 0.092 | 0.120 | 1.767 | 2, 10, 11, 12 |
| Arp 102B | 0.803 | 1.197 | 1.248 | 0.152 | 13 |
| PKS 1739+18 | 0.154 | 4 | |||
| PKS 1914-45 | 0.123 | 4 | |||
| PKS 2300-18 | 0.171 | 0.308 | 0.294 | 1.250 | 8, 14 |
| Intermediate BLRG | |||||
| PKS 0202-76 | 0.055 | 4 | |||
| 4C 5.38 | 0.049 | 4 | |||
| PKS 1232-24 | 0.017 | 4 | |||
| 3C 227 | 0.071 | 0.088 | 0.093 | 1.268 | 1, 10, 15 |
| 4C 73.18 | 0.055 | 0.064 | 0.142 | 1.911 | 16 |
| 3C 445 | 0.042 | 0.074 | 0.073 | 1.565 | 1, 8, 10, 17 |
| Single-Peaked BLRG | |||||
| B2 0110+29 | 0.019 | 4 | |||
| 3C 48 | 0.895 | 3.739 | 0.714 | 18, 19 | |
| PHL 1093 | 0.306 | 20 | |||
| 3C 61.1 | 0.047 | 0.174 | 0.209 | 0.457 | 16 |
| PKS 0214+10 | 0.042 | 4 | |||
| 3C 109 | 0.093 | 2 | |||
| 3C 120 | 0.035 | 0.097 | 0.060 | 2.376 | 1, 21, 22 |
| PKS 0736+01 | 0.080 | 1 | |||
| 3C 206 | 0.070 | 0.093 | 2.222 | 4, 20 | |
| 4C 9.35 | 0.036 | 4 | |||
| 3C 234 | 0.014 | 0.104 | 0.045 | 1.032 | 2. 3 |
| PKS 1011-282 | 0.093 | 23 | |||
| 3C 249.1 | 0.222 | 0.138 | 0.787 | 18, 24, 25 | |
| PKS 1101-32 | 0.046 | 0.058 | 1.578 | 4, 26 | |
| PKS 1217+02 | 0.119 | 0.093 | 1.915 | 20 | |
| B2 1223+25 | 0.012 | 0.117 | 1.539 | 4, 20, 23 | |
| 3C 273 | 0.161 | 0.148 | 1, 18 | ||
| 3C 277.1 | 0.040 | 0.324 | 0.396 | 4, 27 | |
| 3C 287.1 | 0.241 | 0.720 | 0.348 | 0.204 | 3 |
| PKS 1355-41 | 0.116 | 1 | |||
| PKS 1417-19 | 0.038 | 0.107 | 0.123 | 1.120 | 3, 14, 28 |
| PKS 1421-38 | 0.078 | 4 | |||
| 4C 37.43 | 0.029 | 0.218 | 0.073 | 0.406 | 4, 18 |
| 4C 35.37 | 0.356 | 3 | |||
| 3C 323.1 | 0.030 | 0.112 | 0.846 | 20, 27 | |
| B2 1719+35 | 0.060 | 4 | |||
| MC 1745+16 | 0.046 | 4 | |||
| PKS 2135-14 | 0.052 | 0.091 | 0.839 | 1, 20 | |
| PKS 2139-04 | 0.055 | 4 | |||
| PKS 2208-13 | 0.073 | 4 | |||
| PKS 2227-399 | 0.058 | 4 | |||
| PKS 2302-71 | 0.047 | 4 | |||
| PKS 2349-01 | 0.039 | 0.271 | 0.168 | 3 | |