SC 1327–312 & SC 1329–313 : two galaxy groups in-between a major merging event observed with Beppo–SAX
We present the results of two Beppo-SAX observations of the poor clusters
SC 1327–312 and SC 1329–313 : these objects are located in a huge structure, formed
by three ACO clusters, which is probably the remnant of one of the largest
and best studied major mergings known. Given the fact that these poor
clusters are in between two interacting ACO clusters, the aim of this work is
to study the physics of the intracluster medium and to look for the possible
presence of shocks.
We derived the gas distribution profiles, the global (i.e. within
h-1 Mpc ) temperatures and abundances and the temperature profiles and maps for
SC 1327–312 and SC 1329–313 . Also the presence of soft excess in LECS and
hard excess in PDS have been checked.
We do not find evidence of regions where the gas is shocked or significantly
heated. The image of SC 1327–312 seems rather symmetric, while the gas profile
of SC 1329–313 shows disturbed, “comet-like” shaped isophotes, with the tail
pointing toward A3562 and a compression toward SC 1327–312 .
The presence of multiphase gas in SC 1329–313 , as claimed by Hanami et al.
(hanami99 (1999)) on ASCA data, has been found only at the 2 confidence
level.
The lack of heating supports the hypothesis that the merging is at a
late stage, after the first core–core encounter, when the main shock front
had the time to travel to the external regions of the main clusters.
Key Words.:
X-rays: galaxies: clusters - galaxies: clusters: general - galaxies: clusters: individual: SC1327–312 - galaxies: clusters: individual: SC1329–313 -1 Introduction
Cluster mergings are among the most energetic phenomena in the Universe,
leading to a release of erg in a time scale of the order
of few Gyrs (Sarazin sarazin00 (2000)), but it is not yet clear in detail
in which way this kinetic energy is dissipated and which is its influence
on the galaxy population.
There are some observational features that have been associated with the
cluster merging phenomenon, like shocks in the hot gas, radio halos, relics
and wide angle tail radiosources, and the presence of starburst activity
in galaxies, although the precise theoretical description is not yet
completely assessed.
The main difficulty in understanding the merging phenomenon is that the
available data allow only studies focussed on single events, mainly in cases
where the intervening entity has a much smaller mass with respect to the
main cluster. Moreover, some authors limited the analysis to single
wavelengths (in particular X-ray band): however, although the X-ray band is
very powerful for these studies, a multiwavelength analysis would give a
more global view of the phenomenon.
Another important point is the key role played by the large–scale
environment. It has been recognized from cosmological simulations that
rich clusters are accreting groups and other clusters along filaments
(Colberg et al. colberg99 (1999)), which determine the relative velocity
and frequency of the impacts.
Rich superclusters are places where one can find the most spectacular cases
of such dynamical phenomena: the peculiar velocities due to the enhanced local
density favour cluster-cluster collisions, i.e. involving entities of
similar mass (hereafter “major mergings”).
The most remarkable examples of cluster mergings are found in the central
region of the Shapley Concentration, the richest supercluster of clusters
within 300 h-1 Mpc (Zucca et al. zucca93 (1993)).
At the center of the Shapley Concentration we individuated (Bardelli et al.
bardelli94 (1994)) two cluster structures (on scales of h-1 Mpc ) which
are cluster-cluster mergings at two different stages.
The most massive structure (dubbed A3558 complex, Bardelli et al.
bardelli94 (1994), 1998a ) is probably a merging
seen just after the first core-core encounter.
The other complex, dominated by A3528, is formed by two pairs of clusters
and is probably at the first stages of interaction (Bardelli et al.
bardelli01 (2001), Baldi et al. baldi01 (2001)).
In this paper we present the analysis of Beppo-SAX observations pointed on
the poor clusters SC 1327–312 and SC 1329–313 , placed in the A3558 complex at
the expected position of the shock front.
The plan of the paper is the following.
In Sect. 2 we describe the characteristics of the A3558 complex and in
Sect. 3 we give details about observations and data reduction.
In Sect. 4 and 5 we present the analysis of SC 1327–312 and SC 1329–313 , respectively;
in Sect. 6 we look for the possible existence of a soft excess in the
Beppo-SAX LECS data, while the analysis of Beppo-SAX PDS data is given
in Sect. 7. Finally, in Sect. 8 we discuss and summarize the results.


2 The A3558 cluster complex
The A3558 complex (Bardelli et al. bardelli94 (1994)) is a chain of clusters
almost perpendicular to the line of sight, spanning h-1 Mpc at a
redshift of , and is
formed by three ACO clusters (A3558, A3562 and A3556) and two poor groups
(dubbed SC 1327–312 and SC 1329–313 by Breen et al. breen94 (1994)).
This structure represents a density excess in number of galaxies of
, comprising a total mass in the range h-1 M⊙ (Bardelli et al. bardelli00 (2000)).
A simple dynamical model shows that, with these characteristics, the complex
is expected to be in the late stage of collapse.
From the two-dimensional distribution of optical galaxies (Figure 1)
and a redshift survey of galaxies, we found that the external
objects seem to form an envelope sourronding the cluster cores
(Bardelli et al. bardelli94 (1994), 1998a ).
Detailed substructure analysis (Bardelli et al. 1998b ) revealed
a large number of subclumps, suggesting that the complex is far from a relaxed
state.
Considering the X-ray band, Bardelli et al. (bardelli96 (1996)) and
Kull & Böhringer (kull99 (1999)) showed that the whole chain is embedded
in a hot gas filament.
The clusters of the chain have been extensively studied as single entities
(Bardelli et al. bardelli96 (1996), Ettori et al. ettori97 (1997),
Markevitch et al. markevitch98 (1998), Hanami et al. hanami99 (1999),
Ettori et al. ettori00 (2000)), finding evidences of disturbance.
Remarkable results are found also in the radio band (Venturi et al.
venturi00 (2000)):
comparing the bivariate radio-optical luminosity function of radiogalaxies
in this complex with that of radiogalaxies in a sample of “normal” clusters
(Ledlow & Owen ledlow96 (1996)), we found a significant lack of radiosources.
It seems that the cluster interaction “switched off” the central engines
of the AGNs. Moreover, a relic of radiogalaxy has been found at the edge of
a probably merging event between A3556 and a smaller group, projected along
the line of sight (Venturi et al. venturi98 (1998)).
In order to explain these facts, we adopted the working hypothesis that
the A3558 complex is the remanant of a cluster-cluster collision seen just
after the first core-core encounter
(Bardelli et al. 1998b ).
We speculated that a cluster
collided with A3558 and its remnants are visible as the overdensity regions of
SC 1327–312 , SC 1329–313 and A3562. In this framework, A3556 would be formed by the
members of the intervening cluster remained in the backside part of the
merging direction.
Therefore, all galaxies outside A3558 would belong to the destroyed cluster
and form the clumpiness expected from the simulations.
Hydrodynamical simulations have shown that mergers usually produce shocks in
the intracluster medium (see e.g. Sarazin sarazin00 (2000), Roettiger et al.
roettiger97 (1997), Takizawa & Mineshige takizawa98 (1998), Ricker & Sarazin
ricker01 (2001)): at early stages, the shocked region
is located between the nuclei of the impacting clusters, while at later
times the shocks sweep over the centers and reach the outer regions.
In order to completely understand which is the chain of events that
created the A3558 complex and in particular the time scale of the merging,
it is important to try to individuate the locus of the shock (if present).
The most natural place to be explored is the region between A3562 and A3558,
where the two poor clusters SC 1327–312 and SC 1329–313 are located.
3 Observations and data reduction
The clusters SC 1327–312 and SC 1329–313 were observed by the Beppo-SAX
satellite (Boella et al. 1997a ) in the periods 1999 December
28-30 and 2000 January 15-18, respectively.
We discuss here the data from two of the instruments onboard Beppo-SAX: the
Medium-Energy Concentrator Spectrometer (MECS) and the Low-Energy Concentrator
Spectrometer (LECS). The MECS (Boella et al. 1997b ) is presently
composed of two units, working in the [1–10] keV energy range. At
6 keV, the energy resolution is and the angular resolution
is (FWHM). The LECS (Parmar et al. parmar97 (1997)),
consists of an imaging X-ray detector, working in the [0.1–9] keV
energy range, with 20 spectral resolution and
(FWHM) angular resolution (both computed at 1 keV). Standard
reduction procedures and screening criteria have been adopted to
produce
linearized (i.e. corrected for intrinsic distorsion of the detector),
cleaned (filtered to remove non-scientific event and to correct gain variations)
and equalized (in order to report the two MECS at the same energy scale)
event files.
The MECS (LECS) data preparation and linearization was performed using the
Saxdas (Saxledas) package under Ftools environment.
We have taken into account the PSF-induced spectral distortions
(D’Acri et al. dacri98 (1998)) in the MECS analysis using effective area files
produced with the effarea program.
All MECS spectra have been background subtracted using spectra
extracted from blank sky event files in the same region of the
detector as the source (see Fiore et al. fiore99 (1999)).
A detailed explanation of the MECS analysis is given in De Grandi & Molendi
(degrandi01 (2001)): in the following we’ll concentrate on the most important
steps.
As done in Ettori et al. (ettori00 (2000)), for the LECS we have used two
redistribution matrices and ancillary response files, the first computed
for an on-axis pointlike source and the second for a source with a
flat brightness profile. The temperatures and abundances we derive in
the two cases do not differ significantly, as the telescope vignetting
in the [0.1–4.0] keV energy range is not strongly dependent upon energy.
All spectral fits have been performed using XSPEC Ver. 10.00.
The observation log is reported in Table 1 and the field position
is shown in the lower panel of Figure 1.
The observed count–rates for SC 1327–312 and for SC 1329–313 for the 2 MECS units
and within the central 8 arcmin (corresponding to 0.33 h-1 Mpc )
are 0.122 cts s-1 and 0.060 cts s-1, respectively.
For the LECS data, the count–rates in the same region are 0.087 and 0.045,
respectively.
| Target | (2000) | (2000) | date | exp.time | count–rate |
|---|---|---|---|---|---|
| h m s | o ′ ′′ | ksec | cts/s | ||
| SC 1327–312 | 13 29 47 | -31 36 29 | 1999 Dec 28-30 | 85.1 | 0.122 |
| SC 1329–313 | 13 31 36 | -31 48 46 | 2000 Jan 15-18 | 130.2 | 0.060 |
4 SC 1327–312
The cluster SC 1327–312 (, , from Bardelli et al. bardelli96 (1996)) is located
23.6 arcmin ( h-1 Mpc ) from the center of the dominant cluster A3558.
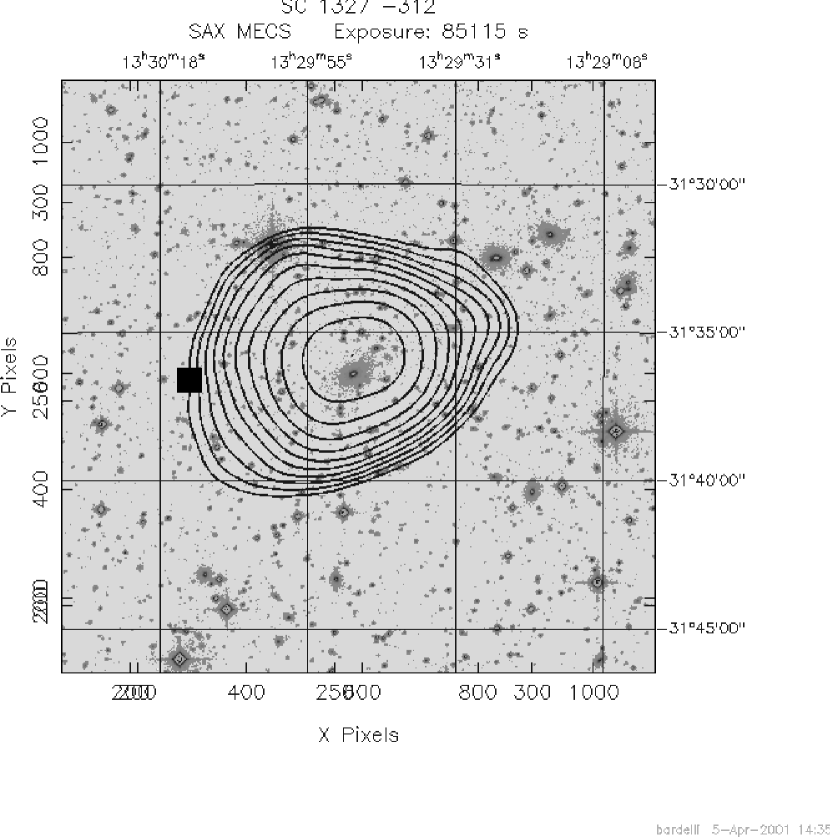
In Figure 2
the isodensity contours of the MECS image (in the energy range [2–10] keV)
are reported, after having applied a smoothing of 6 pixels, corresponding
to 0.8 arcmin.
The X-ray emission from the central 8 arcmin is overplotted
on the optical data taken from the Digital Sky Survey:
the emission seems to be symmetric and centered
on the brightest galaxy, which has and km s-1.
The distribution of optical galaxies does not show a clear overdensity at the
position of this group: the nearest group found by the three-dimensional
substructure analysis of Bardelli et al. (1998b ), dubbed T478,
is arcmin away from the X-ray position, in the East direction
(see lower panel of Figure 1 and Figure 2).
This offset could be due to the contamination of galaxies from the nearby
cluster A3558, which decreases the significance of the optical overdensity.
Moreover the optical isodensity distribution in this region shows a dependence
on the magnitude range (see figure 14 of Bardelli et al. bardelli94 (1994)),
another indication of possible contamination from nearby structures.
This group appears in a ROSAT-PSPC observation pointed on A3558:
unfortunately, is has been observed off-axis, where the spatial resolution
is strongly degraded; moreover its emission is disturbed by the
presence of a supporting rib of the detector (see Bardelli et al.
bardelli96 (1996)).
For this reason, we fitted an elliptical King model (i.e. with two core radii,
see Bardelli et al. bardelli96 (1996)) directly to
the Beppo-SAX MECS image.
We found that the best fit within a region of 8 arcmin radius is
h-1 Mpc , h-1 Mpc and .
Note that the core radius values correspond to times the
resolution and could be considered an unbiassed measure.
In order to explore the dependence of the results on the PSF,
we deconvolved the image with a Clark Clean Method, finding that
the parameters vary by a 5, in the sense of reducing the core radii.
The only value present in the literature is h-1 Mpc obtained by Breen et al. (breen94 (1994)) on Einstein-IPC data, fixing the
slope to .
With our parameters
and using the estimated global temperature of the
hot gas (see below),
the total mass is
h-1 Mpc h-1 M⊙, with a baryonic
fraction of h-1.5.
The luminosity
resulted to be h-2 erg s-1 in the [2–10] keV
band and h-2 erg s-1 in the [0.6–3] keV
band. These values have been estimated within a distance of h-1 Mpc from the
cluster center.


4.1 Global temperature and abundance
In order to find the global temperature, we extracted a circular region
of 8 arcmin from the center of the MECS data in the range [2–10] keV.
We fitted the spectrum with a mekal (Mewe et al. mewe95 (1995),
Kaastra kaastra92 (1992)) model with an absorbing Galactic hydrogen column
(wabs model), as implemented in the XSPEC package.
After having checked that the fitted Galactic absorption is consistent
with the literature measurement of cm-2
(Dickey & Lockman dickey90 (1990)), we fixed it to this latter value.
The results are reported in Table 2.
In order to use all the information present in the Beppo-SAX observation,
we added the data of the LECS instrument in the [0.6–3] keV band.
From a ROSAT-PSPC image, Bardelli et al. (bardelli96 (1996)) found that
superimposed to the cluster image (at arcmin from the cluster
center) there is a K1 III star (SAO 204527 or HD 117310), whose
X-ray emission is well fitted by a Raymond-Smith model with keV.
This emission is likely affecting only the LECS energy range: for this reason
we fitted the mekal model adding a Raymond-Smith model with
keV and abundance of . The resulting temperature is
keV and the abundance is ,
with a reduced of 1.03 with 189 degrees of freedom.
However, neglecting the star contribution, the results are very similar,
with a reduced of 1.05 with 192 degrees of freedom.
Also these results are reported in Table 2.
In Figure 3 we show the combined LECSMECS spectrum of
SC 1327–312 , overplotted to the fit, and the corresponding confidence ellipse
of the temperature and abundance parameters.
The value of the temperature is in agreement with the determination of
keV from ROSAT-PSPC (Bardelli et al. bardelli96 (1996)) and
is consistent at 1.5 sigma with the ASCA determinations of
keV (Hanami et al. hanami99 (1999)).
Following the relation of Lubin & Bahcall (lubin93 (1993))
[ km s-1], the determined temperature
implies a velocity dispersion of km s-1,
consistent with the value of Bardelli et al. (1998a )
of km s-1.
| Object | (keV) | Abundance | Reduced (d.o.f) |
|---|---|---|---|
| SC 1327–312 MECS | 1.05 (133) | ||
| SC 1327–312 LECS+MECS | 1.03 (189) | ||
| SC 1329–313 MECS | 1.02 (125) | ||
| SC 1329–313 LECS+MECS | 0.92 (181) |
4.2 MECS spatially resolved spectroscopy
The cluster emission in the central 8 arcmin circle has been divided into
wide concentric annuli, centered on the X-ray emission peak.
To all spectra accumulated from these annular regions, we have applied
a single temperature model (i.e. mekal model) absorbed for the
nominal Galactic hydrogen column density (wabs model) to derive
temperature and metal abundances. The adopted column density for
SC 1327–312 is cm-2 (see Sect. 4.1), and the
energy range considered for the spectral fitting procedure is [2–10] keV.
In Figure 4 we report the temperature and abundance
profiles of SC 1327–312 in annuli around the cluster center. The vertical
bars correspond to the errors and the horizontal bars represent the
bins used to extract the counts. For the
last point, for which the abundance is not constrainted, we fixed it at the
value of the global fit, i.e. 0.17. For this reason this last abundance point
is plotted without error bars.
If we extrapolate the abundance profile with a linear fit (see below), we
obtain the value indicated with the square: in the temperature plot, the
square indicates the derived using this abundance value.
These points were plotted in order to give a feeling of the dependence
of the fitted temperature on the abundance determination.
Finally, dotted lines correspond to the values obtained from the global fit.
The temperature profile appears to be constant, a part a weak indication
of a decrease in the most central bin: averaging the values of all bins
we find keV, well in agreement with the global
fitted temperature.
On the contrary, the abundance seems to present a decreasing trend. In order
to extrapolate the trend to the arcmin bin, we fitted the linear
relation .
We have performed two-dimensional spectral analysis of SC 1327–312 by
extracting spectra from sectors of annuli as shown in
Figure 5: out to 4 arcmin each annulus is wide,
beyond this radius the annuli are wide.
This figure shows the MECS image of the cluster with the four sectors
overlaid:
note that the contours shown in Figure 2
correspond only to the inner part of this plot.
We have tilted the sectors with a position angle (measured
from North to East) of 60 degrees in order to have the North-West
sector pointing toward A3558 and the South-East one toward SC 1329–313 .
The considered energy band is again [2–10] keV, except for
the annulus. In this annulus we have applied a
correction for the absorption caused by the strongback supporting of the
detector window and in this case the energy range is [3.5–10] keV to avoid
the low energy part of the spectrum, where the correction for the
strongback is less reliable.


In Figure 6 we show the temperature profiles derived
for SC 1327–312 from the spectral fits for each of the 4 sectors. In all profiles
we have included the temperature obtained for the central circular
region with radius .
The radial temperature profile for each sector stops at the last
annulus where the source counts are more than of the total
(i.e. source plus background) counts.
This is the reason why there are different radial extensions for the
profiles in the four quadrants: in the outermost bins in the North-West
and South-East sectors there is a contribution from the emission of the
adjacent clusters.
More specifically, sector North-West points toward A3558, a cluster at
a global temperature of 5.5 keV (Markevitch & Vikhlinin markevitch97 (1997)),
which is about 24 arcmin away from SC 1327–312 (note that our measurements
extend up to 20 arcmin from the cluster center only). Markevitch &
Vikhlinin (markevitch97 (1997)) measured the temperature map for A3558
using ASCA data: they find a temperature of about keV (
c.l. errors) in their sector of annulus pointing towards SC 1327–312 (i.e. region 9 in figure 2 of Markevitch & Vikhlinin markevitch97 (1997)),
in agreement with the mean temperature we find for the three outermost
bins of sector North-West, i.e. keV ( c.l.).
We have fitted the temperature in sector North-West with a constant model,
finding a mean temperature of with a reduced ;
we find a marginal (at c.l. using the F-test) evidence of
temperature increase from 0 to 20 arcmin by fitting the data with a
linear model. At the scales considered here we can exclude strong
temperature enhancements along this direction.
5 SC 1329–313
The cluster SC 1329–313 (, , from Breen et al. breen94 (1994)) is located 27.1 arcmin
( h-1 Mpc ) from the center of the cluster A3562 and 26.3 arcmin
from SC 1327–312 .
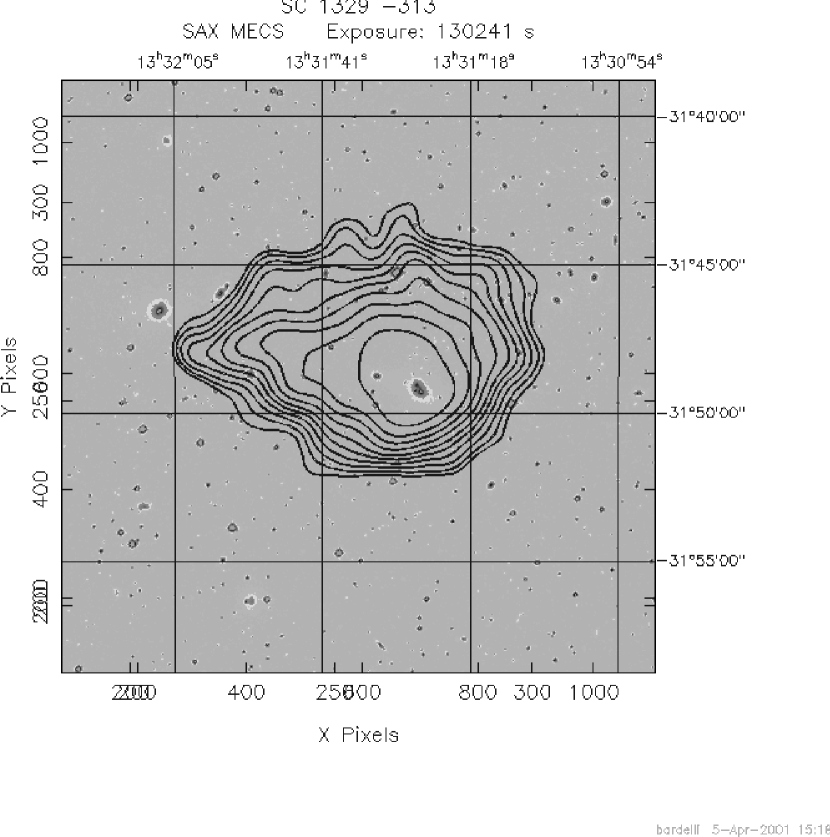
In Figure 7
the isodensity contours of the MECS image (in the energy range [2–10] keV)
are reported, after having applied a smoothing of 6 pixels, corresponding
to 0.8 arcmin.
The emission from the central 8 arcmin is overplotted
to the Digital Sky Survey optical image.
The isodensity contours of SC 1329–313 appear elongated with a tail pointing toward
A3562. The brightest galaxy ( and km s-1) appears
hosting a double nucleus.
Fitting an elliptical King model, we find h-1 Mpc ,
h-1 Mpc and .
We find also an excess of emission at arcmin from the
fitted center, roughly in correspondence of the brightest galaxy.
Also in this case, the Clark Clean Method deconvolution of the image leads to
neglegible variations of fitted parameters.
Using these values and the global temperature (see below), we estimate
a mass of
h-1 Mpc h-1 M⊙,
with a gas mass fraction of h-1.5.
The [2–10] keV luminosity is h-2 erg s-1
and the emission in the [0.6-3] keV band is h-2
erg s-1 within h-1 Mpc from the center.


5.1 Global temperature and abundance
The global results from the region of 8 arcmin radius are
keV and an abundance of ,
with a reduced of 0.92 with 181 degrees of freedom.
We fixed the hydrogen column to cm-2 (Dickey &
Lockman dickey90 (1990)), after having checked that it is consistent with
the fitted value.
Note that the addition of the LECS dataset does not significantly modify the
temperature determination.
The results are reported in Table 2.
The derived temperature is significantly lower (at 3.3 sigma) than the ASCA
determination of keV (Hanami et al.
hanami99 (1999)): it is unclear which can be the origin of this discrepancy,
given the fact that generally Beppo-SAX and ASCA results for global
temperatures of clusters are in agreement (De Grandi & Molendi
degrandi02 (2002)).
In Figure 8 we show the LECS+MECS spectrum of SC 1329–313 , with
overplotted the best fit, and the corresponding confidence ellipse
for the temperature and abundance parameters.
The implied velocity dispersion is km s-1.
From the substructure analysis of Bardelli et al. (1998b )
it appeared
that this cluster has a bimodal velocity distribution, with the two peaks
separated by km s-1 ( and
km s-1) and superimposed along the line of sight.
It is difficult to determine which subclump is associated with this diffuse
emission. The optical substructures have centers offset by arcmin
(the farthest, T496) and arcmin (the nearest, T520) westward.
The velocity dispersions
are km s-1 and km s-1,
respectively, lower than the predicted one of 2.2 and 1.6 .
However, considering that the brightest galaxies nearby the X-ray
emission are at km s-1, the group responsible for the
emission is presumably T520; its position is shown in the lower panel
of Figure 1.
5.2 MECS spatially resolved spectroscopy
For this cluster we have used the same spatial binning for the concentric
annuli and the same energy bands as for SC 1327–312 (see Sect. 4.2).
Given the low statistics of counts, the abundance is not constrained:
for this reason we choose to fix it to the global value (i.e. 0.22) for all
bins.
In Figure 9, the radial temperature profile of SC 1329–313 is shown. A very marginal indication of temperature increase seems to be
present.
In Figure 10 we plot the MECS image of SC 1329–313 with
overlaid thefour sectors used for the two-dimensional spectral analysis:
again the contours shown in Figure 7
correspond only to the inner part of this plot.
The position angle in this case is 0 degrees, with the North-West sector
pointing towards SC 1327–312 and the North-East one towards A3562.
Again, in the sectors where there is a contribution from the emission of
nearby objects, it is possible to extend the analysis up to 20 arcmin.
In Figure 11 we show the temperature profiles derived
for SC 1329–313 from the spectral fits for each of the 4 sectors. In all profiles
we have included the temperature obtained for the central circular
region with radius .
We have fitted the temperature profile of sector North-West with a
constant model, finding a mean temperature of keV; the
temperature enhancements in the second (2-4 arcmin) e third (4-8
arcmin) bins are statistically significant at less than .
In sector North-East we find X-ray emission from the cluster A3562 which
is located at about 27 arcmin from the center of SC 1327–312 . Ettori
et al. (ettori00 (2000)) studied the temperature map of A3562, finding a
temperature of keV in the annulus 8-16 arcmin in the
sector toward SC 1327–312 (sector West in figure 9 of Ettori et al.).
This temperature is in agreement with our result in annulus 12-20 arcmin
(i.e. keV), which is the region where the two cluster emissions
are overlapping each others.
It appears that the increase of temperature is mainly due to the
second and third bin of the NW sector (with temperatures of keV).
This could be an indication of the presence of heating of gas, which
added to the elongation of the isophotes to the other side of SC 1329–313 ,
are signs of interaction between this group and SC 1327–312 .
Finally, given the proximity of the Beppo-SAX observations of the two poor
clusters, the last three bins of the SE sector of SC 1327–312 correspond with
great overlap to the last three bins of the NW sector of SC 1329–313 (see lower panel of Figure 1).
Given the fact that the two observations are statistically independent,
this is an opportunity to test how robust are the temperature determinations
at large radii. In Figure 11, we plotted as
squares the temperature determinations of SC 1327–312 in the corresponding bins,
with a small offset on the X axis for clarity.
In all bins, the two temperature estimates are very well consistent with
each other.


5.3 The problem of the discrepant redshift
Hanami et al. (hanami99 (1999)), fitting the redshift from the ASCA GIS and SIS
spectrum of SC 1329–313 , reported that the resulting value in not consistent with
the optical value, being . They found that this discrepancy is
essentially due to the fact that the centroid of the iron K line
is more consistent with H-like rather than He-like ionization.
This result permitted the authors to
suppose the presence also of gas at significantly higher temperature
( keV).
We fitted the 8 arcmin region by fixing all the parameters but the temperature,
the redshift and the normalization, finding with a
interval covering the range [0.019-0.049]. The result does not
change by fixing the temperature.
However, we have to take into account a systematic shift of eV in the
channel-to-energy conversion (Fiore, private communication), resulting
in a redshift shift of .
Note that, within the uncertaintes and this systematic shift, the
value is consistent with the mean redshift of both optical
substructures (i.e. and ).
The result does not change by using data in a smaller region of arcmin
radius.
As a further test, we fitted the spectrum with a bremsstrahlungGaussian
model, in order to determine the centroid of the line, finding
keV with a range of [6.38–6.63] keV: this result is at
the border of consistency with the expected value of keV. Considering
the correction of the eV on the channel-to-energy systematic offset,
we found that the discrepancy is no more than of significance.
As a check, we repeated this analysis also for SC 1327–312 : the resulting
centroid is keV with a range of [6.26–6.49] keV.
In conclusion, the evidence of presence of hotter gas in our data is weak,
even if in the same direction of that found by Hanami et al. (hanami99 (1999)),
and a conclusive analysis will be possible only with the spectral capability
of XMM-Newton.
6 LECS data
Recently. Bonamente et al. (bonamente01 (2001)) claimed the detection in
Beppo-SAX and ROSAT-PSPC data of a soft (at keV) excess
in the clusters A3562, A3558, A3560 and A3571. The first two
clusters are part of the A3558 complex, while A3560 is h-1 Mpc away from SC 1329–313 and h-1 Mpc from SC 1327–312 and therefore could be
interacting with the structure. Moreover A3571 is part of another
cluster complex of the Shapley Concentration.
In principle there are no indications that this soft excess is confined
in the single clusters: in fact it could be due to a diffuse, cold
component (a filament) that we know to exist between A3558 and A3562
(Bardelli et al. bardelli96 (1996), Kull & Böhringer kull99 (1999)).
In order to check the possible existence of a soft excess in our
LECS data, we restricted the analysis in the keV band, considering
the central region of 8 arcmin radius.
We find that the excesses in this band, with respect to the counts expected
from the best fit spectrum, are and for
SC 1327–312 and SC 1329–313 , respectively. Considering that the values of
are determined only by the counts statistics and not by the uncertaintes
on the fit and on the calibration, we conclude that no significant excess is
present in our data.
Moreover, note that in Ettori et al. (ettori00 (2000)), where a Beppo-SAX
observation of A3562 was analyzed, we have not found the excess reported by
Bonamente et al. (bonamente01 (2001)).
7 PDS data
There are evidences of the presence of hard X-ray excesses over a simple
bremsstrahlung model in some galaxy clusters which
present some degree of merging (see Fusco-Femiano fusco00 (2000)). This hard
energy tails have been detected for the first time by the PDS instrument
on board of Beppo-SAX satellite.
It is not clear which is the exact mechanism which accelerates the electrons
and whether it is related with merging alone or if it requires some additional
parameters (as, for instance, a preexisting radiosource or a gas temperature
hotter that 6-7 keV).
For this reason it is worthwhile to look if an hard tail is present in
our data.
Following the data reduction cookbook, the main problems come from the
variable background of energetic particles, which has to be subtracted.
There are basically two methods to do this rejection, i.e. the Fixed
Rise Time threshold and the Variable Rise Time threshold. We checked
that the counts resulting after the application of the two methods are
consistent each other and give the same results.
By imposing to the PDS data a mekal model with the same parameters fitted
in the MECS alone, we find a significant excess in both SC 1327–312 and SC 1329–313 observations, in particular between 15 and 30
keV. We found cts s-1 against the
cts s-1 predicted by the mekal model for
SC 1327–312 and cts s-1
(against cts s-1) for SC 1329–313 .
The excess flux in the two observations is consistent within the errors
to be the same in the two exposures.
The fit does not improve by adding a power law, which gives a formal slope
.


The spectral shape of this excess
is inconsistent with the hypothesis of a cluster hard tail and indicates
the presence of a contamination source.
The problem in identifying the origin of this bump arises from the huge
field of view of the PDS, i.e. ; our two exposures cover large
part of the A3558 complex. For this reason, added to the fact that
this region of the sky is poorly sampled by large X-ray surveys,
it is difficult to find the possible responsible for this excess.
After having checked in the literature, we found
as a tentative candidate a QSO at (Drinkwater et al.
drinkwater97 (1997), Venturi et al. venturi00 (2000)), located
at
and , i.e. North-East with respect to the
position of SC 1327–312 . This source was previously known as
and presents a radio spectrum of steepness
(with total flux of mJy, Venturi et al. venturi00 (2000)).
This source is in the field of view of the ROSAT-PSPC observation
of A3558 of Bardelli et al. bardelli96 (1996) with a flux of
erg cm-2 s-1.
Finally,
considering the response function of the PDS instrument, the count–rate
ratio between the SC 1327–312 and the SC 1329–313 observations is consistent
with having been originated by this source.
In fact, the observed ratio is , to be compared with
the expected value of 1.32.
8 Discussion and conclusions
The aim of this work has been the study of two blobs of hot gas (SC 1327–312 and
SC 1329–313 ) positioned between A3558 and A3562, two ACO clusters in an oustanding
phase of major merging.
These clusters (together with A3556) form the A3558 complex, a structure
with a linear dimension of h-1 Mpc at a redshift of .
The relative center-to-center distance between A3562 and A3558 is
h-1 Mpc .
The indication of ongoing merging comes both from the optical and from
the X-ray band.
From the optical band, the envelope of galaxies sorrounding the clusters cores
(visible in Figure 1; see also figure 2 of Bardelli et al.
1998a for the wedge diagram of the redshift sample)
suggests that the galaxies from outer
parts of A3562 and A3558 have been shared by the dynamical interaction.
Also by studying the dynamics of the structure using redshift survey,
Bardelli et al. (bardelli00 (2000)) and Reisenegger et al.
(reisenegger00 (2000)) concluded that
the A3558 complex is at the late collapse phase. Moreover, the presence of
a large number of subcondensations (Bardelli et al. 1998b )
reveals that the complex is far from the relaxation.
From the X-ray, both Bardelli et al. (bardelli96 (1996)) and Kull &
Böhringer (kull99 (1999)) detected diffuse emission extending along
the whole A3558 complex, in the same way of the optical galaxies.
Moreover, Markevitch & Vikhlinin (markevitch97 (1997)) found regions of
hotter gas with respect to the A3558 average temperature in the direction of
SC 1327–312 , while Ettori et al. (ettori00 (2000)) detected
diffuse gas outside A3562, on the opposite side with respect to the
A3558 direction.
This picture is consistent with the results of numerical simulations
of merging clusters.
In order to study the role of SC 1327–312 and SC 1329–313 in this merging picture,
we analyzed two Beppo-SAX observations pointed on the centers of these two
poor clusters.
The MECS image of SC 1327–312 seems rather symmetric and centered on the
dominant galaxy. On the contrary, the emission of SC 1329–313 has a “comet-like”
shape: we detected a significant excess of X-ray emission corresponding to
the position of the brightest galaxy (which appears to be double) and a tail
pointing eastward.
In both poor clusters, it is visible the presence of diffuse emission
(see Figures 5 and 10)
arising from the filament connecting the clusters of the A3558 complex.
Moreover, in SC 1327–312 and SC 1329–313 images a contribution from the X-ray
emission of A3558 and A3562, respectively, can be detected.
These components are bright enough to allow a temperature estimate up to
a distance of 20 arcmin from the frame center.
Finally, possible indications of disturbance come from the displacement
between the positions of the X-ray peaks and the optical substructure
centroids in both objects.
We estimated the “global” (i.e. within 8 arcmin, corresponding to
h-1 Mpc ) temperatures and abundances for the two clusters
using both MECS and LECS instruments. We find keV and
for SC 1327–312 and keV and for SC 1329–313 .
These values are consistent with those expected from the velocity dispersions
of the corresponding optical substructures found in Bardelli et al.
(1998b ).
As a further step, we performed a spatially resolved spectroscopy with the
use of the MECS instrument. The temperature profiles are not very different
from an isothermal distribution of the hot gas, a part from the fact that the
most internal bins in the two clusters are always colder than the others.
Then, we estimated the temperatures as a function of the distance from the
center dividing the images in four sectors of 90o. We rotated the grids
in order to have a sector of SC 1327–312 pointing toward A3558 and
another toward SC 1329–313 and a sector of SC 1329–313 pointing toward A3562 and
another toward SC 1327–312 .
We found a good agreement between the temperatures derived in the overlapping
regions of the two pointings and in the regions at the edge with A3558 and
A3562, where literature estimates are available. This confirms the
goodness and reproducibility of the analysis of MECS images in the most
external regions, i.e. up to 20 arcmin.
We did not find evidence of the existence of a shock front
inside the poor clusters,
a part from a weak
indication that in SC 1329–313 the temperatures in the bins between 2 and 8 arcmin
in the NW sector seem to be higher than the corresponding ones in the other
sectors.
There appears to be a temperature increase also in most external part of
SC 1327–312 in the sector pointing toward A3558: however, this increase is
consistent with the hot region in A3558 found by Markevitch & Vikhlinin
(markevitch97 (1997)).
An excess in the PDS energy range has been detected, but it resulted to be
unrelated with the cluster emission and due to a contaminating source.
Moreover, analysing the LECS data, we did not find a significant soft excess
with respect to a single thermal bremsstrahalung.
Finally, the presence of multiphase gas in SC 1329–313 , as claimed by Hanami et al.
(hanami99 (1999)) on ASCA data, has been found only at the 2 confidence
level.
In conclusion, we did not find evidence of the presence of shock-heated
gas in these two poor clusters.
Only SC 1329–313 presents in its distorted isophotes sign of disturbance of the
hot gas: the gas profile of SC 1329–313 shows “comet-like” shaped
isophotes, with the tail pointing toward A3562 and a compression
toward SC 1327–312 .
This is an indication that reinforces our work hypothesis: the A3558
complex is a remnant of a major merging seen after the first core-core
encounter. In the numerical simulations of mergers (see for example
Sarazin sarazin00 (2000)), the shock is created between two clusters before
the first collision. After the core-core encounter, the shock travels
toward the external regions of the clusters, where it will be dissipated.
The A3558 complex is therefore an important opportunity for studying evolved
mergings and the new generation X-ray instruments (XMM-Newton and Chandra)
will be helpful in order to give a complete picture of this phenomenon.
Acknowledgements.
SB warmly thanks D.Dallacasa for his help with the deconvolution programs and C.Vignali and S.Pellegrini for useful discussions. We thank the referee for usefull comments. This research has made use of linearized event files produced at the Beppo-SAX Science Data center. This work has been partially supported by the Italian Space Agency grants ASI-I-R-105-00 and ASI-I-R-037-01.References
- (1) Baldi A., Bardelli S., Zucca E., 2001, MNRAS 324, 509
- (2) Bardelli S., Zucca E., Vettolani G., et al., 1994, MNRAS 267, 665
- (3) Bardelli S., Zucca E., Malizia A., et al., 1996, A&A 305, 435
- (4) Bardelli S., Zucca E., Zamorani G., Vettolani G., Scaramella R., 1998a, MNRAS 296, 599
- (5) Bardelli S., Pisani A., Ramella M., Zucca E., Zamorani G., 1998b, MNRAS 300, 589
- (6) Bardelli S., Zucca E., Zamorani G., Moscardini L., Scaramella R., 2000, MNRAS 312, 540
- (7) Bardelli S., Zucca E., Baldi A., 2001, MNRAS 320, 387
- (8) Boella G., Butler R.C., Perola G.C., et al., 1997a, A&AS 122, 299
- (9) Boella G., Chiappetti L., Conti G., et al., 1997b, A&AS 122, 327
- (10) Bonamente M., Lieu R., Nevalainen J., Kaastra J.S., 2001 ApJL 547, L7
- (11) Breen J., Raychaudhury S., Forman W., Jones C., 1994, ApJ 424, 59
- (12) Colberg J.M., White S.D.M., Jenkins A., Pearce F.R., 1999, MNRAS 308, 593
- (13) D’Acri F., De Grandi S., Molendi S., 1998, Nuclear Physics 69/1-3, 581
- (14) De Grandi S. & Molendi S., 2001, ApJ 551, 153
- (15) De Grandi S. & Molendi S., 2002, ApJ submitted
- (16) Dickey J.M. & Lockman, F.J., 1990, ARA&A 28, 215
- (17) Drinkwater M.J., Webster R.L., Francis P.J., et al., 1997, MNRAS 284, 85
- (18) Ettori S., Fabian A.C., White D.A., 1997, MNRAS 289, 787
- (19) Ettori S., Bardelli S., De Grandi S., et al., 2000, MNRAS 318, 239
- (20) Fiore F., Guainazzi M., Grandi P., 1999, Cookbook for Beppo-SAX NFI Spectral Analysis
- (21) Fusco-Femiano R., 2000, in Constructing the Universe with Clusters of Galaxies, Durret F. & Gerbal D. eds., electronic proceedings http://www.iap.fr/Conferences/Colloque/coll2000/contributions
- (22) Kaastra J.S., 1992, An X-Ray Spectral Code for Optically Thin Plasma, Internal SRON-Leiden report, updated version 2.0
- (23) Kull A. & Böhringer H., 1999, A&A 341, 23
- (24) Hanami H., Takeshi T., Shimasaku K., et al., 1999, ApJ 521, 98
- (25) Ledlow M.J. & Owen F.N., 1996, AJ 112, 9
- (26) Lubin L.M. & Bahcall N.A., 1993, ApJL 415, L17
- (27) Markevitch M. & Vikhlinin A., 1997, ApJ 474, 84
- (28) Markevitch M., Forman W., Sarazin C.L.,Vikhlinin A., 1998, ApJ 503, 77
- (29) Mewe R., Kaastra J., Liedhal K., 1995, Legacy 6, 16
- (30) Parmar A.N., Martin D.D.E., Bavdaz M., et al., 1997, A&AS 122, 309
- (31) Reisenegger A., Quintana H., Carrasco E.R., Maze J., 2000, ApJ 120, 523
- (32) Ricker P.M. & Sarazin C.L., 2001, ApJ in press (astro-ph/0107210)
- (33) Roettiger K., Loken C., Burns J.O., 1997, ApJS 109, 307
- (34) Takizawa M. & Mineshige S., 1998, ApJ 499, 82
- (35) Sarazin C.L., 2000, in Constructing the Universe with Clusters of Galaxies, Durret F. & Gerbal D. eds., electronic proceedings http://www.iap.fr/Conferences/Colloque/coll2000/contributions
- (36) Venturi T., Bardelli S., Morganti R., Hunstead R.W., 1998, MNRAS 298, 1113
- (37) Venturi T., Bardelli S., Morganti R., Hunstead R.W., 2000, MNRAS 314, 594
- (38) Zucca E., Zamorani G., Scaramella R., Vettolani G., 1993, ApJ 407, 470