A catalogue of galaxies behind the southern Milky Way.††thanks: The two optical catalogues and their respective listings of IRAS cross-identifications are available in electronic format at the CDS via anonymous ftp to cdsarc.u-strasbg.fr (130.79.128.5) or via http://cdsweb.u-strasbg.fr/Abstract.html
In this second paper of the catalogue series of galaxies behind the southern Milky Way, we report on the deep optical galaxy search in the Crux region ( and ) and the Great Attractor region ( and ). The galaxy catalogues are presented, a brief description of the galaxy search given, as well as a discussion on the distribution and characteristics of the uncovered galaxies. A total of 8182 galaxies with major diameters were identified in this 850 square degree area: 3759 galaxies in the Crux region and 4423 galaxies in the Great Attractor region. Of the 8182 galaxies, 229 (2.8%) were catalogued before in the optical (3 in radio) and 251 galaxies have a reliable (159), or likely (92) cross-identification in the IRAS Point Source Catalogue (3.1%). A number of prominent overdensities and filaments of galaxies are identified. They are not correlated with the Galactic foreground extinction and hence indicative of extragalactic large-scale structures. Redshifts obtained at the South African Astronomical Observatory (SAAO) for 518 of the newly catalogued galaxies in the Crux and Great Attractor regions (Fairall et al. 1998; Woudt et al. 1999) confirm distinct voids and clusters in the area here surveyed. With this optical galaxy search, we have reduced the width of the optical ‘Zone of Avoidance’ for galaxies with extinction-corrected diameters larger than 1.3 arcmin from extinction levels to : the remaining optical Zone of Avoidance is now limited by (see Fig. 16).
Key Words.:
catalogues – surveys – ISM: dust, extinction – galaxies: fundamental parameters – cosmology: large-scale structure of the Universe1 The Great Attractor and the Zone of Avoidance
Dust and stars in the plane of the Milky Way obscure 20% of the optical extragalactic sky and 10% of the IRAS extragalactic sky. As a result, existing optical galaxy catalogues are severely incomplete close to the Galactic Equator leading to a ‘Zone of Avoidance’ (ZOA) in the distribution of galaxies. For example, the main optical galaxy catalogue of the southern sky (Lauberts 1982) is complete for galaxies with an observed diameter 3 (Hudson and Lynden-Bell 1991) down to extinction-levels of (see Fig. 1 of Kraan-Korteweg & Lahav 2000). At higher extinction-levels, galaxies with an intrinsic diameter of 13 fail to meet the selection criteria (Lauberts’ (1982) selection criterion is ) and only the intrinsically largest and brightest galaxies are detected near the Galactic Plane.
This incompleteness limits our understanding of the origin of the peculiar motion of the Local Group with respect to the Cosmic Microwave Background, and the origin of velocity flow fields in the local Universe.
In our previous Zone of Avoidance (ZOA) catalogue paper (Kraan-Korteweg 2000a, hereafter Paper I), a detailed motivation for our deep optical galaxy search behind the southern Milky Way was given. The main arguments for embarking on a survey of this nature are briefly reiterated here.
-
To improve the determination of the optical galaxy density field across the sky through the reduction of the ZOA. By directly observing the galaxy distribution in the ZOA – contrary to inferring the galaxy density field from the velocity flow field (e.g., Kolatt et al. 1995), or interpolating the galaxy density field outside the ZOA into the ZOA (Yahil et al. 1991) – and comparing this observed distribution with the velocity flow field, fundamental cosmological parameters (such as , where is the linear biasing parameter) can be derived (Strauss & Willick 1995).
In Paper I we have already noted that the deep optical galaxy searches lead to a complete optical galaxy distribution for galaxies with extinction-corrected diameters for , resulting in a reduction of the optical ZOA of over 50% (see also Fig. 4 of Kraan-Korteweg & Lahav 2000).
-
To unveil the full extent of the Great Attractor. The Great Attractor (GA) is seen primarily in the peculiar velocity field of galaxies in the local Universe (Dressler et al. 1987; Lynden-Bell et al. 1988; Kolatt et al. 1995; Tonry et al. 2000). There is no doubt that this overdensity exists. There is, however, still some ambiguity about the true nature and extent of the Great Attractor (e.g., Staveley-Smith et al. 2000). This is primarily caused by its unfortunate location right behind the southern Milky Way at () ( km s-1) (Kolatt et al. 1995). It is very likely that dust and stars in our Galaxy have greatly diminished the optical appearance of the GA, and that a significant fraction (of the mass) of the GA overdensity lies behind the Milky Way.
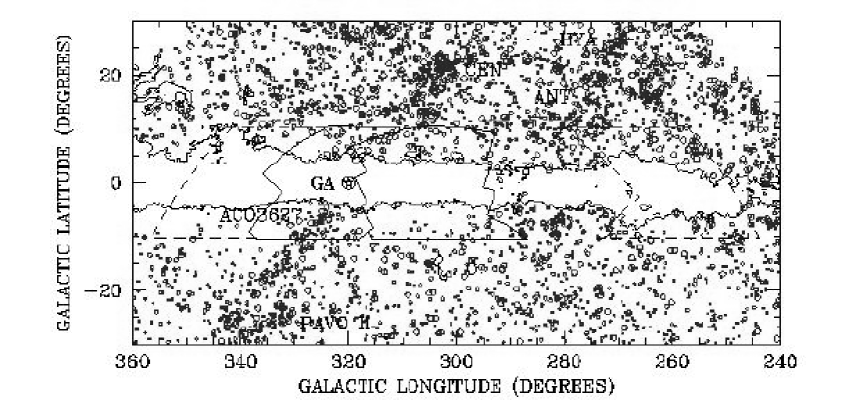
Figure 1 shows the complete diameter-limited southern sky distribution of galaxies, down to a diameter-limit of 3. Only galaxies for which the foreground extinction is less or equal than are shown. The diameters have been corrected for the diminishing effects of the Galactic foreground extinction (Cameron 1990). For the extinction correction we have used the Galactic reddening maps of Schlegel et al. (1998). The results of our survey in the Hydra/Antlia region (Paper I) have been included in this graph.
The regions under investigation in this paper, the Crux region () and the Great Attractor region (), are demarcated by the thick solid line. They lie in between the Hydra/Antlia region (Paper I) and the Scorpius region. The Crux and Great Attractor regions are of particular interest due to their proximity to the Great Attractor. If a large fraction of the mass associated with the Great Attractor has remained hidden behind the Milky Way, this survey should reveal that.
In Sect. 2 we briefly describe the galaxy search. The catalogues are presented in Sect. 3, and in Sect. 4 we discuss the characteristics of the magnitudes and diameters of the galaxies in our survey. In Sec. 5 we discuss the Galactic foreground extinction and in Sect. 6 we assess the completeness of our survey. The performance of the IRAS Point Source Catalogue for studies of large-scale structures at low Galactic latitudes is discussed in Sect. 7. In Sect. 8, we assess the impact of our survey on the current understanding of the Great Attractor.
2 The galaxy search
The search area is divided into five separate regions as illustrated in Fig. 1: the ‘Hydra/Antlia region’ (Paper I), the ‘Crux region’ (this paper), the ‘Great Attractor region’ (this paper), the ‘Scorpius region’ (Kraan-Korteweg & Fairall, in prep.) and the ‘Vela region’ (Kraan-Korteweg & Salem, in prep.).
An extensive description of the galaxy search is given in Paper I. The IIIaJ film copies of the SRC sky survey have been examined systematically by eye in a darkened room, using a proto-type blinking machine (on semi-permanent loan from the Astronomisches Institut der Universität Basel) with a 50 times magnification. An area of 35 x 40 is projected on a screen.
The selection of the IIIaJ film copies of the SRC sky survey as our plate material was made after careful tests (Paper I). Even though the effects of the Galactic foreground extinction are stronger in the blue, the hypersensitized and fine grained emulsion of the IIIaJ films go deeper and show more resolution, compared to their red counterparts.
We imposed a diameter limit of arcminutes for our search. For every galaxy we recorded the major and minor diameter. In addition, we made an estimate of the average surface brightness and the morphological type of the galaxy. The magnitude of each galaxy was derived using the diameters and the estimated average surface brightness. Finally, the positions of all the galaxies were measured with the Optronics machine at ESO in Garching.
The Crux and Great Attractor regions together cover approximately 850 square degrees, ranging in Galactic longitude from to and limited at . It contains 37 fields of the ESO/SRC sky survey, namely F62–67, F94–100, F130–138, F171–180 and F221–225. These film copies were systematically examined by eye by the first author (PAW) with the magnifying viewer.
In total, 8182 galaxy candidates have been identified: 3759 in the Crux region and 4423 in the Great Attractor region, respectively.
2.1 The distribution of galaxies in the Crux region
The resulting distribution of the 3759 galaxies in the Crux region is shown in Galactic coordinates in Fig. 2. The search area is outlined. Next to the expected dependence of the number density on Galactic latitude, strong variations with Galactic longitude are evident. Folding the galaxy distribution with the Galactic reddening maps of Schlegel et al. (1998), indicates that these density fluctuations are indeed extragalactic of origin, even though dark clouds do cause holes in the galaxy distribution (see for instance the galaxy distribution at (). Most noticable in this respect are the dark clouds around and . However, the observed overdensities and filamentary structures in the galaxy distribution can, overall, not be explained by extreme transparent regions.
Three filamentary structures are seen in the Crux region. Two of them are located above the Galactic Plane (GP), around and . These filaments are a likely continuation of the Centaurus Wall (Fairall et al. 1998) into the ZOA. The filament around could, however, also be a part of a larger overdensity extending to lower Galactic longitudes, incorporating the overdensity at (), since dark clouds (Feitzinger and Stüwe 1984) possibly obscure part of this overdensity. One filament below the GP at has, however, no visible counterpart in the galaxy distribution beyond the ZOA. Given the relative small diameters of the galaxies in this filament, it most likely is at larger distances and not connected with the Centaurus–Pavo connection, i.e., the Centaurus Wall.
Number density contours also reveal an overdensity around which could mark a possible cluster of galaxies. Redshifts taken at the South African Astronomical Observatory seem to confirm this cluster, given the small finger-of-god seen at this position (see Fig. 6 of Fairall et al. 1998). This low-mass cluster (the Centaurus-Crux cluster) is part of the Great Attractor overdensity at a mean redshift-distance of 6214 km s-1, albeit on the far side of the Great Attractor.
2.2 The distribution of galaxies in the Great Attractor region
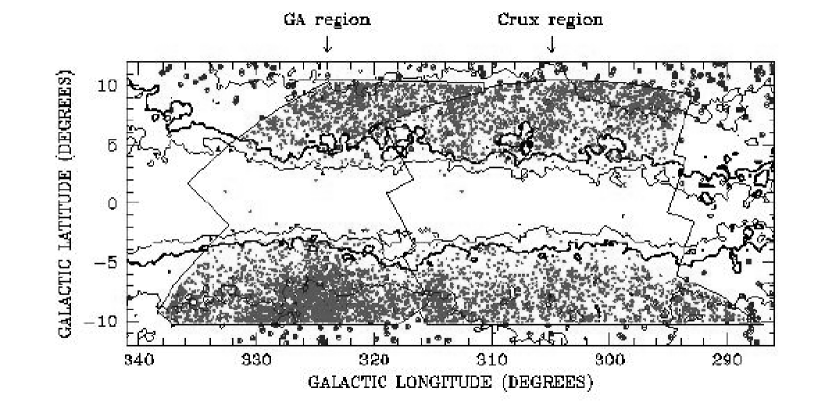
Also shown in Fig. 2 is the distribution in Galactic coordinates of the 4423 galaxies that were found in the GA region. In addition, we have displayed in Fig. 3 the galaxy density contours in the GA region. Examination of both figures reveals three distinct overdensities: one above the Galactic Plane at , and two at negative Galactic latitudes, at and , respectively. The latter is by far the most prominent overdensity of galaxies in the southern Zone of Avoidance (including the surveyed Hydra/Antlia and Crux region). This overdensity is a factor more dense compared to regions at similar Galactic latitude. It is associated with ACO 3627 (Abell et al. 1989), hereafter the Norma cluster. No other Abell cluster is located so close to the Galactic Plane (Andernach 1991).
The overdensity at is located not far from the Norma cluster. It is, however, unrelated to the Norma cluster. The overdensity is more distant at km s-1 (Woudt et al. 1999) and most likely connected to the X-ray bright Triangulum Australis cluster at km s-1) (McHardy et al. 1981).

Comparing the extinction contours in Fig. 2 with the galaxy density contours in Fig. 3, shows that the DIRBE/IRAS reddening map in general is a reliable tracer of extinction down to very low Galactic latitude. The lowest galaxy density contour (0.5 galaxies per square degree) compares well with the extinction contour. At higher extinction values hardly any galaxies are visible.
3 The catalogues
A sample page of the two main catalogues of galaxies in the Crux and GA region is presented in Table 1111Both catalogues in their complete form are available in electronic format at the CDS via anonymous ftp to cdsarc.u-strasbg.fr (130.79.128.5) or via http://cdsweb.u-strasbg.fr/Abstract.html.
A short description of the entries in the catalogues is listed below.
-
Column 1: WKK running number.
-
Column 2: Second identification.
-
Column 3: Identification in the IRAS Point Source Catalog (IRAS PSC hereafter). These galaxies are listed separately in Table 3. The entries are: I (certain identification), P (possible identification), Q (questionable) and N (no credible cross-identification). See Sect. 7 for further discussion.
-
Column 4: Right Ascension RA (1950.0).
-
Column 5: Declination Dec (1950.0).
-
Column 6: Right Ascension RA (2000.0).
-
Column 7: Declination Dec (2000.0).
-
Column 8: Galactic longitude .
-
Column 9: Galactic latitude .
-
Column 10: Field number of the SRC Survey on which the galaxy was detected.
-
Column 11: X-coordinate in mm, measured from the centre of the field listed in column 10.
-
Column 12: Y-coordinate in mm, measured from the centre of the field listed in column 10.
| WKK | Other | IR | R.A. | Dec. | R.A. | Dec. | gal | gal | SRC | x | Type | Remarks | ||||||||||||
|---|---|---|---|---|---|---|---|---|---|---|---|---|---|---|---|---|---|---|---|---|---|---|---|---|
| Ident | Ident | (1950.0) | (1950.0) | (2000.0) | (2000.0) | (∘) | (∘) | (mm) | (mm) | (′′) | ( | u | class. | o | * | |||||||||
| (h m s) | (∘ ′ ′′) | (h m s) | (∘ ′ ′′) | |||||||||||||||||||||
| (1) | (2) | (3) | (4) | (5) | (6) | (7) | (8) | (9) | (10) | (11) | (12) | (13) | (14) | (15) | (16) | (17) | ||||||||
| 1 | 10 08 02.4 | -67 46 31 | 10 09 19.3 | -68 01 17 | 288.64 | -9.77 | 62 | -82.8 | 114.2 | 11x | 8 | 19.2 | 0.17 | ? | S | ? | 1 | |||||||
| 2 | 10 10 31.0 | -68 01 06 | 10 11 48.6 | -68 15 57 | 288.98 | -9.83 | 62 | -69.5 | 102.0 | 13x | 12 | 18.7 | 0.20 | ? | S | L | 1 | vLSB | ||||||
| 3 | 10 12 58.9 | -67 46 15 | 10 14 19.0 | -68 01 11 | 289.03 | -9.50 | 62 | -57.8 | 116.0 | 24x | 7 | 18.3 | 0.22 | ? | S | N | ||||||||
| 4 | 10 16 01.1 | -68 07 12 | 10 17 21.9 | -68 22 14 | 289.47 | -9.63 | 62 | -41.7 | 97.9 | 17x | 5 | 19.1 | 0.18 | S | br.blg | |||||||||
| 5 | L062-005 | 10 16 29.3 | -68 17 24 | 10 17 49.8 | -68 32 27 | 289.60 | -9.74 | 62 | -39.1 | 88.9 | 73x | 15 | 15.8 | 0.18 | S | 1 | N | S | ||||||
| 6 | 10 16 42.8 | -67 54 34 | 10 18 04.8 | -68 09 37 | 289.40 | -9.41 | 62 | -38.7 | 109.3 | 32x | 5 | 18.6 | 0.20 | S | 5 | : | E | vLSBdisk | ||||||
| 7 | 10 17 20.8 | -67 52 41 | 10 18 43.3 | -68 07 45 | 289.44 | -9.36 | 62 | -35.5 | 111.1 | 24x | 7 | 18.0 | 0.20 | S | M | E | p.cov by * | |||||||
| 8 | 10 17 52.0 | -68 17 01 | 10 19 13.4 | -68 32 06 | 289.71 | -9.67 | 62 | -32.3 | 89.5 | 30x | 7 | 17.7 | 0.18 | S | 2 | E | ||||||||
| 9 | 10 17 53.9 | -68 07 11 | 10 19 15.9 | -68 22 16 | 289.62 | -9.53 | 62 | -32.4 | 98.2 | 23x | 7 | 18.6 | 0.19 | S | L | E | 1 | |||||||
| 10 | 10 17 55.5 | -67 55 56 | 10 19 18.2 | -68 11 01 | 289.51 | -9.37 | 62 | -32.5 | 108.3 | 20x | 5 | 18.8 | 0.20 | S | N | br.blg or s.p.* | ||||||||
| 11 | 10 17 58.1 | -67 59 18 | 10 19 20.6 | -68 14 23 | 289.55 | -9.41 | 62 | -32.2 | 105.3 | 13x | 8 | 18.5 | 0.20 | S | 0 | : | br.blg or s.p.* | |||||||
| 12 | 10 18 06.7 | -67 57 45 | 10 19 29.4 | -68 12 51 | 289.54 | -9.39 | 62 | -31.5 | 106.7 | 17x | 12 | 17.9 | 0.20 | S | ? | |||||||||
| 13 | 10 18 07.3 | -68 15 09 | 10 19 29.0 | -68 30 15 | 289.71 | -9.63 | 62 | -31.0 | 91.2 | 16x | 5 | 18.8 | 0.18 | ? | S | neighb.of 8 | ||||||||
| 14 | 10 18 23.8 | -68 27 04 | 10 19 44.9 | -68 42 10 | 289.84 | -9.78 | 62 | -29.4 | 80.6 | 17x | 12 | 17.7 | 0.17 | p.cov by ** | ||||||||||
| 15 | 10 18 25.5 | -68 19 03 | 10 19 47.1 | -68 34 09 | 289.77 | -9.67 | 62 | -29.4 | 87.7 | 27x | 8 | 18.5 | 0.17 | ? | S | vvLSB | ||||||||
| 16 | 10 19 48.6 | -68 35 55 | 10 21 10.1 | -68 51 04 | 290.03 | -9.83 | 62 | -22.3 | 72.8 | 26x | 7 | 18.2 | 0.16 | S | E | br.blg | ||||||||
| 17 | 10 20 07.6 | -67 31 25 | 10 21 33.2 | -67 46 34 | 289.46 | -8.91 | 62 | -21.9 | 130.5 | 15x | 7 | 18.4 | 0.25 | ? | S | cl.to br.*, neighb.of 18 | ||||||||
| 18 | 10 20 18.6 | -67 32 40 | 10 21 44.2 | -67 47 50 | 289.49 | -8.92 | 62 | -20.9 | 129.3 | 16x | 4 | 19.1 | 0.25 | S | E | 1 | neighb.of 17 | |||||||
| 19 | L062-009 | 10 20 36.0 | -68 38 14 | 10 21 57.9 | -68 53 24 | 290.11 | -9.82 | 62 | -18.4 | 70.8 | 38x | 19 | 16.6 | 0.16 | S | S | warped? | |||||||
| 20 | 10 20 43.1 | -68 08 37 | 10 22 06.9 | -68 23 47 | 289.85 | -9.40 | 62 | -18.3 | 97.3 | 16x | 8 | 18.6 | 0.19 | I | ? | 1 | ||||||||
| 21 | 10 20 56.4 | -68 07 13 | 10 22 20.4 | -68 22 24 | 289.86 | -9.37 | 62 | -17.2 | 98.5 | 16x | 13 | 17.8 | 0.19 | S | E | br.blg, poss.larger | ||||||||
| 22 | 10 21 02.6 | -68 03 24 | 10 22 26.9 | -68 18 35 | 289.83 | -9.31 | 62 | -16.7 | 102.0 | 15x | 8 | 18.4 | 0.21 | L | ||||||||||
| 23 | 10 21 11.3 | -68 22 50 | 10 22 34.6 | -68 38 01 | 290.02 | -9.58 | 62 | -15.7 | 84.6 | 19x | 7 | 18.6 | 0.17 | S | E | |||||||||
| 24 | 10 21 23.2 | -68 32 14 | 10 22 46.0 | -68 47 26 | 290.12 | -9.70 | 62 | -14.6 | 76.2 | 17x | 11 | 18.4 | 0.16 | ? | S | br.blg or s.p.* | ||||||||
| 25 | 10 21 26.2 | -67 57 18 | 10 22 51.2 | -68 12 30 | 289.81 | -9.21 | 62 | -14.8 | 107.5 | 27x | 13 | 17.9 | 0.23 | S | 1 | vvLSBdisk | ||||||||
| 26 | 10 21 42.8 | -68 24 57 | 10 23 06.3 | -68 40 09 | 290.08 | -9.58 | 62 | -13.1 | 82.8 | 26x | 9 | 18.1 | 0.17 | ? | ||||||||||
| 27 | 10 22 12.1 | -68 12 20 | 10 23 36.7 | -68 27 33 | 290.00 | -9.38 | 62 | -10.8 | 94.1 | 16x | 15 | 18.2 | 0.18 | S | 1 | vLSBdisk | ||||||||
| 28 | 10 22 20.4 | -68 15 10 | 10 23 44.9 | -68 30 23 | 290.04 | -9.42 | 62 | -10.1 | 91.5 | 17x | 7 | 18.7 | 0.17 | S | br.blg or s.p.* | |||||||||
| 29 | 10 23 16.4 | -68 29 08 | 10 24 40.7 | -68 44 23 | 290.24 | -9.57 | 62 | -5.4 | 79.1 | 16x | 7 | 18.8 | 0.17 | ? | S | * s.p. on blg | ||||||||
| 30 | 10 23 18.1 | -67 59 37 | 10 24 44.2 | -68 14 52 | 289.98 | -9.15 | 62 | -5.4 | 105.5 | 22x | 13 | 17.8 | 0.22 | S | L | S | br.blg or s.p.* | |||||||
| 31 | 10 23 42.1 | -68 14 47 | 10 25 07.5 | -68 30 03 | 290.14 | -9.34 | 62 | -3.3 | 91.9 | 17x | 12 | 18.3 | 0.18 | S | vLSBdisk | |||||||||
| 32 | 10 23 43.0 | -68 49 47 | 10 25 06.4 | -69 05 03 | 290.46 | -9.83 | 62 | -3.1 | 60.7 | 15x | 11 | 18.4 | 0.15 | S | br.blg | |||||||||
| 33 | 10 23 43.2 | -68 12 49 | 10 25 08.8 | -68 28 05 | 290.13 | -9.31 | 62 | -3.3 | 93.7 | 15x | 8 | 18.8 | 0.18 | S | 0 | : | br.blg or s.p.* | |||||||
| 34 | 10 23 46.8 | -68 16 00 | 10 25 12.2 | -68 31 16 | 290.16 | -9.36 | 62 | -2.9 | 90.9 | 16x | 11 | 18.0 | 0.18 | S | 1 | |||||||||
| 35 | N | 10 24 23.1 | -68 05 26 | 10 25 49.5 | -68 20 43 | 290.12 | -9.18 | 62 | .0 | 100.3 | 13x | 7 | 18.9 | 0.20 | ? | 1 | ||||||||
| 36 | 10 26 32.3 | -68 05 04 | 10 28 00.2 | -68 20 25 | 290.29 | -9.07 | 62 | 10.8 | 100.6 | 19x | 7 | 18.2 | 0.20 | S | 0 | |||||||||
| 37 | 10 26 56.0 | -67 35 05 | 10 28 25.8 | -67 50 27 | 290.05 | -8.62 | 62 | 13.0 | 127.4 | 20x | 11 | 18.3 | 0.23 | S | L | vLSBdisk | ||||||||
| 38 | 10 27 02.6 | -67 46 48 | 10 28 31.9 | -68 02 10 | 290.16 | -8.78 | 62 | 13.5 | 116.9 | 23x | 8 | 18.2 | 0.22 | S | 1 | |||||||||
| 39 | 10 27 30.2 | -68 45 01 | 10 28 56.5 | -69 00 23 | 290.71 | -9.59 | 62 | 15.3 | 64.9 | 16x | 8 | 18.5 | 0.18 | S | M | |||||||||
| 40 | 10 27 59.5 | -67 34 58 | 10 29 30.0 | -67 50 21 | 290.14 | -8.57 | 62 | 18.4 | 127.4 | 15x | 9 | 18.6 | 0.23 | ? | br.blg or s.p.* | |||||||||
| 41 | 10 28 21.3 | -69 03 15 | 10 29 47.1 | -69 18 39 | 290.94 | -9.81 | 62 | 19.2 | 48.6 | 20x | 8 | 18.2 | 0.17 | S | N | near br.* | ||||||||
| 42 | 10 28 24.0 | -69 08 50 | 10 29 49.5 | -69 24 14 | 290.99 | -9.88 | 62 | 19.3 | 43.6 | 28x | 5 | 18.0 | 0.17 | S | 0 | S | ||||||||
| 43 | 10 28 27.0 | -68 55 10 | 10 29 53.4 | -69 10 34 | 290.88 | -9.69 | 62 | 19.7 | 55.8 | 19x | 8 | 18.4 | 0.17 | S | 4 | 1 | ||||||||
| 44 | 10 29 17.7 | -69 04 01 | 10 30 44.1 | -69 19 26 | 291.02 | -9.77 | 62 | 23.7 | 47.8 | 16x | 12 | 18.3 | 0.18 | ? | S | near br.* | ||||||||
| 45 | 10 29 57.9 | -69 13 16 | 10 31 24.3 | -69 28 43 | 291.15 | -9.88 | 62 | 26.7 | 39.5 | 19x | 9 | 17.9 | 0.20 | L | ||||||||||
| 46 | 10 30 05.7 | -67 29 35 | 10 31 37.9 | -67 45 02 | 290.27 | -8.39 | 62 | 29.2 | 132.1 | 20x | 5 | 18.9 | 0.29 | S | E | vLSBdisk | ||||||||
| 47 | 10 30 08.8 | -68 45 22 | 10 31 36.9 | -69 00 49 | 290.93 | -9.47 | 62 | 28.1 | 64.4 | 24x | 5 | 18.5 | 0.19 | S | 4 | : | E | |||||||
| 48 | 10 32 25.6 | -68 21 18 | 10 33 56.6 | -68 36 49 | 290.90 | -9.02 | 62 | 39.8 | 85.6 | 16x | 11 | 18.6 | 0.19 | ? | 1 | vvLSB | ||||||||
| 49 | 10 32 28.1 | -69 07 24 | 10 33 56.6 | -69 22 55 | 291.30 | -9.68 | 62 | 38.8 | 44.4 | 16x | 5 | 19.4 | 0.20 | S | N | vLSBdisk | ||||||||
| 50 | 10 32 38.7 | -69 01 37 | 10 34 07.7 | -69 17 08 | 291.26 | -9.59 | 62 | 39.8 | 49.6 | 16x | 4 | 19.4 | 0.19 | S | E | |||||||||
The entries in Table 1 (continued):
-
Column 13: Large diameter and small diameter in arcsec.
-
Column 14: Apparent magnitude .
-
Column 15: The Galactic reddening at the position of the galaxy, as given by the DIRBE/IRAS extinction maps (Schlegel et al. 1998). See Sect. 5.2 for a more detailed discussion on the calibration of the Galactic reddening maps at low Galactic latitudes.
-
Column 16: Morphological type.
-
Column 17: Remarks.
3.1 The Crux region
In total, 3759111One galaxy candidate, WKK 1328, is a known Planetary Nebula which mistakenly remained in the main catalogue. It is not used in any of the figures and discussion. galaxies were detected with a large diameter . This list includes 6 galaxies below our diameter limit. They were included in this list because of their proximity to (and possibly interacting with) neighbouring galaxies that do comply with our diameter limit.
3.1.1 Second identification
A total number of 88 Lauberts (1982) galaxies were identified in the Crux Region (= 2.3%). They are recognisable as ’L’ plus the respective field and running number. A few of the Lauberts galaxies turned out to be 2 or more individual galaxies after closer inspection. The Lauberts identification is given in both case, i.e., L172–002 = WKK1069 & WKK1070. Two galaxies identified by FGCE# are listed in the Flat Galaxy Catalogue (Karenchentsev et al. 1993), two in the Arp Madore Catalog (Arp & Madore 1987) – recognisable by the AM in Column 2 –, one in the Parkes-MIT-NRAO 5GHz Radio Survey (Griffith & Wright 1993, code PMN), and one in the Catalogue of Southern Ring Galaxies (CSRG) (Buta 1995). A further four galaxies are listed in the Southern Galaxy Catalogue (Corwin et al. 1985, code SGC) and 11 galaxies are listed by Visvanathan & Van den Bergh (1992) from observations of luminous spiral galaxies in the direction of the Great Attractor.
3.1.2 x and y coordinates
Positive x-values indicate increasing RA, negative x-values decreasing RA. Positive y-values point north, negative values south with respect to the centre of the field listed in Column 10. This is not necessarily identical to the field on which that galaxy – based on its coordinates and the actual centre of the survey field – actually belongs, but on which it was first identified in the course of this survey.
3.1.3 Morphological types
The morphological types are coded similarly to the precepts of the Second Reference Catalogue (de Vaucouleurs et al. 1976). However, due to the varying foreground extinction, a homogeneous and detailed type classification could not always be accomplished and some codes were added (see Paper I for details).
3.1.4 Descriptive remarks
The remarks and the abbreviations in column 17 are generally selfexplanatory. The most common abbreviations are already explained in Paper I. There are, however, some additional abbreviations used in this paper:
| centr. | central |
|---|---|
| dw. | dwarf |
| ext. | extended |
| pec. | peculiar |
| perp. | perpendicular |
| pl.flaw | plate flaw |
| sm. | small |
| sh.edge | sharp edge |
3.2 The Great Attractor region
In the GA region, 4423 galaxies (WKK 3761 – WKK 8183) were detected with their major axis (4 of which have ). The catalogue of the GA region has the exact same format as the Crux catalogue.
3.2.1 Second identification
Most of the second identifications originate from the ESO/Uppsala Survey of the ESO(B) Atlas (Lauberts 1982), recognisable as ‘L’ plus the respective field and running number. A total number of 108 Lauberts galaxies were identified in the Great Attractor region (= 2.4%). After closer inspection a number of the Lauberts galaxies turned out to be 2 or more individual galaxies. The Lauberts identification is given in both cases, i.e., L138-012 = WKK7813 and WKK7815. Two galaxies indicated by FGCE# are listed in the Flat Galaxy Catalogue (Karenchentsev et al. 1993), three in the Catalogue of Southern Ring Galaxies (CSRG) (Buta 1995), and two radio galaxies were previously recorded (Jones and McAdam 1992, code PKS and JM). A further 8 galaxies are listed in the Southern Galaxy Catalogue (Corwin et al. 1985, code SGC).
4 On the calibration and reliability of the estimated magnitudes and diameters
For the calibration of the estimated magnitudes, the same procedure was followed as presented in Paper I. For each of the 37 eye-balled film copies, the recorded surface brightnesses were calibrated using the intensity scale on the film copies.
Care was taken to scan small overlapping areas on each of the surveyed film copies to check for variations in the zero point of the magnitude estimate from field to field. This comparison revealed that the magnitudes of galaxies in three fields in the Crux region were systematically offset, namely for F65, F98 and F132. Their zero point differences are given in Table 2. A correction was made for these fields, so that all the magnitudes in our catalogue are internally consistent.
| Field | Remarks | N | ||
|---|---|---|---|---|
| 065 | –035 044 | 4 | Too bright | 20 |
| 098 | +035 044 | No deviation | Too faint | 15 |
| 132 | +045 037 | Too faint | 12 |
4.1 Magnitude calibration
4.1.1 The Crux region
Galaxies in common with the ESO–LV catalogue (Lau-berts & Valentijn 1989) have been used to calibrate our magnitude estimates. Unfortunately only 15 ESO–LV ga-laxies are present in the Crux region: 12 galaxies on F171, one galaxy on F173, one galaxy on F175 and one galaxy on F97 (the large, nearby Circinus galaxy).
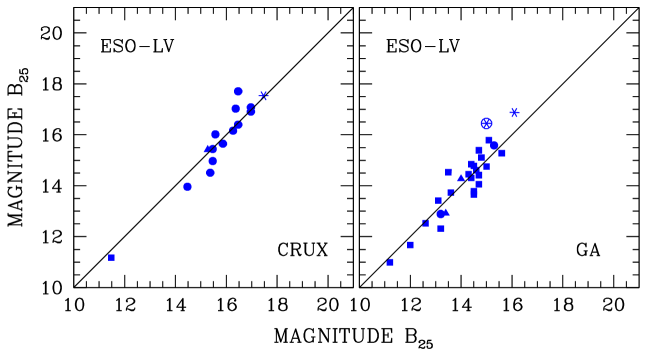
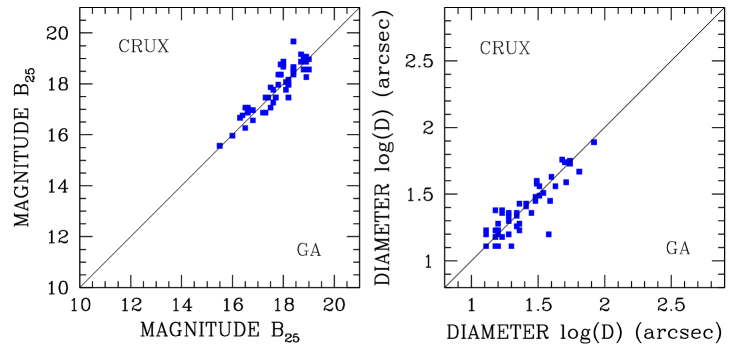
In Fig. 4 we show the magnitude comparison for galaxies which have a counterpart in the ESO–LV catalogue. Our magnitude estimate compares best with the isophotal magnitude of the ESO–LV magnitude (see top-left panel of Fig. 4). In our catalogues, and our papers, our magnitude estimates refer to of the ESO–LV catalogue (Lauberts & Valentijn 1989), and not to Johnson . There is a reported 0.2 mag difference between these two photometric systems (Peletier et al. 1994; Alonso et al. 1993).
The galaxies with a counterpart in the ESO–LV catalogue are indicated by different symbols in the left panel of Fig. 4; circles, stars, triangles and squares for F171, F173, F175 and F97 respectively. The overall agreement in the derived magnitudes is good with no systematic deviations from linearity over the entire range of magnitudes (including even the fainter galaxies). The uncertainty in the derived magnitude estimate (from the ESO–LV comparison) is very good for eye-estimated magnitudes, namely 1. Note that our magnitude estimate is an isophotal magnitude, not the total magnitude of a galaxy.
4.1.2 The Great Attractor region
For the magnitude calibration in the Great Attractor region, the same procedure was followed. In the GA region, 27 galaxies are listed in the ESO–LV catalogue: 2 galaxies on F136, 21 galaxies on F137, 2 galaxies on F138 and 2 galaxies on F221. In the right panel of Fig. 4 we show the results of this calibration; our calibrated magnitude is plotted against the of the ESO–LV catalogue. The filled circles, squares, triangles and stars correspond to galaxies on fields F136, F137, F138 and F221, respectively. Note, that one of the galaxies on F221, indicated by the encircled star symbol in the right panel of Fig. 4, has not been included in the calculation of the mean difference in magnitude and diameter. The entry in the ESO–LV catalogue is questionable for this object.
The correspondence in magnitudes is good with no deviations from linearity over the entire magnitude range. The scatter in the magnitude data in the GA region, , is identical to the observed scatter in the Crux region.
4.2 Diameter comparison
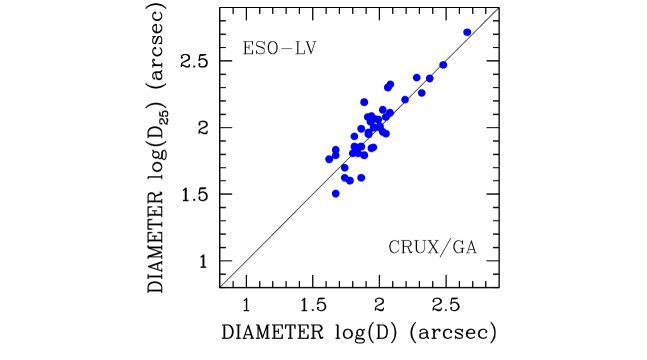
The diameter comparison (with of ESO–LV) reveals a somewhat larger scatter (see Fig. 5) and suggests that our diameter estimates corresponds to a higher isophotal level, i.e. at =24.5 mag arcsec-2. This is entirely consistent with the findings in the Hydra/Antlia region (Paper I). From this comparison – combining the data in the Crux and GA regions – the following statistics are derived:
There is no significant difference in these statistics if the Crux and GA regions are examined individually, namely
4.3 Internal comparison
The overlap of galaxies between the Crux region and the GA region allows a check on the internal consistency. There are 49 galaxies on the border of the Crux and GA region: 4 galaxies on F67/F99, 6 galaxies on F98/F99, 23 galaxies on F174/F221, 6 galaxies on F175/F176, 2 galaxies on F175/F221 and 8 galaxies on F175/F222. These data are displayed in Fig. 6. The data clearly show that the magnitudes and diameters in the Crux and GA region are fully consistent. The scatter in the observed magnitude is low (041). A small offset in the magnitudes (12) is visible. The diameters show no offset and the observed scatter is very low (6′′).
4.4 Other Zone of Avoidance catalogues
A comparison was made for galaxies found in both the Crux region and the adjacent Hydra/Antlia region (Paper I). This is the only other ZOA galaxy catalogue at the moment for which a quantitative comparison is possible. There are 28 galaxies in common, spread over the borders of four fields; 10 galaxies on F171/F170, 14 galaxies on F62/F92, 2 galaxies on F62/F93 and 2 galaxies on F63/F93. These data are shown in Fig. 7. Again the agreement in magnitude is good with a similar scatter around the mean as for the ESO–LV galaxies, and with no systematic deviations from linearity over the displayed magnitude range. A slight offset in the magnitude zero point is evident, the galaxies presented in Paper I in the Hydra/Antlia region are on average 017 brighter. The scatter (055) is identical to the scatter in the ESO–LV data (051). The comparison of the major diameters in the Crux and Hydra/Antlia region, reveals a much lower scatter (6′′) compared to the equivalent ESO–LV analysis (22′′). The tighter relationship implies that the Crux estimates are indeed measured to the same isophotal level =24.5 mag arcsec-2 as the earlier survey (Paper I).
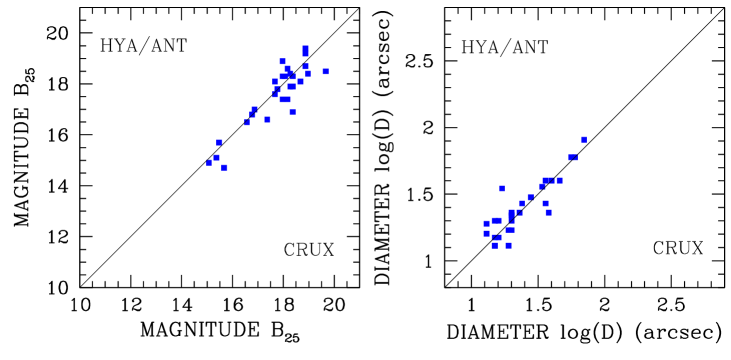
Overall, these statistics show that there are no systematic differences between the Crux and the Hydra/Antlia catalogues, despite the fact that the scanning of the sky survey plates were performed by two different persons (PAW for the Crux and GA region and RCKK for the Hydra/Antlia region). Together, these surveys therefore form a uniformly defined catalogue of partially obscured galaxies in the southern Milky Way.
The two catalogues of partially obscured galaxies in the southern Milky Way, i.e., the Hydra/Antlia region (Paper I) and the Crux and GA regions are internally consistent and can therefore be merged to form a large, uniformly defined catalogue of galaxies in the southern ZOA, spanning in Galactic longitude and in Galactic latitude. The observational evidence for this statement are listed below:
-
The identical scatter in the comparison with the ESO–LV magnitude: 046 (Hydra/Antlia, Paper I), 051 (Crux) and 051 (GA).
-
The small offset in the magnitude comparison with other ZOA catalogues: 017 (Crux vs. Hydra/Antlia) and (GA vs. Crux).
-
The negligable offset and consistent scatter in the major diameter estimates: for both the Crux vs. Hydra/Antlia and GA vs. Crux comparison.
5 The Galactic foreground extinction
A detailed analysis of the Galactic foreground extinction is presented by Woudt (1998). Here, the two most common extinction indicators are briefly discussed.
5.1 The neutral hydrogen in the Milky Way
Assuming no variation in the gas-to-dust ratio, the neutral hydrogen (HI) content in the Milky Way can be used as an indicator of the foreground extinction. Close to the plane of the Milky Way (within of the Galactic Equator), the Galactic HI line might be saturated, thereby underestimating the true extinction. At these latitudes the Galactic CO (Dame et al. 1987) might be a better tracer. However, as we have found no galaxy candidates that close to the Galactic Plane, the HI column densities would in principle be adequate.
Following the precepts of Burstein & Heiles (1978, 1982), the Galactic foreground extinction = (Cardelli et al. 1989) can be determined from the Galactic HI column density alone by
| (1) |
where is in units of 1021 atoms cm-2. However, the gas-to-dust ratio does vary locally. As discussed in Woudt (1998), we support the earlier finding by Burstein et al. (1987), that the HI gas-to-dust in the Crux and Great Attractor region is twice the nominal value. A higher gas-to-dust ratio locally implies an overestimation of the Galactic extinction.
5.2 The 100 micron DIRBE/IRAS extinction maps
Schlegel et al. (1998) have presented the 100 micron extinction maps from the DIRBE experiment. These maps have a much better angular resolution (61) compared to the HI maps (20–30 arcminutes) and variations in the gas-to-dust ratio are not important. These maps provide a direct measure of the dust column density. The reddening maps, however, have only been calibrated by the colours of elliptical galaxies ( and , see Schlegel et al. (1998) for details) at intermediate and high Galactic latitude.
Woudt (1998) has tested the calibration of the reddening maps at low latitude using the () colour and Mg2 index of 18 elliptical galaxies in the Crux and Great Attractor region. The agreement between the reddening values of the DIRBE/IRAS extinction maps and the values derived from the colour-Mg2 relation (Bender et al. 1993) is generally good (Woudt 1998). Note, however, that because of the choice of and filters the latter values are very sensitive to the assumed Galactic extinction law (). Large systematic uncertainties could therefore arise when deviations from the mean Galactic extinction law occur. A different choice of filters, e.g. and , eliminates this uncertainty because the Galactic extinction law is insensitive to the assumed value of in the near infrared (see Cardelli et al. 1989). A calibration of the reddening maps at low Galactic latitude using the () colour of low-latitude elliptical galaxies is highly desirable. For more details on the problem of selecting the ‘right’ value, see McCall & Armour (2000).
In this paper, we exclusively use the DIRBE/IRAS reddening maps for extinction corrections. Furthermore, we assume for the conversion of selective extinction to total extinction, and (Cardelli et al. 1989).
6 Properties of the obscured galaxies
6.1 The Crux region
The top panels of Fig. 8 show the distribution of the observed magnitudes (left) and diameters (right) of the 3759 galaxies in the Crux region. On average the galaxies are quite small ( = 231) and faint ( = 182); nearly identical to what was found in the Hydra/Antlia region (Paper I), i.e., 218 and 182. The above graph indicates that our survey is fairly complete for galaxies greater than or brighter than . As the diameters and magnitudes in this diagram are heavily influenced by the obscuring effects of the Milky Way, these numbers should be regarded as indicative only.

In the Crux region, 106 galaxies have a recorded major diameter (the Lauberts (1982) diameter limit which is indicated in Fig. 8). Of the 88 galaxies recorded by Lauberts in the Crux region, 22 (= 25%) are actually smaller than 60′′. In almost all cases, these galaxies are either covered by many stars, or are part of a double/triple system. Nonetheless, 40 galaxies (40/106 = 38%) with were not previously recorded by Lauberts. These statistics improve somewhat in favour of the Lauberts catalogue for galaxies larger than , the diameter limit for which the ESO–LV catalogue is said to be complete (Hudson & Lynden-Bell 1991). Still, 10 galaxies out of the 45 galaxies larger than (= 22%) were not identified by Lauberts.
Using the DIRBE/IRAS reddening values (Column 15 in Table 1) the observed parameters (diameters and magnitudes) can be corrected for absorption following Cameron (1990). We then obtain the distribution of extinction-corrected magnitudes () and diameters () as shown in the lower panels of Fig. 8. Extinction-corrected diameters of the galaxies in the deepest extinction layers seem unrealistically large. The Circinus galaxy, WKK3050, with has an observed diameter of 457′′ (). After the extinction correction, the diameter of the Circinus galaxy would be 11.1 degrees ()! This galaxy is not displayed in Fig. 8. Because of this, a more detailed study of the obscurational effects on the magnitudes and diameters of ZOA galaxies is desired, especially for high extinction ().
An additional complication arises for the Circinus galaxy, as well as for other strong IRAS galaxies. This nearby Seyfert 2 galaxy is a strong IRAS source ( Jy). This most definitely influences the derived Galactic reddening value by Schlegel et al. (1998) at the location of Circinus, as only 5 arcminutes from the centre of Circinus, the extinction drops to , a full lower. One should be aware when using the Schlegel et al. (1998) reddening maps that local galaxies – depending on the flux – can in fact contaminate the reddening values. Care should be taken when using these extinction values at face-value.
The average, extinction-corrected magnitudes and diameters for the galaxies in the Crux region are and . These means have been determined for the magnitude and diameter range displayed in the lower panels of Fig. 8, not including those galaxies that might have been overcorrected, i.e., only galaxies with an extinction correction of are used. Note also that the extinction correction does not take the patchiness in the distribution of, for instance, local dust clouds into account.
A total of 593 galaxies in the Crux region have extinction-corrected diameters larger or equal than , i.e., the Lauberts (1982) diameter limit. This means that in the absence of the obscuration by the Milky Way, Lauberts would have detected 593 galaxies instead of the recorded 88 galaxies. The diminishing effects of the Galactic foreground extinction could not have been more clearly illustrated.
6.2 The Great Attractor region

The upper panels of Fig. 9 display the distribution of the observed apparent magnitude () and major diameter () of the galaxies unveiled in the GA region. The observed characteristics of the galaxies in the GA region are significantly different from both the Crux and Hydra/Antlia region, see also Sect. 6.4. On average, the galaxies are somewhat larger () and much brighter () compared to the Crux region ( and ) and the Hydra/Antlia region ( and ). This either means that the Galactic foreground extinction is much lower in the GA region (to explain for the fact that the galaxies are on average 0.7 mag brighter in the GA region), or, alternatively, the GA region encompasses a nearby overdensity of galaxies.
From the Galactic reddening maps (Schlegel et al. 1998) there is some evidence that the mean extinction for galaxies in the Crux region is somewhat higher () compared to galaxies in the GA and Hydra/Antlia regions (see the large excursion of the contour below the Galactic Plane at in Fig. 1). This difference is not enough, however, to fully explain why galaxies in the GA region are 0.7 mag brighter, especially since galaxies in the Hydra/Antlia region are subjected to approximately the same extinction as galaxies in the GA region. Therefore both effects seem to have influenced the GA sample (see Sect. 6.4).
In the GA region, 161 galaxies have a major diameter , of which 95 had been recorded previously by Lauberts (1982). 13 of the galaxies found by Lauberts (1982) have diameters smaller than 60′′. In the Crux region, 38% of the galaxies larger than had not been recorded by Lauberts, in the GA region this incompleteness is 40%.
The “extinction-corrected” magnitude and diameter distributions of the galaxies in the GA region are shown in the lower panels of Fig. 9. The mean, extinction-corrected magnitude and diameter of the galaxies in the GA region is , and , respectively. These values have been determined based on the galaxies displayed in the lower panels of Fig. 9, i.e., not including the galaxies in the deepest layers of the foreground extinction for which the correction becomes increasingly uncertain. Galaxies with a total extinction correction of mag (see Cameron, 1990) are not included in these statistics.
A total of 584 galaxies have extinction-corrected diameters larger or equal than 60′′, i.e., the Lauberts (1982) diameter limit. In the absence of the obscuration by the Milky Way, Lauberts would have detected 584 galaxies within the limits of our survey, instead of the recorded 108 galaxies. Again, these numbers demonstrate the incompleteness (= 82%) in the Lauberts catalogue near the plane of the Milky Way.
6.3 The completeness of our survey
The cumulative magnitude and diameter curves, and , plotted in Fig. 10 allow us to assess the completeness of our optical survey. For this analysis, we have taken all the galaxies in the Crux region and the Great Attractor region together. The four different curves in Fig. 10 illustrate four intervals in Galactic foreground extinction. In the interval (open circles in Fig. 10), 2978 galaxies are present. 4045 galaxies are located in the next interval (, open squares), 932 galaxies in (open triangles), and 157 galaxies are present in the interval (filled triangles).
In the top panels which shows the “observed” diameter and magnitude distribution, one can see a linear increase in the cumulative number distribution for up to and (), after which the curves begin to flatten. These numbers give a fair indication of the completeness limits of the observed parameters of our survey and compare well with the completeness limits found in the Hydra/Antlia region ( and for , see Paper I).

In terms of merging our optical catalogue with existing catalogues, we should, however, consider the completeness limits of the “extinction-corrected” parameters (see the bottom panels of Fig. 10, where one can read of the completeness limits once the curves begin to flatten). The two curves in Fig. 11 show how our observed diameter completeness limit of translates into an extinction-corrected diameter completeness limit for elliptical and spiral galaxies, respectively, as a function of the Galactic foreground extinction, following the precepts of Cameron (1990). The horizontal bars in Fig. 11 correspond to the completeness limits derived from the four different intervals displayed in the lower-right panel of Fig. 10, indicating the range of which they were determined. The vertical bars show the error in the determined completeness limit.
The curves illustrate that at higher extinction, the diameter correction increases dramatically. An uncertainty of 0.1 mag in the Galactic foreground extinction translates into an uncertainty of 7%, 8% and 11% in the diameter correction for = 2m, 3m and 4m, respectively. For the extinction-correction we use the galaxy classification given in Tables 1 and 2. As the dominant fraction of the galaxies found in our survey are spirals – the mixture of galaxy types in the Crux and GA region is (E-S0 : S-I : unclassified) (10% : 75% : 15%) – it is to be expected that our measured diameter completeness limit follows the ‘spiral’ curve closely.
Despite the uncertainties in the extinction correction, Fig. 11 shows that we are complete for all galaxies (spiral and elliptical) with for and that we are complete for all galaxies (ellipticals and spirals) with for , the ESO-LV diameter completeness limit. This, again, is consistent with the results in the Hydra/Antlia region (Paper I).

6.4 An overdensity in the Great Attractor region

In Fig. 12, we compare the magnitude distribution in the Great Attractor region with that of the Hydra/Antlia and Crux region for all the galaxies with . The distribution is given in number of galaxies per square degree in bins of 0.5 mag. At extinction levels , the total area covered in the Hydra/Antlia, Crux and Great Attractor region is approximately 223, 266 and 175 square degrees, respectively. Within these limits, there are 3227, 3629 and 4326 galaxies present in our catalogues.
The distribution of the extinction-corrected magnitudes (lower-right panel of Fig. 12 of the Hydra/Antlia and Crux galaxies match surprisingly well, despite the different large-scale structures that have been observed in these regions (Kraan-Korteweg et al. 1995; Fairall et al. 1998). The extinction-corrected magnitude distribution in the Great Attractor region is noticeably different, it reveals a significant excess of galaxies in the Great Attractor region.
In the histogram in the top panel of Fig. 12 the difference of the GA distribution with the mean of the Crux and Hydra/Antlia profiles (lower-right panel) is shown. The distribution (shape) of the excess galaxies is similar to the magnitude distribution of galaxies in the Coma cluster (data from Godwin et al., 1983) for , except for an offset of the histogram of 1 magnitude. Hence, this excess could (in part) be explained by a rich cluster of galaxies present in the Great Attractor region, i.e., the Norma cluster. The galaxies in Coma are (on average) one magnitude fainter than the excess galaxies in the Great Attractor region which puts the excess galaxies in the distance range of the Great Attractor, i.e., 1.6 times closer than Coma, implying a redshift-distance of 4250 km s-1. Given the uncertainties in the extinction correction, this number should be regarded as tentative only.
Despite the uncertainties – most notably the extinction correction – the magnitude distribution in the GA region alone provides strong evidence for a significant excess of galaxies belonging to the Great Attractor, a large fraction of which is due to the Norma cluster.
It should be noted that the galaxies in the vicinity of the Norma cluster are of distinctly different morphological mix as compared to the overall mixture of galaxy types. Overall, the galaxy mixture is (E/S0 – Spiral/Irregular – Uncertain) (10% – 75% – 15%), but within the Abell radius of the Norma cluster ( at the distance of the Norma cluster; Woudt, 1998) the galaxian mix is (E/S0 – S/I – Uncertain) = (20% – 68% – 12%), and within the core radius of the Norma cluster (; Woudt, 1998) the mixture of galaxy types is (E/S0 – S/I – Uncertain) = (48% – 48% – 4%). These numbers indicate that the Norma cluster is a rich cluster, dominated by a large population of early-type galaxies.
7 Galaxies in the IRAS Point Source Catalogue
As before (Paper I), we have cross-correlated the entries in our deep optical catalogue with the IRAS Point Source Catalogue (IRAS PSC). The IRAS PSC has been extensively used for studies of the large-scale structures in the Universe (e.g., Saunders et al. 2000). Our deep optical galaxy catalogue in the ZOA offers an opportunity to verify the performance of ‘blind’ IRAS searches (i.e., selecting galaxies purely on the basis of their IRAS colours) close to the Galactic Plane, where source confusion could play a significant role.
7.1 IRAS PSC sources in the Zone of Avoidance
We have selected galaxies in our optical galaxy catalogues which have a positional overlap (within a radius of 2 arcmin) with sources in the IRAS PSC. Within this selection, there are some galaxies for which the IRAS PSC association is unlikely because of their unlikely colours or large positional offsets. They are marked with ‘N’ in Table 1. They are not accepted as a galaxy with a credible IRAS PSC counterpart, nor are they listed in Table 3.
A sample page of the remaining galaxies is given in Table 3111The IRAS cross-identifications in the Crux, respectively the GA region, are available in electronic format in their complete form at the CDS via anonymous ftp to cdsarc.u-strasbg.fr (130.79.128.5) or via http://cdsweb.u-strasbg.fr/Abstract.html. The entries in Table 3 are:
-
Column 1:
Identification in the IRAS Point Source Catalogue. If the IRAS name is followed by a ‘Y’, it is also in the IRAS galaxy list of Yamada et al. (1993), if followed by a ‘*’, it satisfies all the Yamada et al. selection criteria, but is not listed there.
-
Column 2:
Quality parameter of the IRAS PSC cross-identification. Depending on the probability that the cross-identification is correct, the following categories were defined: (I) high certainty identification with IRAS PSC, (P) possible match with IRAS PSC, but either the colour is atypical for galaxies or the separation with regard to the uncertainty ellipse relatively large, (Q) questionable cross-identification because of large positional offset and/or unlikely IRAS-colour.
-
Column 3:
The WKK identification number as in the optical galaxy catalogue (as given in Table 1). The ‘L’ indicates whether this is also a Lauberts (1982) galaxy.
-
Column 4:
As Column 4 in Table 1.
-
Column 5:
As Column 5 in Table 1.
-
Column 6:
As Column 8 in Table 1.
-
Column 7:
As Column 9 in Table 1.
-
Column 8:
As Column 13 in Table 1.
-
Column 9:
As Column 14 in Table 1.
-
Column 10:
As Column 16 in Table 1.
-
Column 11:
Angular separation in arcsec between the optical position (Columns 4 and 5) and the position quoted in the IRAS Point Source Catalogue.
-
Column 12:
The flux density at 12m.
-
Column 13:
The flux density at 25m.
-
Column 14:
The flux density at 60m.
-
Column 15:
The flux density at 100m.
-
Column 16:
The IRAS flux qualities at 12m, 25m, 60m, and 100m, where ‘1’ indicates a lower limit, ‘2’ an uncertain flux, and ‘3’ a good quality flux.
-
Column 17:
The IRAS colour = .
-
Column 18:
The IRAS colour = .
7.1.1 The Crux region
211 Galaxies in our Crux catalogue have a positional overlap (within a radius of 2 arcmin) with sources in the IRAS PSC. Of these galaxies, 64 are unlikely IRAS galaxies (N) because of their atypical IRAS colours and large positional offset to the centre of the IRAS PSC source.
7.1.2 The Great Attractor region
Similarly, we found a positional overlap for 266 galaxies in the Great Attractor region. Of these 266 galaxies, 71 galaxies have an unlikely counterpart.
7.2 Properties of the IRAS PSC galaxies
Only 171 of the 342 galaxies in the Crux and GA region listed in Table 3 have a certain IRAS counterpart, based on the second and third colour criterion of Yamada et al. (1993), i.e., and , respectively (see Columns 17 and 18). They are labelled with an ‘I’. Within this sample of 171 galaxies there are 10 IRAS PSC sources that have two galaxies associated with them, and one IRAS PSC source with three galaxies, indicated by ‘I2’ and ‘I3’, respectively, in Column 2. So there are 171 galaxies associated with 159 IRAS PSC sources.
The number of galaxies with certain IRAS PSC cross-identification is reduced to 165 (associated with 143 IRAS PSC sources) if a strict lower limit for the flux density at 60m, i.e., Jy, is imposed.
Surprisingly, only 104 IRAS PSC sources were identified by Yamada et al. (1993), leaving 39 sources (= 27%) undetected. Note, that all the galaxies found by Yamada et al. (1993), that satisfy our selection criterion of , have been retrieved by our deep optical survey.
| optical | IRAS | |||||||||||||||||||||||
|---|---|---|---|---|---|---|---|---|---|---|---|---|---|---|---|---|---|---|---|---|---|---|---|---|
| IRAS PSC | IR | WKK | R.A. | Dec. | gal | gal | Type | Sep | Flux Density | Qual. | Color | |||||||||||||
| Ident. | (h m s) | (∘ ′ ′′) | (∘) | (∘) | (′′) | (m) | class. | ( ′′) | ||||||||||||||||
| (1) | (2) | (3) | (4) | (5) | (6) | (7) | (8) | (9) | (10) | (11) | (12) | (13) | (14) | (15) | (16) | (17) | (18) | |||||||
| I10505-6906 | I | 114 | 10 50 35.6 | -69 06 32 | 292.73 | -8.90 | 19x | 13 | 17.3 | E | 4 | 0.31 | 0.25 | 0.59 | 1.15 | 1 1 3 1 | 0.22 | 1.95 | ||||||
| I10564-6923 | Y | I | 150 | L | 10 56 23.7 | -69 22 53 | 293.32 | -8.92 | 77x | 31 | 15.5 | S | 17 | 0.25 | 0.28 | 1.54 | 2.19 | 1 3 3 3 | 0.03 | 1.42 | ||||
| I10565-6822 | * | I | 151 | 10 56 29.0 | -68 21 24 | 292.89 | -7.99 | 19x | 9 | 18.5 | I | ? | 91 | 0.36 | 0.25 | 0.65 | 1.94 | 1 1 1 3 | 0.21 | 2.98 | ||||
| I10576-6926 | I | 158 | L | 10 57 35.4 | -69 26 32 | 293.44 | -8.93 | 51x | 40 | 15.7 | S | 5 | 22 | 0.29 | 0.25 | 0.49 | 1.89 | 1 1 3 1 | 0.30 | 3.86 | ||||
| I10593-6723 | Y | I | 163 | 10 59 20.8 | -67 23 10 | 292.73 | -6.99 | 27x | 15 | 17.6 | 7 | 0.25 | 0.25 | 0.98 | 3.15 | 1 1 3 3 | 0.07 | 3.21 | ||||||
| I11073-6958 | Y | I | 207 | 11 07 23.1 | -69 59 00 | 294.45 | -9.08 | 48x | 32 | 15.8 | S | Y | 4 | 32 | 0.25 | 0.25 | 0.65 | 1.53 | 1 1 3 3 | 0.15 | 2.35 | |||
| I11083-6858 | Y | I | 213 | L | 11 08 22.9 | -68 58 11 | 294.14 | -8.11 | 78x | 52 | 14.8 | S | B | 3 | 6 | 0.25 | 0.25 | 0.68 | 1.96 | 1 1 3 3 | 0.14 | 2.88 | ||
| I11111-6859 | Y | I | 224 | L | 11 11 10.8 | -68 59 39 | 294.38 | -8.04 | 255x | 50 | 13.5 | S | 3 | 19 | 0.25 | 0.25 | 1.33 | 3.45 | 1 1 3 3 | 0.04 | 2.59 | |||
| I11173-6834 | I | 247 | 11 17 20.9 | -68 35 04 | 294.76 | -7.46 | 34x | 8 | 18.1 | S | 6 | 45 | 0.35 | 0.27 | 0.40 | 1.86 | 3 1 1 1 | 0.59 | 4.65 | |||||
| I11205-6909 | Y | I2 | 257 | 11 20 31.1 | -69 08 21 | 295.22 | -7.88 | 26x | 15 | 17.3 | S | 92 | 0.25 | 0.25 | 1.75 | 4.70 | 1 1 3 3 | 0.02 | 2.69 | |||||
| I11205-6909 | Y | I2 | 258 | 11 20 32.9 | -69 10 05 | 295.23 | -7.91 | 34x | 17 | 16.7 | S | 1 | 32 | 0.25 | 0.25 | 1.75 | 4.70 | 1 1 3 3 | 0.02 | 2.69 | ||||
| I11245-6804 | P | 269 | 11 24 29.6 | -68 04 06 | 295.21 | -6.75 | 40x | 28 | 15.8 | S | 1 | 20 | 0.65 | 0.25 | 0.39 | 2.72 | 1 1 3 1 | 1.07 | 6.97 | |||||
| I11246-7123 | I | 270 | 11 24 35.1 | -71 25 13 | 296.31 | -9.92 | 22x | 19 | 17.7 | S | L | 110 | 0.28 | 0.25 | 0.40 | 1.84 | 1 1 1 3 | 0.44 | 4.60 | |||||
| I11256-7026 | Y | I | 278 | 11 25 41.6 | -70 27 07 | 296.08 | -8.98 | 39x | 11 | 17.0 | S | 1 | 9 | 0.25 | 0.25 | 1.02 | 2.28 | 1 1 3 3 | 0.06 | 2.24 | ||||
| I11281-6952 | I | 285 | L | 11 28 12.7 | -69 54 26 | 296.11 | -8.39 | 54x | 28 | 16.2 | S | 7 | 99 | 0.28 | 0.25 | 0.40 | 1.18 | 1 1 1 3 | 0.44 | 2.95 | ||||
| I11340-7031 | Y | I | 301 | L | 11 34 2.3 | -70 31 50 | 296.78 | -8.84 | 69x | 38 | 15.5 | S | 3 | : | 4 | 0.25 | 0.25 | 0.82 | 1.27 | 1 1 3 2 | 0.09 | 1.55 | ||
| I11366-6939 | Q | 304 | L | 11 36 39.1 | -69 41 05 | 296.75 | -7.96 | 81x | 23 | 15.7 | S | 5 | 80 | 0.43 | 0.25 | 0.50 | 8.00 | 1 1 3 1 | 0.43 | 16.00 | ||||
| I11470-6824 | Y | I | 358 | 11 47 2.2 | -68 24 55 | 297.32 | -6.50 | 58x | 9 | 16.8 | S | 4 | 5 | 0.25 | 0.25 | 2.56 | 4.75 | 1 2 3 3 | 0.01 | 1.86 | ||||
| I11485-7147 | I | 370 | 11 48 34.7 | -71 47 26 | 298.26 | -9.75 | 35x | 24 | 16.7 | S | 8 | 0.25 | 0.25 | 0.57 | 1.60 | 1 1 3 3 | 0.19 | 2.81 | ||||||
| I11508-5320 | Y | I | 399 | 11 50 53.9 | -53 20 11 | 294.30 | 8.28 | 38x | 26 | 16.1 | S | 1 | 9 | 0.25 | 0.20 | 1.97 | 4.53 | 1 2 3 3 | 0.01 | 2.30 | ||||
| I11512-5349 | I | 404 | L | 11 51 11.8 | -53 49 35 | 294.45 | 7.81 | 65x | 27 | 15.9 | S | 2 | 11 | 0.44 | 0.26 | 0.52 | 2.22 | 1 1 3 2 | 0.42 | 4.27 | ||||
| I11516-5353 | Q | 411 | L | 11 51 44.4 | -53 52 57 | 294.54 | 7.78 | 60x | 40 | 15.6 | S | R | 100 | 3.67 | 1.23 | 0.40 | 4.75 | 3 3 1 1 | 28.21 | 11.88 | ||||
| I11529-5638 | P | 428 | 11 52 53.8 | -56 38 16 | 295.31 | 5.12 | 54x | 16 | 16.8 | 5 | 0.48 | 0.25 | 0.37 | 13.09 | 1 1 3 1 | 0.88 | 35.38 | |||||||
| I11550-5544 | Q | 478 | 11 55 8.8 | -55 42 47 | 295.42 | 6.09 | 15x | 9 | 18.9 | L | 103 | 4.10 | 1.85 | 0.49 | 8.96 | 3 3 1 1 | 31.59 | 18.29 | ||||||
| I11566-5307 | Y | I | 499 | L | 11 56 36.6 | -53 07 50 | 295.09 | 8.67 | 87x | 56 | 14.5 | F | 5 | 0.25 | 0.25 | 1.05 | 3.08 | 1 1 3 3 | 0.06 | 2.93 | ||||
| I11579-5346 | Y | I | 524 | 11 57 59.5 | -53 46 31 | 295.43 | 8.08 | 46x | 24 | 16.0 | S | 1 | 48 | 0.25 | 0.25 | 0.89 | 2.77 | 1 1 3 3 | 0.08 | 3.11 | ||||
| I12002-5333 | Y | I | 560 | 12 00 13.2 | -53 33 26 | 295.71 | 8.35 | 31x | 23 | 16.3 | F | ? | 4 | 0.31 | 0.94 | 1.92 | 2.09 | 3 3 3 2 | 0.08 | 1.09 | ||||
| I12018-5219 | I | 584 | 12 01 50.5 | -52 18 05 | 295.72 | 9.63 | 32x | 32 | 16.6 | S | Y | 5 | 77 | 0.25 | 0.25 | 0.44 | 1.46 | 1 1 1 3 | 0.32 | 3.32 | ||||
| I12110-5602 | Y | I | 768 | 12 11 0.6 | -56 02 06 | 297.68 | 6.17 | 22x | 16 | 17.0 | L | 17 | 0.25 | 0.28 | 1.22 | 5.50 | 1 1 3 2 | 0.05 | 4.51 | |||||
| I12113-5511 | * | I | 774 | 12 11 16.5 | -55 10 58 | 297.59 | 7.02 | 35x | 9 | 17.2 | S | M | 89 | 1.09 | 0.36 | 0.72 | 1.88 | 3 3 3 1 | 0.76 | 2.61 | ||||
| I12115-5252 | I | 778 | 12 11 27.9 | -52 51 56 | 297.28 | 9.32 | 13x | 12 | 18.2 | 44 | 0.27 | 0.25 | 0.55 | 1.47 | 1 1 3 1 | 0.22 | 2.67 | |||||||
| I12116-6001 | * | I | 784 | 12 11 40.8 | -60 01 25 | 298.35 | 2.24 | 113x | 75 | 14.1 | S | 6 | 3.23 | 8.24 | 89.96 | 208.60 | 3 3 3 2 | 0.00 | 2.32 | |||||
| I12116-5615 | Y | I | 787 | 12 11 42.6 | -56 15 53 | 297.81 | 5.96 | 20x | 17 | 17.5 | L | 11 | 0.36 | 1.10 | 9.68 | 12.34 | 3 3 3 3 | 0.00 | 1.27 | |||||
| I12116-5809 | Q | 788 | 12 11 45.5 | -58 10 12 | 298.09 | 4.08 | 59x | 11 | 17.0 | S | 5 | 77 | 0.34 | 0.25 | 0.72 | 27.64 | 3 1 1 1 | 0.16 | 38.39 | |||||
| I12125-5746 | Q | 801 | 12 12 32.9 | -57 47 19 | 298.14 | 4.47 | 19x | 8 | 18.3 | S | 2 | : | 29 | 0.53 | 0.56 | 0.68 | 21.32 | 1 1 3 1 | 0.64 | 31.35 | ||||
| I12150-5927 | P | 860 | 12 15 06.1 | -59 27 22 | 298.70 | 2.86 | 22x | 9 | 18.0 | S | 52 | 0.95 | 1.41 | 3.35 | 25.93 | 2 3 2 3 | 0.12 | 7.74 | ||||||
| I12154-5627 | Y | I | 867 | 12 15 28.2 | -56 27 46 | 298.36 | 5.84 | 47x | 35 | 16.0 | L | 7 | 0.25 | 0.25 | 1.05 | 3.81 | 1 1 3 3 | 0.06 | 3.63 | |||||
| I12181-7108 | Y | I | 915 | 12 18 10.3 | -71 08 48 | 300.49 | -8.70 | 16x | 11 | 18.6 | 5 | 0.33 | 0.25 | 0.74 | 2.11 | 1 1 3 1 | 0.15 | 2.85 | ||||||
| I12195-5436 | I | 945 | 12 19 31.8 | -54 36 39 | 298.70 | 7.74 | 28x | 7 | 17.7 | S | L | ? | 53 | 0.33 | 0.28 | 0.40 | 1.48 | 3 1 1 1 | 0.58 | 3.70 | ||||
| I12196-5315 | I | 950 | 12 19 43.3 | -53 15 36 | 298.57 | 9.09 | 15x | 9 | 18.5 | I | 32 | 0.28 | 0.35 | 0.50 | 1.21 | 1 1 1 3 | 0.39 | 2.42 | ||||||
| I12199-5820 | Y | I | 957 | L | 12 19 54.4 | -58 20 20 | 299.18 | 4.05 | 101x | 27 | 15.0 | S | 2 | : | 31 | 0.25 | 0.25 | 2.37 | 5.63 | 1 1 3 3 | 0.01 | 2.38 | ||
| I12200-5404 | P | 959 | 12 19 59.5 | -54 04 38 | 298.71 | 8.28 | 50x | 19 | 15.8 | S | M | 43 | 0.25 | 0.33 | 0.54 | 3.21 | 1 1 3 1 | 0.28 | 5.94 | |||||
| I12203-5456 | I | 968 | 12 20 21.1 | -54 56 38 | 298.86 | 7.43 | 17x | 12 | 17.4 | E | 13 | 0.37 | 0.25 | 0.50 | 1.47 | 1 1 3 1 | 0.37 | 2.94 | ||||||
| I12265-7203 | * | I | 1072 | 12 26 30.6 | -72 03 10 | 301.25 | -9.53 | 23x | 15 | 17.3 | S | 1 | : | 25 | 0.26 | 0.25 | 0.60 | 2.44 | 1 1 3 1 | 0.18 | 4.07 | |||
| I12269-5404 | Y | I | 1078 | L | 12 27 02.7 | -54 05 14 | 299.75 | 8.37 | 74x | 16 | 15.9 | S | 1 | 48 | 0.33 | 0.25 | 0.99 | 2.12 | 1 1 3 2 | 0.08 | 2.14 | |||
| I12282-5451 | P | 1089 | L | 12 28 16.2 | -54 51 40 | 299.99 | 7.62 | 85x | 54 | 14.5 | I | 13 | 0.29 | 0.25 | 0.71 | 6.23 | 1 1 3 1 | 0.14 | 8.77 | |||||
| I12295-6803 | Y | I | 1110 | L | 12 29 30.2 | -68 03 38 | 301.17 | -5.53 | 101x | 65 | 14.6 | S | B | 5 | 4 | 0.44 | 0.25 | 0.90 | 3.81 | 1 1 3 1 | 0.14 | 4.23 | ||
| I12369-5454 | I | 1233 | 12 36 56.3 | -54 54 54 | 301.25 | 7.64 | 31x | 20 | 16.9 | S | B | 5 | 9 | 0.41 | 0.25 | 0.60 | 2.72 | 1 1 3 1 | 0.28 | 4.53 | ||||
| I12400-5843 | Y | I | 1291 | 12 40 04.2 | -58 43 38 | 301.84 | 3.85 | 26x | 9 | 17.9 | S | 14 | 0.25 | 0.30 | 2.06 | 6.10 | 1 3 3 3 | 0.02 | 2.96 | |||||
| I12446-5340 | Y | I | 1373 | L | 12 44 41.2 | -53 40 34 | 302.35 | 8.92 | 110x | 78 | 14.1 | I | ? | 25 | 0.28 | 0.25 | 0.78 | 2.04 | 1 1 3 1 | 0.12 | 2.62 | |||
| I12447-5316 | Y | I | 1379 | L | 12 44 46.3 | -53 16 41 | 302.36 | 9.32 | 58x | 46 | 14.8 | E | ? | 5 | 0.26 | 0.26 | 2.38 | 3.99 | 1 2 3 3 | 0.01 | 1.68 | |||
| I12483-5316 | Y | I2 | 1434 | 12 48 21.5 | -53 16 32 | 302.90 | 9.32 | 20x | 7 | 18.0 | L | ? | 20 | 0.41 | 0.25 | 1.33 | 1.75 | 1 1 3 1 | 0.06 | 1.32 | ||||
| I12483-5316 | Y | I2 | 1435 | 12 48 21.7 | -53 16 54 | 302.90 | 9.32 | 19x | 15 | 17.3 | S | 4 | 0.41 | 0.25 | 1.33 | 1.75 | 1 1 3 1 | 0.06 | 1.32 | |||||
| I12547-5307 | Y | I | 1576 | L | 12 54 44.8 | -53 07 19 | 303.87 | 9.47 | 94x | 54 | 15.1 | S | 5 | 5 | 0.25 | 0.25 | 1.10 | 2.75 | 1 1 3 3 | 0.05 | 2.50 | |||
| I12571-5543 | P | 1642 | 12 57 07.9 | -55 43 01 | 304.15 | 6.86 | 34x | 23 | 16.2 | F | 4 | 0.30 | 0.25 | 0.64 | 12.77 | 1 1 3 1 | 0.18 | 19.95 | ||||||
| I12584-7101 | * | I | 1674 | 12 58 24.7 | -71 01 44 | 303.77 | -8.44 | 24x | 12 | 18.1 | S | 26 | 0.30 | 0.25 | 1.05 | 2.09 | 1 1 3 2 | 0.07 | 1.99 | |||||
| I12585-5300 | Y | I | 1680 | 12 58 37.0 | -53 00 19 | 304.47 | 9.57 | 31x | 31 | 16.5 | S | 5 | : | 21 | 0.29 | 0.25 | 0.86 | 1.87 | 1 1 3 1 | 0.10 | 2.17 | |||
| I12588-5349 | Y | I | 1685 | 12 58 50.0 | -53 49 23 | 304.47 | 8.75 | 22x | 16 | 18.0 | S | ? | 13 | 0.25 | 0.41 | 2.36 | 2.70 | 1 3 3 3 | 0.02 | 1.14 | ||||
| I12593-5601 | P | 1694 | L | 12 59 23.0 | -56 01 28 | 304.46 | 6.55 | 78x | 17 | 16.1 | S | 4 | : | 10 | 0.45 | 0.40 | 0.60 | 11.59 | 1 1 3 1 | 0.50 | 19.32 | |||
| I12594-5552 | * | I | 1696 | 12 59 27.0 | -55 52 48 | 304.48 | 6.69 | 78x | 15 | 16.7 | S | 5 | 6 | 0.28 | 0.25 | 0.88 | 3.48 | 1 1 3 3 | 0.09 | 3.95 | ||||
| I12595-5403 | Y | I | 1698 | 12 59 29.3 | -54 03 40 | 304.56 | 8.51 | 17x | 12 | 17.6 | L | 15 | 0.25 | 0.25 | 1.65 | 2.78 | 1 1 3 1 | 0.02 | 1.68 | |||||
| I12597-6547 | P | 1707 | 12 59 44.3 | -65 47 43 | 304.10 | -3.22 | 26x | 11 | 17.5 | S | 4 | 0.25 | 0.45 | 4.07 | 48.19 | 1 3 3 1 | 0.01 | 11.84 | ||||||
| I13003-7151 | Y | I | 1716 | 13 00 21.9 | -71 51 16 | 303.90 | -9.27 | 51x | 16 | 16.9 | S | 3 | 6 | 0.25 | 0.25 | 0.63 | 1.62 | 1 1 3 3 | 0.16 | 2.57 | ||||
| I13005-5231 | I | 1719 | 13 00 33.3 | -52 31 09 | 304.78 | 10.04 | 31x | 12 | 17.3 | S | 2 | 39 | 0.40 | 0.26 | 0.49 | 2.19 | 1 1 3 1 | 0.43 | 4.47 | |||||
| I13009-5608 | Q | 1734 | 13 00 58.0 | -56 08 24 | 304.68 | 6.42 | 28x | 15 | 17.1 | S | M | 2 | 0.42 | 0.25 | 1.00 | 10.27 | 1 1 3 1 | 0.11 | 10.27 | |||||
| I13031-5717 | Y | I2 | 1783 | 13 03 08.6 | -57 17 54 | 304.92 | 5.25 | 19x | 7 | 18.1 | S | 0 | 32 | 0.25 | 0.42 | 2.92 | 5.16 | 1 3 3 3 | 0.01 | 1.77 | ||||
| I13031-5717 | Y | I2 | 1784 | L | 13 03 10.0 | -57 17 20 | 304.92 | 5.26 | 70x | 55 | 14.9 | S | 5 | 32 | 0.25 | 0.42 | 2.92 | 5.16 | 1 3 3 3 | 0.01 | 1.77 | |||
| I13042-5351 | Y | I | 1822 | L | 13 04 18.1 | -53 51 34 | 305.28 | 8.67 | 60x | 30 | 15.9 | S | R | 5 | 9 | 0.36 | 0.25 | 0.68 | 3.17 | 1 1 3 1 | 0.19 | 4.66 | ||
| I13051-5358 | P | 1851 | L | 13 05 12.3 | -53 58 40 | 305.41 | 8.55 | 59x | 42 | 15.4 | S | Y | 5 | 10 | 0.25 | 0.25 | 0.51 | 3.24 | 1 1 3 1 | 0.24 | 6.35 | |||
| I13052-5711 | Y | I | 1853 | 13 05 15.0 | -57 11 31 | 305.21 | 5.34 | 32x | 32 | 16.3 | S | 9 | ? | 5 | 0.25 | 0.44 | 7.82 | 11.73 | 1 3 3 3 | 0.00 | 1.50 | |||
| I13064-5712 | Y | I | 1883 | 13 06 26.2 | -57 12 17 | 305.37 | 5.32 | 32x | 12 | 17.3 | S | 3 | 20 | 0.27 | 0.25 | 0.68 | 3.34 | 1 1 3 1 | 0.15 | 4.91 | ||||
| I13073-5342 | Q | 1906 | 13 07 23.2 | -53 42 17 | 305.75 | 8.80 | 13x | 13 | 18.0 | L | 14 | 0.27 | 0.35 | 0.69 | 8.43 | 1 1 3 1 | 0.20 | 12.22 | ||||||
| I13081-5304 | * | I | 1935 | 13 08 09.7 | -53 04 25 | 305.92 | 9.42 | 27x | 9 | 18.4 | S | L | 8 | 0.25 | 0.28 | 1.88 | 9.10 | 1 2 3 1 | 0.02 | 4.84 | ||||
| I13085-5807 | Q | 1946 | 13 08 34.8 | -58 07 04 | 305.59 | 4.38 | 20x | 8 | 18.4 | S | L | 10 | 0.35 | 0.25 | 0.87 | 22.05 | 1 1 3 1 | 0.12 | 25.34 | |||||
| I13089-6518 | * | I | 1957 | 13 08 57.5 | -65 18 28 | 305.08 | -2.79 | 19x | 13 | 17.6 | 1 | 0.58 | 2.77 | 24.02 | 27.42 | 3 3 3 3 | 0.00 | 1.14 | ||||||
A further 94 galaxies have a likely IRAS counterpart, primarily based on their positional overlap. These galaxies are indicated by a ‘P’ in Column 2. In this sample there are two IRAS PSC sources that have two galaxies belonging to them, indicated by ‘P2’ in Column 2. 72 IRAS PSC sources of this sample have Jy. These galaxies do not comply with the preset colour restriction of (see Fig. 13), but they are all bona fide galaxies.
Finally, there are 77 galaxies for which their association with an IRAS PSC source is questionable, mostly because of their large positional offset to the IRAS sources and sometimes because of their unlikely IRAS colours (see Fig. 13). These galaxies are indicated by a ‘Q’. The average properties of galaxies in each of these samples are listed in Table 4.
From Table 4 it is clear that the IRAS PSC traces a population of large () and bright () galaxies. They are predominantly spiral galaxies (80%). The ‘P’ sample consists of large and bright galaxies, as bright as the certain (I) IRAS PSC galaxies.
| Sample | Separation | |||
|---|---|---|---|---|
| I | 159 | |||
| P | 92 | |||
| Q | 72 |

In Fig. 13 we show a colour-colour diagram ( vs. ) of the galaxies with an IRAS PSC assocations. The galaxies with a certain IRAS PSC counterpart (I) are shown as filled circles, the possible counterparts (P) as open circles and the questionable assocations (Q) as stars. The selection criteria of Yamada et al. (1993) are indicated by the dashed lines. Yamada (1994) already noted that the upper limit in the colour restriction, imposed to limit the contamination by Galactic cirrus, will make the ‘blind’ IRAS search less complete. As we see here, this incompleteness is substantial (37%).
We have obtained redshifts for 35 of the galaxies in the ‘P’ sample (38%) (Woudt 1998) and 77% of them lie in the redshift range 1400 – 5500 km s-1 and are hence important tracers of the large-scale structures in the nearby Universe. The remaining 23% (8 galaxies, all in the GA region) are located beyond 10 000 km s-1. All these galaxies are, however, missed in blind IRAS searches.

7.3 The distribution of the IRAS PSC galaxies
7.3.1 The Crux region
Fig. 14 shows the distribution (in Galactic coordinates) of the galaxies in the Crux region with an IRAS PSC association. The galaxies in the ‘I’ sample are shown as filled circles and the galaxies in the ‘P’ sample as open circles. The majority of the galaxies are located north of the Galactic Plane, in particular the galaxies in the ‘P’ sample; 26 galaxies (out of 29) are located at positive Galactic latitudes and these galaxies are most likely associated with the Norma supercluster (Fairall et al. 1998).
7.3.2 The Great Attractor region
The distribution of the galaxies in the GA region with a certain and probable IRAS counterpart is also shown in Fig. 14. Most of the galaxies are located below the Galactic Plane in an extended region around the Norma cluster. The IRAS PSC galaxies trace the general overdensity of galaxies in the GA region. They do not, however, reveal the rich and nearby Norma cluster in the way our deep optical search has done.
In Fig. 15 we show a comparison of the galaxy distribtion in the optical and in the far infrared around the rich galaxy cluster of Norma. Unlike the centrally condensed overdensity in the optical distribution (left panel of Fig. 15), the IRAS PSC data merely show an extended overdensity (see Fig. 14) with no clear peak around the central part of the Norma cluster (right panel of Fig. 15). This is in line with the expectation that the IRAS data do trace the general large-scale structures, but are insensitive to the elliptical galaxies that reside in rich clusters.

8 Remarks on the Great Attractor
Our deep optical search for partially obscured galaxies in the Crux and Great Attractor region has revealed several overdensities which belong to the Great Attractor. These surveys show that a fair fraction of the mass of the Great Attractor was indeed previously hidden behind the Milky Way. In this section, we will summarise our results of the Great Attractor and discuss the possibility that other rich clusters of galaxies might still be hidden behind the remaining optical Zone of Avoidance ().
8.1 Unveiled structures
Following our galaxy search, the below listed structures unveiled (and recognised) at low Galactic latitude can be associated with the Great Attractor (see also Fig. 16):
-
A broad, extended overdensity north of the Galactic Plane at .
-
The low-mass Centaurus–Crux galaxy cluster at km s-1) (Fairall et al. 1998).
-
The rich and nearby Norma cluster at km s-1) (Kraan-Korteweg et al. 1996; Woudt et al. 1999).
Tentative evidence from the magnitude distribution of the galaxies in the GA region, that the Great Attractor survey region is dominated by a rich cluster at the distance of the Great Attractor (see Fig. 12 and the discussion in Sect. 6.4) is confirmed beyond doubt by our follow-up redshift surveys (Kraan-Korteweg et al. 1996; Woudt et al. 1999). With a velocity dispersion of 896 km s-1, the Norma cluster has a mass of the same order as the Coma cluster. This is confirmed by ROSAT PSPC observations of this cluster (Böhringer et al. 1996). Simulations have furthermore shown that the well-known Coma cluster would appear the same as the Norma cluster if Coma were located behind the Milky Way at the location of the Norma cluster (Woudt 1998).
The Norma cluster is the most massive cluster known to date in the Great Attractor overdensity. Its optical appearance, however, is not very prominent, due to the obscuring effects of the Galactic foreground extinction. It is the most likely candidate to mark the Great Attractor’s hitherto unseen core (Kraan-Korteweg et al. 1996).
8.1.1 The Norma cluster
Irrespective of its position within the Great Attractor overdensity, the Norma cluster is an important cluster in its own right. The cluster is comparable to the Coma cluster, but is located closer (Woudt 1998), i.e., it is the nearest rich cluster in the local Universe. It is X-ray bright (Böhringer et al. 1996), H I deficient (Vollmer et al. 2001), reveals signs of an ongoing merger close to the centre of the cluster (Böhringer et al. 1996; Woudt 1998), harbours an infalling spiral-rich subgroup at a distance of 2–3 Mpc from the centre (Woudt 1998), contains 2 central cD galaxies (like the Coma cluster) and has two strong radio continuum sources, namely PKS1610-608 (the central Wide-Angle-Tail source) and PKS1610-605 (an extended Head-Tail source) (Jones & McAdam 1992). Due to the proximity of the Norma cluster, it is a good laboratory to study the interaction of galaxies in a rich cluster with the Intracluster Medium.
Within the Abell radius of the Norma cluster there are 603 galaxies in our ZOA catalogue. We have obtained redshifts for 266 galaxies, 219 of which are bona fide cluster members. More redshifts were obtained in 2001 with 2dF observations of this cluster. A full dynamical analysis of the Norma cluster will be presented elsewhere (Woudt et al. in prep.). We have furthermore obtained deep -band images with the ESO/MPG 2.2-m telescope (with the Wide Field Imager) covering the entire Abell radius of the Norma cluster. These data will allow a good determination of the luminosity function of this nearby and rich cluster. In combination with recently obtained pointed observations for 50 elliptical galaxies in the Norma cluster, a distance to the Norma cluster can be derived through a Fundamental Plane analysis. The observed colours of the elliptical galaxies in this sample will provide additional information on the Galactic foreground extinction (see discussion in Sect. 5.2).
A reliable distance to the Norma cluster (with an uncertainty of km s-1) is essential in distinguishing between the various existing models of the GA; a nearby GA (Tonry et al. 2000), a more distant GA (Kolatt et al. 1995), or a GA which partakes in a cosmic flow to even larger distances.
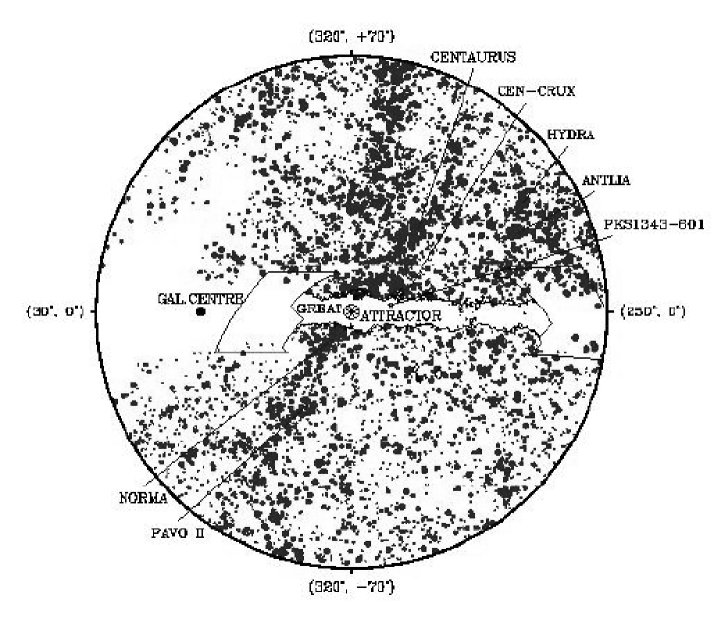
8.1.2 The galaxy distribution
Fig. 16 shows the most complete view of the optical galaxy distribution in the Great Attractor region to date. This equal area projection is centred on the Great Attractor at . All galaxies with extinction-corrected diameters larger than limited by are shown. Galaxies were taken from the Lauberts (1982) catalogue, the Uppsala General Catalogue UGC (Nilson 1973), the Morphological Catalogue of Galaxies MGC (Vorontsov-Velyaminov & Archipova 1963-74), and our Zone of Avoidance Catalogues (Paper I, and this paper). Details on diameter corrections for galaxies in the Lauberts, UGC and MCG catalogues are given by Kraan-Korteweg (2000b).
The resulting galaxy distribution shows a strong concentration of galaxies towards the Galactic Plane on either side of the centre of the Great Attractor. This concentration of galaxies, previously unnoticed (compare with Fig. 1), most likely is part of the Centaurus Wall and the Norma Supercluster (see also Fairall et al. 1998) and hence associated with the Great Attractor. Comparing Fig. 16 with Fig. 1 of Paper I, shows that we have greatly reduced the optical Zone of Avoidance (by more than 50%) and have unveiled a large fraction of the Great Attractor overdensity, previously unseen, but also that the Great Attractor region is not entirely unveiled yet.
The remaining ZOA () is best surveyed at higher wavelengths. This is done already in the near infrared by DENIS (Schröder et al. 1999) and 2MASS (Jarrett et al. 2000), at 21 cm by the Parkes HI ZOA Sky Survey (Juraszek et al. 2000; Henning et al. 2000) and in the X-rays (Böhringer et al. 2000; Ebeling et al. 2000).
8.2 What remains hidden?
One can, for instance, not exclude that another Norma-like cluster has remained hidden behind the reduced optical Zone of Avoidance, i.e., at . The ZOA survey greatly enhanced the optical appearance of the Norma cluster within the extinction interval . At we become increasingly incomplete, however, and at we stop finding galaxies altogether in the optical. Even a rich, nearby cluster cannot be detected by optical surveys at the highest extinction levels.
Rich clusters can, however, be detected through a fair bit of extinction by X-ray surveys (Böhringer et al. 2000, Ebeling et al. 2000) although even these searches are limited by the current survey material. Alternatively, a strong central radio source, such as PKS1610-608 in the Norma cluster, could point to unidentified clusters.
Exactly such a source lies in the deepest layers of the Galactic foreground extinction () at km s-1), right in the Great Attractor overdensity (Kraan-Korteweg & Woudt 1999). We are currently involved in a deep infrared survey () with the 1.4-m Infrared Survey Facility of Nagoya University at the South African Astronomical Observatory, to see if this strong radio-source (PKS1343-601) is the central source of a highly obscured, rich cluster (Nagayama et al. , in prep.). If there is indeed another rich cluster in the Great Attractor region, this would have serious implications for our understanding of the formation of this nearby massive overdensity.
Acknowledgements.
Part of this survey was performed at the Kapteyn Astronomical Institute of the University of Groningen. Their support is greatfully acknowledged. PAW is supported by strategic funds made available by the University of Cape Town. He further acknowledges financial support from the National Research Foundation. RCKK thanks CONACyT for their support (research grant 27602E). The authors acknowledge the Referee, Dr. R. Peletier, for the useful comments and suggestions. This research has made use of the NASA/IPAC Extragalactic Database (NED), which is operated by the Jet Propulsion Laboratory, Caltech, under contract with the National Aeronautics and Space Administration.References
- (1)
- (2) Abell, G.O., Corwin, H.G., & Olowin, R.P. 1989, ApJS 70, 1
- (3) Alonso, M.V., da Costa, L.N., Pellegrini, P.S., et al. 1993, AJ 106, 676
- (4) Andernach, H. 1991, in Large-Scale Structures and Peculiar Motions in the Universe, eds. D.W. Latham & L.A.N. da Costa, ASP Conf. Ser. 15, 279
- (5) Arp, H.C., & Madore, B.F. 1987, A Catalogue of Southern Peculiar Galaxies and Associations, Cambridge University Press, Cambridge
- (6) Bender, R., Burstein, D., & Faber, S.M. 1993, ApJ 411, 153
- (7) Böhringer, H., Neumann, D.M., Schindler, S., et al. 1996, ApJ 467, 168
- (8) Böhringer, H., Schuecker, P., Komossa, S., et al. 2000, in Mapping the Hidden Universe: the Universe behind the Milky Way – the Universe in HI, eds. R.C. Kraan-Korteweg, P.A. Henning & H. Andernach, ASP Conf. Ser. 218, 93
- (9) Burstein, D., & Heiles, C. 1978, ApJ 225, 40
- (10) Burstein, D., & Heiles, C. 1982, AJ 87, 1165
- (11) Burstein, D., Davies, R.L., Dressler, A., et al. 1987, ApJS 64, 601
- (12) Buta, R. 1995, ApJS 96, 39
- (13) Cameron, L.M. 1990, A&A 233, 16
- (14) Cardelli, J.A., Clayton, G.C., & Mathis, J.S. 1989, ApJ 345, 245
- (15) Corwin, H.G., de Vaucouleurs, A., & de Vaucouleurs, G. 1985, Southern Galaxy Catalogue, Univ. Texas Monographs in Astron. No. 4, Austin: Univ. of Texas
- (16) Dame, T.M., Ungerechts, H., Cohen, R.S., et al. 1987, ApJ 322, 706
- (17) de Vaucouleurs, G., de Vaucouleurs, A., & Corwin, H.G. 1976, 2nd Reference Catalogue of Bright Galaxies (RC2). University of Texas Press, Austin
- (18) Dressler, A., Faber, S.M., Burstein, D., et al. 1987, ApJ 313, 37
- (19) Ebeling, H., Mullis, C.R., & Tully, R.B. 2000, in Mapping the Hidden Universe: the Universe behind the Milky Way – the Universe in HI, eds. R.C. Kraan-Korteweg, P.A. Henning & H. Andernach, ASP Conf. Ser. 218, 79
- (20) Fairall, A.P., Woudt, P.A., & Kraan-Korteweg, R.C. 1998, A&AS 127, 463
- (21) Feitzinger, J.V., & Stüwe, J.A. 1984, A&AS 58, 365
- (22) Godwin, J.G., Metcalfe, N., & Peach, J.V. 1983, MNRAS 202, 113
- (23) Griffith, M.R., & Wright, A.E. 1993, AJ 105, 1666
- (24) Henning, P.A., Staveley-Smith, L., Ekers, R.D., et al. 2000, AJ 119, 2686
- (25) Hudson, M.J., & Lynden-Bell, D. 1991, MNRAS 252, 219
- (26) Jarrett, T.-H., Chester, T., Cutri, R., et al. 2000, AJ 120, 298
- (27) Joint IRAS Science Working Group 1988, IRAS Point Source Catalog, Version 2, Washington: US Govt. Printing Office, IRAS PSC
- (28) Jones, P.A., & McAdam, W.B. 1992, ApJS 80, 137
- (29) Juraszek, S.J., Staveley-Smith, L., Kraan-Korteweg, R.C., et al. 2000, AJ 119, 1627
- (30) Karenchentsev, I.D., Karachentseva, V.E., & Parnovsky, S.L. 1993, AN 314, 97
- (31) Kolatt, T., Dekel, A., & Lahav, O. 1995, MNRAS 275, 797
- (32) Kraan-Korteweg, R.C. 2000a, A&AS 141, 123 (Paper I)
- (33) Kraan-Korteweg, R.C. 2000b, in Mapping the Hidden Universe: the Universe behind the Milky Way – the Universe in HI, eds. R.C. Kraan-Korteweg, P.A. Henning & H. Andernach, ASP Conf. Ser. 218, 19
- (34) Kraan-Korteweg, R.C., & Lahav, O. 2000, A&ARv 10, 211
- (35) Kraan-Korteweg, R.C., & Woudt, P.A. 1999, PASA 16, 53
- (36) Kraan-Korteweg, R.C., Fairall, A.P., & Balkowski, C. 1995, A&A 297, 617
- (37) Kraan-Korteweg, R.C., Woudt, P.A., Cayatte, V., et al. 1996, Nature 379, 519
- (38) Lauberts, A. 1982, The ESO/Uppsala Survey of the ESO (B) Atlas, ESO: Garching
- (39) Lauberts, A., & Valentijn, E.A. 1989, The Surface Photometry Catalogue of the ESO-Uppsala Galaxies, ESO: Garching
- (40) Lynden-Bell, D., Faber, S.M., Burstein, D., et al. 1988, ApJ 326, 19
- (41) McCall, M.L., & Armour M.-H. 2000, in Mapping the Hidden Universe: the Universe behind the Milky Way – the Universe in HI, eds. R.C. Kraan-Korteweg, P.A. Henning & H. Andernach, ASP Conf. Ser. 218, 1
- (42) McHardy, I.M., Lawrence, A., Pye, J.P., et al. 1981, MNRAS 197, 893
- (43) Nilson, P. 1973, Uppsala General Catalogue of Galaxies, Uppsala: University of Uppsala
- (44) Peletier, R.,F., Valentijn, E.A., Moorwood, A.F.M., et al. 1994, A&AS 108, 621
- (45) Saunders, W., D’Mellow, K.J., Valentine, H., et al. 2000, in Mapping the Hidden Universe: the Universe behind the Milky Way – the Universe in HI, eds. R.C. Kraan-Korteweg, P.A. Henning & H. Andernach, ASP Conf. Ser. 218, 141
- (46) Schlegel, D.J., Finkbeiner, D.P., & Davis, M. 1998, ApJ 500, 525
- (47) Schröder, A., Kraan-Korteweg, R.C., & Mamon, G.A. 1999, PASA 16, 42
- (48) Staveley-Smith, L., Juraszek, S., Henning, P.A., et al. 2000, in Mapping the Hidden Universe: the Universe behind the Milky Way – the Universe in HI, eds. R.C. Kraan-Korteweg, P.A. Henning & H. Andernach, ASP Conf. Ser. 218, 207
- (49) Strauss, M.A., & Willick, J.A. 1995, Phys. Rep. 261, 271
- (50) Tonry, J.L, Blakeslee, J.P., Ajhar, E.A., et al. 2000, ApJ 530, 625
- (51) Visvanathan, N., & Van den Bergh, S. 1992, AJ 103, 1057
- (52) Vollmer, B., Cayatte, V., van Driel, W., et al. 2001, A&A 369, 432
- (53) Vorontsov-Velyaminov, B., & Archipova, V. 1963-74, Morphological Catalogue of Galaxies, Parts 2–5, Moscow: Moscow University
- (54) Woudt, P.A. 1998, Ph.D. Thesis, University of Cape Town
- (55) Woudt, P.A., Kraan-Korteweg, R.C., & Fairall, A.P. 1999, A&A 352, 39
- (56) Yahil, A., Strauss, M.A., Davis, M. et al. 1991, ApJ 372, 380
- (57) Yamada, T., Takata, T., Djamaluddin, T., et al. 1993, ApJS 89, 57
- (58) Yamada, T. 1994, in Unveiling Large-Scale Structures behind the Milky Way, eds. C. Balkowski & R.C. Kraan-Korteweg, ASP Conf. Ser. 67, 269
- (59)