Optical Counterparts for 70,000 Radio Sources: APM Identifications for the FIRST Radio Survey
Abstract
We describe a program to identify optical counterparts to radio sources from the VLA FIRST survey using the Cambridge APM scans of the POSS-I plates. We use radio observations covering 4150 deg2 of the north Galactic cap to a 20 cm flux density threshold of 1.0 mJy; the 382,892 sources detected all have positional uncertainties of (radius of 90% confidence). Our description of the APM catalog, derived from the 148 POSS-I and plates covering this region, includes an assessment of its astrometric and photometric accuracy, a photometric recalibration using the Minnesota APS catalog, a discussion of the classification algorithm, and quantitative tests of the catalog’s reliability and completeness. We go on to show how the use of FIRST sources as astrometric standards allows us to improve the absolute astrometry of the POSS plates by nearly an order of magnitude to rms. Matching the radio and optical catalogs yields counterparts for over 70,000 radio sources; we include detailed discussions of the reliability and completeness of these identifications as a function of optical and radio morphology, optical magnitude and color, and radio flux density. An analysis of the problem of radio sources with complex morphologies (e.g., double-lobed radio galaxies) is included. We conclude with a brief discussion of the source classes represented among the radio sources with identified counterparts.
1 Introduction
The optical identification of the first discrete extraterrestrial radio source occurred as a result of a telephone call from J. S. Hey to the Royal Greenwich Observatory on the afternoon of February 28, 1942. Recognizing that the source of extensive jamming of British radar over the previous two days appeared to follow the Sun, Hey was delighted to learn that an unusually large sunspot had just transited the solar disk; despite its skeptical reception by his superiors, Hey’s identification proved correct (Hey 1973).
In the ensuing decade, progress in the detection of new extrasolar radio emitters far outstripped the ability of astronomers to associate them with optical counterparts. The first breakthrough came in 1949 when Bolton, Stanley and Slee (1949) identified the Crab Nebula, M87, and NGC 5128 (Cen A) with three of the brightest radio sources in the sky, although they concluded that the bizarre morphology of the latter generally favored a Galactic interpretation for radio emitters since “the probability of [such] an unusual object in our own Galaxy seems greater than a large accumulation of such objects at a great distance.” The following year, Ryle, Smith, and Elsmore (1950) concurred in this conclusion despite finding 0/146 bright (4.0) stars, 0/21 novae, 0/38 planetary nebulae, 0/29 diffuse Galactic nebulae, and 4/5 of the brightest galaxies coincident with entries in their fifty-source radio catalog. It was not until the classic papers of Baade & Minkowski (1954a,b), which among other things pronounced Cygnus A “an extragalactic affair”, that the era of extragalactic radio source identification can be said to have begun.
The largest radio catalogs in existence prior to 1995 contained, in total, approximately 100,000 distinct entries. In striking contrast to the earliest speculations, fewer than 20 of these relatively bright radio sources are identified as stars. Indeed, fewer than 1000 stellar radio detections have been made despite decades of sensitive, targeted searches (Hjellming 1988 and references therein; Wendker 1995), and of all cataloged radio sources are Galactic objects. A search of the NED database, however, suggests that the fraction of identified extragalactic radio emitters today is little better than it was in 1950, when 7 out of 67 known radio sources had identified counterparts (Baade and Minkowski 1954b). The problem now is the same as it was 50 years ago: the angular resolution of large-area radio surveys is generally too poor (several arcminutes) to allow for the unambiguous association of cataloged objects with individual optical counterparts which, at the limit of the POSS-I plates, number 4000 deg-2 at high Galactic latitudes. Interferometric surveys at centimeter wavelengths can achieve the desired positional accuracy of but have, until recently, covered only deg2 of sky, resulting in fewer than 500 optical identifications for radio-selected objects at faint flux levels (see Table 5).
While considerable information on the class and emission mechanism of a radio source can be derived from observations of its radio morphology, its spectrum, and its polarization characteristics, optical observations are still required to establish the source’s distance and to classify it unambiguously. Eight years ago, we began to construct Faint Images of the Radio Sky at Twenty-cm (FIRST) with the primary goal of obtaining a very large sample of radio sources with positions sufficiently accurate that the majority of objects detected could be easily identified on the basis of positional coincidence alone. FIRST has been designed to cover the same 10,000 deg2 region as the Sloan Digital Sky Survey (SDSS), which will obtain deep optical images of the northern sky in five colors, and will take spectra of a million objects over the next decade (Gunn and Knapp 1993). However, an archive of the optical sky in the form of the National Geographic-Palomar Observatory Sky Survey (POSS) plates already exists. The identification of even 20% of all FIRST sources with counterparts at or above the POSS plate limit will immediately provide samples of various radio source populations from one to three orders of magnitude larger than those in existence, and will advance significantly our knowledge of the radio universe.
In this paper, we present the results of an optical identification program for FIRST radio sources based on the Cambridge Automated Plate Measuring Machine (APM) scans of the POSS I plates (McMahon and Irwin 1992). In §2, we describe briefly the parameters of the FIRST survey and the catalog derived therefrom. In §3, we describe the genesis of the APM catalog and discuss its astrometric, photometric, and source classification uncertainties with particular attention to those which either 1) the FIRST results can help to refine, or 2) are particularly relevant to radio source identification; the following section (§4) demonstrates the utility of FIRST as an astrometric calibrator by deriving both intraplate and plate-to-plate corrections to the optical astrometric solution. Section 5 describes the matching algorithms employed and discusses such issues as false match rates, reliability and completeness of the proposed identifications, and the effects of optical and radio source morphology. Section 6 discusses color, magnitude, and radio flux density distributions for the more than 70,000 counterparts we have identified, while the following section (§7) describes the format of the counterpart catalog (the full contents of which are available on the Web). In the discussion (§8), we place in context this identification program for faint radio sources, and summarize the statistics of the populations represented. A reprise of our results and a precis of future work concludes our report (§9).
2 The FIRST Survey
In its initial five years, the FIRST project surveyed 4670 deg2 of the high Galactic latitude sky to a point-source flux density limit of 1.0 mJy at a wavelength of 20 cm. Using the B-configuration of the Very Large Array (VLA111The National Radio Astronomy Observatory is operated by Associated Universities, Inc., under cooperative agreement with the National Science Foundation.) in bandwidth-synthesis mode, we have produced nearly uniform-sensitivity images of the sky with a median rms of 0.14 mJy and an angular resolution of 5″; the positions for each of the half million sources in our current catalog are accurate to better than 1″ (90% confidence). Details of the observing strategy and the pipeline processing system that creates the final images from the raw uv data are presented in Becker, White, and Helfand (1995; hereafter, BWH).
For the program described here, we have utilized the 98Feb04 version of the FIRST catalog, which is available from our Web homepage (http://sundog.stsci.edu). The catalog contains positions, peak and integrated flux densities, source morphological parameters, and information on the field from which each entry was derived. A detailed description of the catalog’s construction can be found in White et al. (1997; hereafter WBHG); an exhaustive discussion of the astrometric, photometric, and morphological uncertainties is included in that paper and in BWH, and is summarized on our Web homepage.
The catalog has a mean surface density of 90 “sources” per square degree. However, it is important to note that a significant fraction of radio sources at these flux densities are extended. In particular, classical double-lobed radio sources in which the components are separated by more than 3″ are typically represented by two catalog entries; for complex sources extended on scales of 1′, several components can be required to fit adequately the source surface brightness distribution (see WBHG). We have not yet completed a definitive study of multi-component sources; even when this is done, it will not be possible to decide unambiguously whether or not two nearby catalog entries are parts of the same source hosted by a single optical counterpart, or whether they are chance alignments of unrelated objects. We briefly investigate these issues in §5.4; prior to that discussion, we use the term “sources” synonymously with “radio catalog entries”.
For clarity, we present in this paper only the results of the APM identification program for the 4150 deg2 in the north Galactic cap. This region has approximate boundaries of and and includes 382,892 radio sources. Subsequent extensions to this work for the two southern cap strips ( and in the range for a total of 610 deg2) as well as the remainder of the north cap region will be added to the Web site as they become available.
3 The APM Catalog
3.1 Introduction
It has been almost 50 years since the National Geographic Society-Palomar Observatory Sky Survey (POSS) was carried out (1949 to 1958) using the Oschin Schmidt at Palomar Observatory (Harrington 1952; Minkowski and Abell 1963; Lund and Dixon 1973). Since a second-epoch Palomar Survey is underway, the original POSS is now usually referred to as the first-epoch POSS or POSS-I to differentiate it from POSS-II (Reid et al. 1991). The survey covers the 31,000 deg2 of sky north of with 6.46.4 degree plates in two colors: blue (), centered at Å covering the range between 4900 Å and the atmospheric cutoff at 3300, and red (), a 600 Å wide band centered at 6500 Å. Plots of the POSS-I bandpasses compared with the standard Johnson photometric system can be seen in Evans (1989). The nearest Johnson system bands to O and E are B and R respectively. We provide color equations for these bands in section 3.3.
Between 1991 and 1995, the SERC Automated Plate Measuring Machine (APM) at the Institute for Astronomy, Cambridge (Kibblewhite et al. 1984) was used to digitize these plates at a resolution of 7.5 microns per pixel (0.5″), the highest spatial resolution yet applied to these images (McMahon and Irwin 1992). An object catalog has been constructed from these data which includes all objects down to the plate limits — 20.0 in and 21.5 in — and contains approximately 2000 stars and 2000 galaxies deg-2 at high Galactic latitudes. The catalog contains positions, magnitudes, morphological classification parameters, major and minor axes, and isophotal areas for each source; a merged catalog which matches objects between plates also contains a color (or an upper limit thereto) for each entry. An automated classification algorithm interprets the morphological parameters to classify each object. Here, we present the basic procedures which establish the astrometric and photometric calibration of the APM catalog, and discuss the limits of the image classification system.
3.2 APM Astrometry
The APM machine measures the and positions of all objects detected. The conversion relationship between these measured APM positions and celestial coordinates is derived by matching stars in the Tycho-ACT catalog (Hog et al. 1997; Urban, Corbin & Wycoff 1998) with stars detected on each plate using a ‘standard’ six plate-constant model that allows for shift, rotation, scale, and shear. The algorithm uses iterative clipping to give a robust fit; the typical rms on the fitted positions of the Tycho stars are –.
Irwin (1994) has studied the two-dimensional systematic errors in an earlier version of the APM catalog positions by investigating the intraplate residuals between the measured positions for bright stars in the Positions and Proper Motions Catalog (Roser and Bastian 1991) and the astrometric fit. He found significant, systematic residuals ranging up to . In the version of the APM catalogue used herein, the astrometric analysis uses the more recent ACT catalog (Urban, Corbin & Wycoff 1998).
A residual map generated from this analysis is applied to positions in the standard APM catalog available at http://www.ast.cam.ac.uk/{̃}apmcat. We discuss below (§4) the significant improvement in overall astrometric accuracy that can be derived from a comparison of radio source counterparts in the APM with FIRST survey source positions.
3.3 APM Photometry
The APM measures photographic density rather than flux; moreover, the central regions of all objects more than a factor of 10 brighter than the sky produce a nonlinear response and/or are saturated. The algorithms used to overcome these inherent difficulties are discussed in detail by Irwin (1985). Briefly, a local background is determined for each of 500000 locations on each plate by producing a histogram of the pixel values in 64 64-pixel regions () and finding the mode of each distribution; two-dimensional smoothing is applied to these half million background estimates to derive a background model for the plate. The image detection algorithm then finds connected regions of pixels above a threshold level (typically above the estimated background level for the given plate position). This background-following technique has the advantage that faint objects lying in the halos of bright objects can be detected. However, large objects such as bright stars and galaxies with angular extents have their raw fluxes underestimated. An additional problem for large images is that the limited memory available to the software means that bright objects sometimes overflow the pixel buffers and are lost. This occurs for images with sizes greater than roughly 1–2 mm (i.e., 1–), corresponding to stellar magnitudes brighter than .
Another inherent problem arises in attempting to derive magnitude estimates for extended objects from saturated images. Saturation effects can be corrected for in stars by assuming that stellar images have an intrinsic density profile independent of magnitude, and that this profile can be derived from the unsaturated parts of stellar profiles. A high signal-to-noise intrinsic profile is constructed by taking the core from faint stars and the wings from brighter stars (see Bunclark & Irwin (1983) for further details). This profile can then be integrated and used to derive a calibration curve to convert saturated stellar magnitudes to a linear system. In the APM catalog, this calibration is applied to all images. This has the unfortunate consequence that galaxies, which have shallower surface brightness profiles and lower central surface brightnesses than stars of the same total magnitude, will have their magnitudes over-corrected. This is a fundamental problem for galaxy photometry determined from photographic sky survey plates (see Metcalfe, Fong, and Shanks (1995) for a discussion).
The basic APM catalog is defined to have a red-band () plate limit of . This limit was established during the early stages (1991) of the creation of the APM catalog via comparison with 10 photometric sequences (Evans 1989; Humphreys et al. 1991). Similarly, a single slope of 1.10, was assumed in converting between the linearized APM magnitudes (Bunclark & Irwin 1983) and the Lyrae-based Johnson magnitude system. It was noted at the time that there were significant deviations (1 mag) from a simple linear relation at magnitudes brighter than 15. This is not surprising bearing in mind that the POSS-I glass plates measured by the APM are copies that may have different degrees of saturation and have had their contrast stretched to enhance faint features. The assumption of a constant flux limit seemed reasonable, since the plates were all taken in similar dark sky observing conditions with exposure times that were adjusted to ensure uniform sensitivity. A similar assumption is made in all modern photographic cameras where it is assumed that all photographic film has the specified speed. The blue band () limit was defined with respect to the red limit; for the 428 fields available in March 1999, this has a range of )=20.6–21.3 (1).
Eventually, a full photometric recalibration of the APM using the Guide Star Photometric Catalog (GSPC – Postman et al. 1998a) CCD sequences is planned. Preliminary comparisons with CCD photometry for % of the POSS-I plates show that the APM magnitudes for stellar objects have a global rms uncertainty of 0.5 magnitudes over the range 16 to 20, the range in which most FIRST counterparts lie. As discussed above, the uncertainties in the magnitudes of galaxies are more complex, since galaxies have a range of surface brightness distributions, and hence may have complex, partially saturated surface brightness profiles on the POSS-I plates. This is compounded by the range in calibration slopes observed. At faint magnitudes (18–20) where the image profiles are unsaturated, the APM magnitudes may be more reliable, but it is left to the reader to verify this where precise magnitudes are required. For many programs, a uniform set of magnitudes or uniform selection criteria are more critical.
It is also worth noting that almost 50 years has elapsed between the epochs of the POSS-I and FIRST surveys, so that optical variability is an additional uncertainty. Hook et al. (1994) have studied the long term variability of radio quiet quasars and found that over a rest-frame period of 10 years, a typical quasar varies by 0.20 magnitudes (rms). The longer-term variability of FIRST optical counterparts could be studied via a comparison between the POSS-I plates and the POSS-II or UKST plates. A CCD investigation of the long-term variability of quasars from the FIRST Bright Quasar Survey (White et al. 2000) is reported elsewhere (Helfand et al. 2001).
It is useful to be able to convert the magnitudes of the O and E bands to the nearest bands in the Johnson Vega-normalised magnitude system. Evans (1989) has found that over the color range 0.0 BR 1.5,
| (1) |
Thus one can assume;
| (2) |
Evans (1989) also found
| (3) |
Thus we have;
| (4) |
Finally it follows from (1) and (3) that:
| (5) |
Assuming central wavelengths of 4100Å and 6500Å and the Hayes and Latham (1975) calibration of Vega the monochromatic zero point of the O and E bands, i.e., the flux corresponding to a magnitude of zero, is 4550 Jy and 2980 Jy respectively. Caution is advised when using these conversions since the presence of emission lines in the O and E filters will effect the conversion.
3.4 Photometric Calibration Using APS
In an attempt to improve the APM photometric accuracy and uniformity, the APM magnitudes in regions covered by the FIRST survey were recalibrated plate-by-plate using magnitudes from the Minnesota Automated Plate Scanner POSS-I catalog (APS222The APS databases are supported by the National Science Foundation, the National Aeronautics and Space Administration, and the University of Minnesota, and are available at http://aps.umn.edu/., Pennington et al. 1993) which are more uniform than the APM magnitudes because they were calibrated on a plate-by-plate basis. The APS catalog was created by scanning the same POSS-I plate material as the APM and so should be fully consistent with the APM since it has the same bandpasses, epoch, and so on.
An alternative approach would have been simply to use the APS catalog in place of the APM catalog to get optical counterparts for the FIRST sources. We preferred the APM catalog because the APS catalog is not complete over the POSS-I area and does not cover the southern sky at all, and because the APS catalog retains only sources that appear on both the red and blue plates, discarding a significant fraction (40%) of the faint radio source counterparts near the plate limits. Analysis of the reliability of these single band detections is discussed in section 5.2 and shows that 92.7% of the blue-only matches within 1” are real, and 97.5% of the red-only matches within 1” are real matches.
We matched the entire FIRST catalog against the APS catalog, extracting all objects within of each radio position, and then matched the resulting list of optical sources with the equivalent APM/FIRST match list. For each APM plate, we determined independent linear fits (zero-point and slope) for and that transform the APM magnitudes to the APS scale. The fit was based on APM/APS matches closer than that are classified as stellar by the APS (which uses a different photometry method for non-stellar objects.)
For 8 of the 148 POSS-I plates covering the FIRST area, there were insufficient APS sources available to determine the photometric calibration because the corresponding plate was unavailable in the APS catalog. For those plates, we bootstrapped a photometric solution using APM sources in the overlapping regions of neighboring plates. The set of zero-points and slopes for all 148 plates is available on the FIRST website.
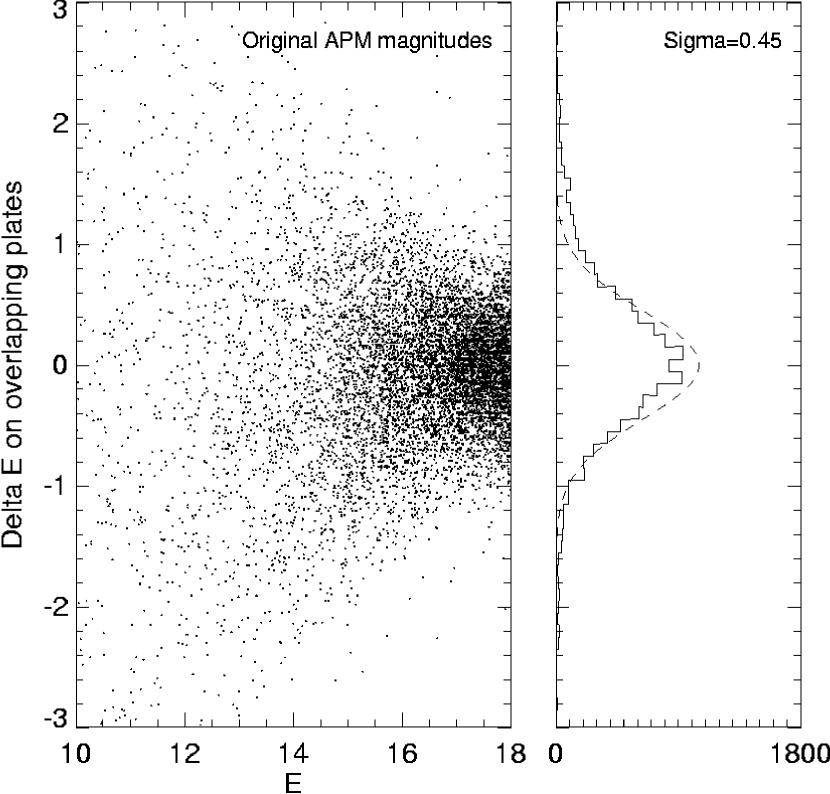
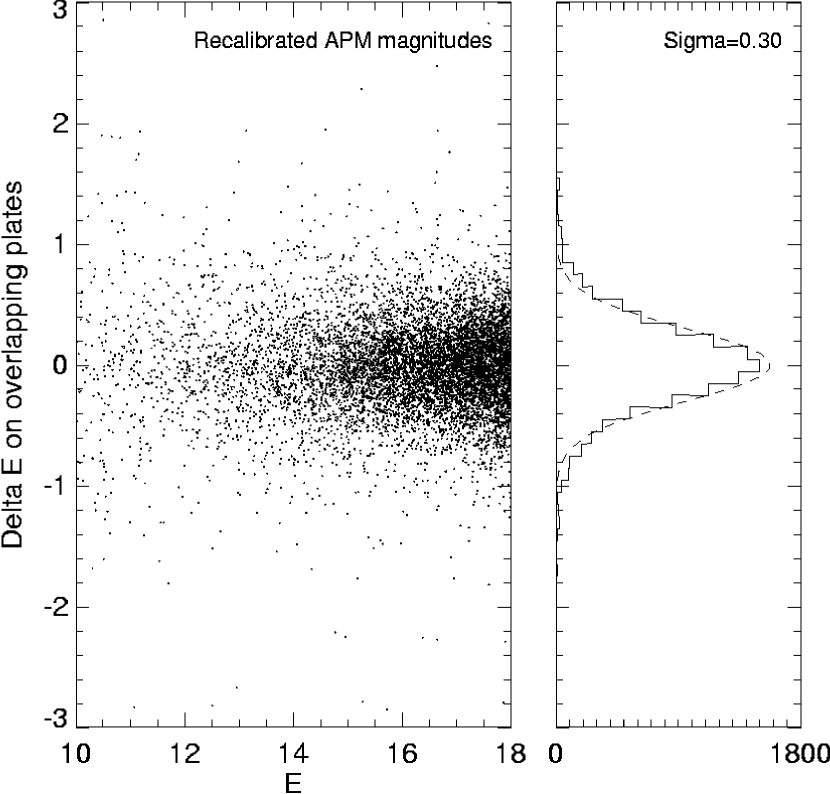
This calibration procedure substantially improves the APM photometry. This is clearly seen in the magnitude discrepancies for APM objects in the plate overlap regions, which provide two or more independent magnitude measurements per object. Figure 1 shows the distribution of APM magnitude differences before and after calibration; the rms scatter decreases from 0.45 to 0.30 magnitudes, and the scatter for bright sources is reduced by an even larger factor. Since the plate overlap regions lie at the extreme edges of the POSS-I plates, they are probably the worst-calibrated areas on the plates; consequently, we estimate that the recalibrated APM magnitudes are accurate to better than 0.2 magnitudes rms.
Figure 2 shows that the principal problem with the APM magnitudes is a magnitude-dependent error. We display the differences between the mean calibrated and magnitudes and the original APM magnitudes as a function of magnitude. Both colors display a quasi-linear trend, with the total error varying by magnitudes over an eight-magnitude span. While these curves have been derived from a small subset of all APM scans, it is likely that application of the corrections they imply will improve significantly the photometric accuracy of the catalog.


3.5 APM Classification
The APM scans result in a parameterization of each detected image which includes an position, a peak intensity, a total isophotal intensity, second moments of the intensity distribution, and areal profiles (defined as the number of pixels above preset levels which increase by powers of two above the threshold level). In addition, a classification parameter is calculated which reports by how many sigma the object differs from the stellar point-spread function on each plate. The stellar psf is derived as a function of magnitude to take into account saturation effects.
These parameters are then used to classify all images into one of four categories: stellar (consistent with the magnitude- and position-dependent point spread function, cl), non-stellar (a measurably extended source, cl=1), merged objects (sources with two local maxima within a single set of connected above-threshold pixels, cl=2), and noise (objects with nonphysical morphologies, cl=0).
For further details of the principles involved, see Maddox et al. (1991a,b). Very bright images can often be misclassified, since the limited set of parameters does not provide an adequate description and the background-following algorithm attempts to track over them in order to detect the faint images in the source halos. The merged/non-stellar boundary is not as reliable as the stellar/non-stellar boundary, so merged stars are often found in the non-stellar list (with a smaller number of galaxies in the merged list). Some objects classified as noise are real; objects found on both plates are the obvious examples. Objects classified as noise which match FIRST sources are also likely to be real, and we do not generally exclude these from our analysis.
Bright objects (e.g., ) cover a large number of pixels in the APM scans and, as a consequence, magnitude and source-size estimates are very sensitive to small uncertainties in the plate sky level and details of the background-following algorithm; as a result, large uncertainties in the parameter estimations can result, and very bright sources can even be completely missing from the catalog. In addition, bright galaxies with complex surface brightness distributions can be broken up into a swarm of discrete sources. At fainter magnitudes, the limitations of the plate material make reliable separation of stellar and non-stellar sources problematic. Since our goal here is to determine the completeness and reliability for the catalog of radio source counterparts, we do not attempt a comprehensive analysis of the APM catalog’s classification accuracy. Instead we perform several straightforward comparisons with existing catalogs of bright stars and bright galaxies and with CCD images which serve to characterize the APM completeness and reliability with respect to FIRST identifications.
3.6 APM Reliability at Bright Magnitudes
3.6.1 Galaxies
We have examined the DSS images, APM - and -plate catalogs, and FIRST images in the vicinity of 1000 entries in the UGC galaxy compilation (Nilson 1973). The UGC purports to be an angular-size limited sample for objects with blue diameters ; it is complete for , but includes entries down to . This provides a direct measure of the completeness of our identification of FIRST sources with bright galaxies and the accuracy with which the galaxy parameters are reported in the APM catalog.
Of the 1000 UGC catalog entries, seven were found to have no galaxy brighter than within on the DSS. Another dozen entries had only very small-diameter objects () in the vicinity, while three were extended, but very low surface brightness objects. Finally, in seventeen cases, there were two (and in one case three) galaxies of comparable brightness within 1–2′ of the UGC position, and it was not possible without further investigation to distinguish which was the cataloged object.
In only 1 of the 1000 cases was no object present in the APM catalog, and that case corresponded to one of the extremely low-surface brightness galaxies; in virtually all cases, in fact, the UGC galaxy was detected on both plates. Over 275 of the 1000 UGC galaxies are detected in the FIRST catalog, and all of these correspond to objects in the APM source list. Thus, bright galaxies missing from the APM catalog are not a source of incompleteness in identifying FIRST counterparts.
Classifications, colors, and magnitudes for bright APM galaxies are, however, more problematic. First, for the reasons discussed above, colors and magnitudes for bright galaxies are at best estimates, and can be grossly in error for the brightest objects (; see §3.3). Second, of the 1000 UGC galaxies, 28 were classified as stellar on both plates; 26 were listed as stellar on the blue plate while correctly classified on the red, while 82 were classified as stellar on the red plate, but correctly identified as extended on the blue plate. Among the FIRST-detected galaxies, stellar misclassifications had a higher frequency by a factor of 2 to 3 ( 20% in total), presumably because many of these radio detections represent galaxies with a bright active (stellar) nucleus.
For galaxies, entries appear in both the and catalogs, but their centroids are sufficiently far apart that they are not identified as the same object, and so remain listed as separate objects (without measured colors) in the merged catalog. These are slightly over-represented among the radio detections, most likely as a result of the high radio-detected fraction of interacting/merging galaxies whose complicated surface brightness profiles confuse the source-finding algorithm. Finally, somewhat less than 4% of the UGC galaxies have size and shape parameters significantly discrepant from the images, either as a consequence of including a nearby star in the profile, breaking up a large galaxy into many components, or some other such error; these are also more common (6%) among the radio detections owing to the high fraction of interacting systems FIRST detects.
In summary, then, the APM catalog is % complete for bright galaxies in the sense that it contains at least one entry at the galaxy location, and in of the cases, the object is classified as a galaxy on at least one of the two plates. The descriptions of the magnitudes, shapes, and colors of the optical objects, however, are subject to large errors, and should be checked by examination of the DSS and/or other catalog resources such as NED before they are used for purposes other than simple identifications.
3.6.2 Stars
As noted in the Introduction, the number of stars detected at centimeter wavelengths is small, and the number of quasars brighter than is even smaller. Thus, the completeness of the APM for bright stellar objects is not a major issue in the identification of FIRST counterparts. Nonetheless, for the record, we briefly comment on APM reliability and completeness for bright stellar objects.
Helfand et al. (1999) report on the detection of 21 radio stars in the FIRST region under discussion here with magnitudes in the range . All but the three brightest objects () are recorded in the APM catalog, and more than half are classified as stellar on at least one plate. Since most true stellar identifications with radio sources are impossible without proper motion information, however, and the number of extragalactic bright stellar counterparts is vanishing small, any incompleteness at bright magnitudes for stellar objects in the APM catalog is largely irrelevant to FIRST source identification.
3.7 APM Reliability at Fainter Magnitudes
In order to assess the completeness and reliability of the APM counterparts list in the magnitude range , we use statistics from work in progress to identify FIRST sources in the 16 deg2 deep I-band imaging survey () of Postman et al. (1998b; see Helfand et al. 1998 for a preliminary report on this FIRST identification program).
A total of 345 counterparts to FIRST sources discovered in the I-band CCD data were selected for comparison with the APM catalog; this included all 323 objects with and the additional 22 stellar objects with . All 123 objects with were detected on both plates and over 90% (75%) are correctly classified on the () plates. Over 93% of the 87 objects with were also detected on both plates, although the classifier performs somewhat less well, with 63% correctly classified on the plate. For , more than 40% of the -band objects are still detected on the and/or plates, of which half are correctly classified on the plate. This near to the plate limit, it is clearly difficult to distinguish between stellar and extended objects; nonetheless, only one of the 27 spectroscopically identified quasars with in this -band field is misclassified as non-stellar on both plates. Similarly, we have found that fewer than 5% of the non-Seyfert quasi-stellar objects in the Veron-Cetty and Veron (1998) catalog with are mistakenly classified as galaxies on both plates (Gregg et al. 1996).
Using an APM magnitude-limited sample at , we find that 62% of galaxies are classified correctly on both plates. An additional 28% are classified correctly on the plate and are at or below the plate limit on the plate, while another 4% are classified correctly in and incorrectly in ; only 6.5% are misclassified on both plates. For stellar images, the score is similar, with 14/26 correct on both plates and another seven classified correctly on one plate. In summary, for , 92% of all objects are classified correctly on at least one plate.
As a further check on the incompleteness of the APM catalog, we have compared a subset of the database with the APS catalog of the POSS-I (Pennington et al. 1993). The APS catalog contains only objects detected on both plates, so it does not include the faintest APM objects which are often detected on only a single plate. This is nonetheless a very useful test of completeness and accuracy for the APM catalog, since the APS started with the same plate material but used completely independent scanning hardware and processing software.
The APS catalog test set contains 61,000 unique objects that match 71,000 different APM objects within a matching radius of 10″; the objects were drawn from areas on the plates within of FIRST sources, and thus include both real radio source identifications and random background sources. There are 532 APS objects (0.9%) that have no matching APM source. Most of these are very near the catalog limit: 364 have or , leaving only 168 (0.3%) that are reasonably bright. Checking the Digitized Sky Survey reveals that the great majority of these objects are blended with other nearby objects in the APM catalog (and usually classified as such), leading to poor agreement in the positions from the two catalogs. Furthermore, we should note that we have not examined the plates by eye at the locations of these “missing” sources, and some could be spurious APS entries which are legitimately absent in the APM catalog. Thus, the fraction of objects that is simply missing from the APM catalog above () is very small, certainly less than 0.1%.
Occasionally the positions measured by the APM on the and plates are sufficiently different that the red and blue detections are not recognized as being a single source and so two entries (one -only and one -only) appear in the APM catalog (§3.6.1). This can lead to incomplete radio source identification. In our APS test sample, there are cases (1.2%) where a single APS source matches a close pair (″) of -only and -only objects from the same APM plate. We consider these objects to be cases where a single source has been split into two catalog entries. The majority of these split objects are bright (Fig. 3) and are further examples of the complex and/or blended objects that occasionally caused trouble for the bright UGC galaxies discussed above. The median magnitude of these objects is 16.1; the fraction of such objects is for the magnitude range 15–20 in which most radio counterparts are found.

4 FIRST as an Astrometric Standard
4.1 Introduction
As we show in WBHG, all unresolved FIRST sources down to the survey limit have 90% confidence positional uncertainties of ; furthermore, the absolute reference frame is tied to the VLB reference frame with an offset of and an rms uncertainty of in each coordinate. This level of precision is unprecedented for such a high-surface-density catalog (e.g., the Guide Star Catalog entries have an rms uncertainty of 0.4″ with systematic errors of up to 1″), making FIRST a useful astrometric calibration standard for any astronomical catalog which contains a significant number of FIRST source counterparts. In this section, we use the radio source positions to calibrate and correct the APM intraplate astrometry errors and the plate-to-plate shifts, allowing an improvement by nearly an order of magnitude in POSS-I positions.
The FIRST catalog contains about 90 sources deg-2 of which 15% (see §5.2) have APM optical counterparts within , yielding 600 matches per POSS-I plate. This, in effect, provides a dense grid of astrometric standards across each plate. More important, the optical counterparts to FIRST sources are generally faint, and thus complement the astrometric calibration that can be achieved using bright standards such as the PPM and Tycho catalogs that have been used heretofore as the basis of the APM plate solutions.
4.2 Overall APM Astrometric Offset
Whilst working on radio identifications for the Jodrell Bank-VLA Astrometric Survey (JVAS – Patnaik et al. 1992; Hook et al. 1996; Snellen et al. 2001), it was noted that there was evidence for a shift between the mean Right Ascension and Declination of the APM reference frame and the VLA reference frame. The mean shift was derived by taking the median of the nearest optical counterparts to the survey’s flat-spectrum radio emitters and yielded:
-
•
RAAPM(corrected) = RAAPM (original) + 0.35 arcsec
-
•
DecAPM(corrected) = DecAPM (original) + 0.35 arcsec
We verified that this effect was not intrinsic to the PPM reference frame used for the APM plate solutions at that time by comparing the optical positions of a set of VLBI Radio Reference Frame objects (Johnston et al. 1995) with optical counterparts on APM scans and found that the same systematic shift was present. We then remeasured POSS field 1393 centered on the North Galactic Pole in two orientations: with the normal scanning direction and with the plate rotated by 180 degrees. We found that, after application of the original astrometric alignment using the PPM stars, the derived positions for faint ( magnitude) objects differed by in both coordinates. This indicated that the APM measurement system was introducing a systematic shift in the positions of bright objects with respect to fainter ones. The origin of this effect is still under investigation. Our first step in comparing FIRST sources and the APM catalog, then, was to take out this systematic shift of 0.35″ in both coordinates.
4.3 Intraplate Errors
The original POSS-I plates suffer from various distortions resulting from the stress induced by the plate holder, the vignetting of the 48-inch Schmidt telescope, etc., which are reproducible from plate to plate (Irwin 1994). In Figure 4(a), we display the pattern of residuals from the TYCHO reference stars derived by stacking the APM-TYCHO offsets for all such stars on 148 plates. Systematic errors reach 1.3″ in some regions of the plate. A correction for this effect has, as noted above, been applied to all APM catalog positions using a correction map derived from the Tycho catalog.


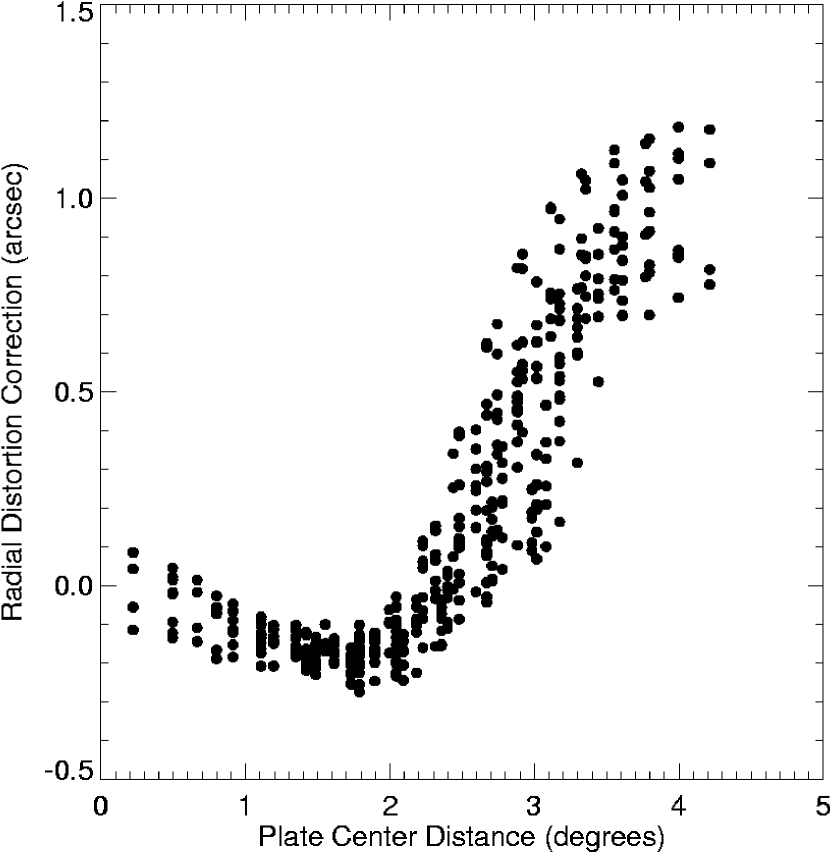
We compared these corrected APM positions with those of FIRST radio sources over the 148 POSS-I plates which subsume the current survey region. Including all sources with optical counterparts having offsets (60,000 objects with a false rate of % — see §5) yields the result displayed in Figure 4(b). Residuals within a radius of 2.5 deg of the plate centers are substantially reduced compared with Fig. 4(a), but large radial errors with magnitudes up to 1.2″ are now seen around the plate edges (Fig. 5). We believe this effect is a consequence of a combination of telescope vignetting and plate saturation of the bright stars in the Tycho grid: vignetting distorts the stellar images in the radial direction, producing elliptical isophotes whose centroids are systematically shifted toward the plate center. The FIRST counterparts, largely much fainter objects for which saturation is not a problem, reveal this distortion.
To correct for this effect, we have chosen to calibrate the errors using all FIRST counterparts with ; the bright limit is chosen such that the magnitude-dependent errors described above will be unimportant (and only excludes 6% of the matches), while the faint limit is imposed in order to include only those objects for which the random errors are small. The correction proceeds iteratively. We calculate a mean offset (in both the radial and tangential directions) for all sources in the stacked image in cells on a side (2020 cells cover the plate). We then apply the derived offsets to all APM objects in the catalog based on their - plate positions, rematch to FIRST, and then recalculate the mean offset for the cell. The process is repeated until it converges (4 steps). An iterative approach is required because the APM position shifts are comparable to the APM-FIRST matching radius. The resulting APM-FIRST position errors are much improved: the maximum residual mean offsets are less than 0.18″ with an rms of only 0.06″ over the whole plate.
This intraplate correction is strictly valid only for the range of magnitudes used in the calibration (). An examination of the offsets for fainter counterparts suggests that the corrections work well to the plate limit, although the positional uncertainties increase slightly owing to the statistical fluctuations which are inevitable in deriving positions for objects near the detection threshold. For the brighter objects, however, the derived positions of candidate counterparts to FIRST sources suffer from the same type of distortion evident in the Tycho-based solution, presumably in a magnitude-dependent way. Rather than attempting to derive the functional form of the magnitude dependence from the small number of bright FIRST counterparts, we recommend that for very bright objects either the separation for an acceptable match be increased or the offset be computed using the APM astrometry without the FIRST astrometric correction. For example, in the FIRST Bright Quasar Survey (White et al. 2000) we include all sources with optical matches closer than in either astrometric frame, a procedure which adds 24 objects to the 1214 selected using the FIRST astrometric solution alone. Since the typical discrepancy between the two solutions is and our minimum matching criterion is , no genuine matches will be missed if this procedure is followed. However, since the overwhelming majority of optical counterparts are faint, we have used only the matches with the FIRST corrections applied when compiling the match statistics in this paper.
This use of FIRST sources as astrometric calibrators assumes, of course, that there are no systematic errors in the radio positions. In Figure 6, we display the analogous plot to Figure 4(b) for the FIRST catalog: the - positions of each FIRST source in the radio “plate” (i.e., coadded image — see BWH) are extracted and the mean offset from the APM matches to these sources (binned in cells) is calculated. The uniformity is excellent and the magnitude of the errors is very small: they are all with an rms of 0.05″ over the whole field333We display only the region within the 11501550 pixel image from which sources actually enter the catalog; sources closer to the boundaries will be extracted from the adjacent coadded images.. This result, coupled with our global astrometric calibration described in WBHG suggests our confidence in FIRST astrometry is justified, and that our radio catalog can be utilized routinely to aid the astrometric calibration of other catalogs.

4.4 Plate-to-plate Shifts
Having established the global APM offset and calibrated out the reproducible intraplate errors, we are left only with translations of individual plates with respect to our radio reference frame. The mean FIRST-APM offsets for each of the 148 plates in the survey region are shown in Figure 7. These offsets were computed using an iterative approach similar to that used to derive the plate distortion. There is no obvious trend with Right Ascension or Declination, but shifts remain at levels ranging from 0.01″ to 0.70″; the distribution of errors is roughly Gaussian in both coordinates with an rms of and an apparent tendency for large offsets in one coordinate to be matched by those in the other. We remove these shifts by simply subtracting the shift computed for a plate from the APM positions of all objects on the plate. Note that for plates which fall completely within the boundaries of the FIRST survey, this calibration is final; however, for those plates only partially covered by the existing survey, the global offset will be redetermined as new data accumulate. The size of any subsequent correction is expected to be no more than 0.1″. The current values, along with the intraplate correction matrix are available on the FIRST Website.

After correcting for the plate shifts, we have recomputed the plate-based distortion maps (Fig. 4) to determine whether the systematic plate shifts affect them. The changes in the distortions are small ().
Having completed the astrometric calibration, we can now proceed to generate a catalog of optical identifications for the FIRST survey.
5 Optical Identification of FIRST Radio Sources
The primary condition for assigning an optical counterpart to a radio source has traditionally been positional coincidence; while other factors can enhance or detract from the probability that the association is correct, these are generally second-order effects. If the positional accuracies for both the radio and optical catalogs are very high, positional coincidence alone can afford a high degree of confidence. In BWH, we calculated the expected error rate for associations between the APM and several hypothetical VLA radio surveys with differing angular resolutions. The reliability of associations based on positional coincidence were presented as a function of optical source density on the sky, and as a function of apparent V magnitude at the North Galactic Pole. The results demonstrated the strong dependence of both reliability and completeness on the angular resolution of the radio survey.
In reality, the actual error rate in radio/optical associations is a complex problem depending on the details of the relative astrometric accuracy of the two data sets, the optical morphology of candidate objects, and radio source morphology. In this section we quantify empirically the reliability of associations between FIRST radio sources and optical counterparts on the POSS-I plates as measured by the APM.
5.1 Background Rates Using Closest Matches
In our analysis of the FIRST-APM match rate, we retain only the closest optical match to each radio source and vice versa. While the optical catalog we present below includes all matches out to , not just the closest one, using only the closest matches when describing the identification statistics makes understanding the background and true match rates easier. We want to know the number of radio sources that have optical counterparts, but we want to avoid double-counting (e.g., a particular optical object may be the closest counterpart for two different radio sources.) Also, neither catalog can have pairs of sources with separations of less than a few arcseconds, which means that there is effectively a “hole” in the catalog around each radio or optical source. This makes it very difficult to calculate chance coincidence rates, since true matches suppress additional false matches in a complicated manner.
We can avoid both of these problems by using only the closest matches. This also modifies the chance background rate, since once a source has a counterpart there can be no additional counterparts at wider separations. This effect is straightforward to understand and incorporate into the background computation: the area being searched for new matches at a given radius is contributed only by FIRST sources that do not already have a closer optical counterpart. Another complication when using closest matches is that the matching circles for close pairs of radio sources can overlap. An optical source that falls in the overlap region between two radio sources can only be assigned as the counterpart to one of them. This is also a mathematically tractable problem. Both effects are treated as a reduction in the effective sky area that is searched as a function of matching separation.
When both of these effects are taken into account, it is possible to predict the number of chance (false) coincidences as a function of the radio-optical separation. A simple model for this prediction that assumes a uniform, random distribution of optical sources on the sky predicts more coincidences at large separations than are actually seen, owing to the variation in optical source density on the sky. In the presence of a varying optical source density, radio sources that remain unmatched at large separations are more likely to be found in low-density areas of the sky; consequently, the effective mean optical source density decreases as the separation increases. If the variation is not too large, this can also be modeled fairly simply. For an ensemble of radio sources, the effective background source density is
| (6) |
where is the mean source density, is the rms variation in the density, is the area already searched for source , and is the angular part of the matching circle being searched for source . For an isolated FIRST source with no nearby neighbors (so there are no overlapping error circles) and an optical match at radius , we have
| (7) | |||||
| (8) |
and
| (9) | |||||
| (10) |
For “gregarious” FIRST sources in close groups, the matching circles overlap. Then will include only the portion of the error circle at that would not be assigned to another FIRST source, so that in general .
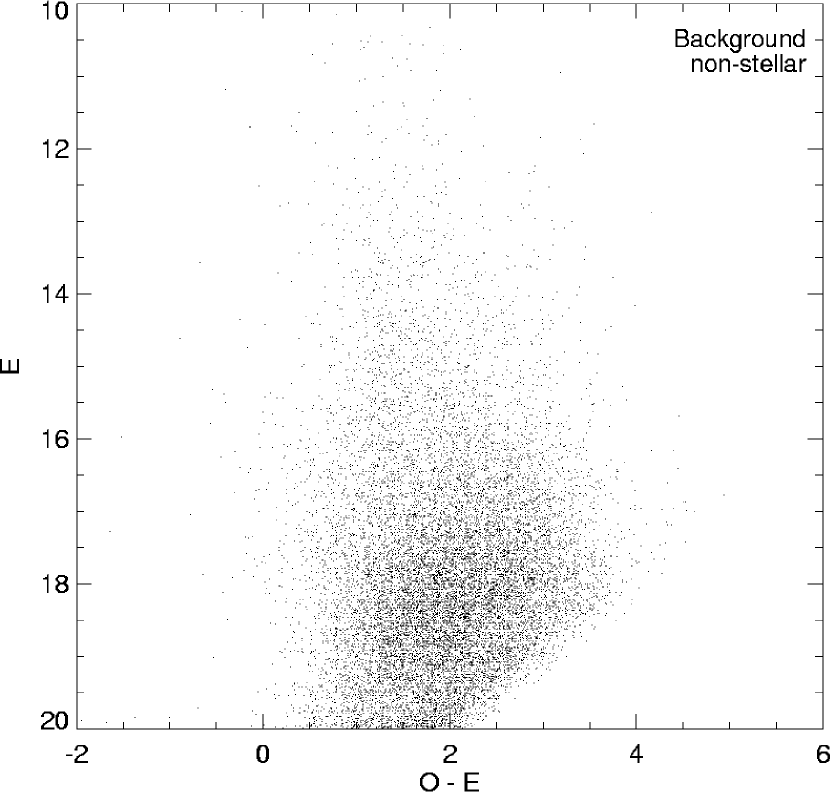
Our background model, then, has two parameters: the mean source density and the variance in the density . Values for these quantities were estimated from a spurious match catalog generated by offsetting the coordinates of the radio sources by to the south. We use this procedure instead of simply adopting the match rate between, say, 10″ and 20″ around the real source positions in order to minimize any enhancement in the false rate resulting from the presence of real radio-optical associations at large separations. Such associations result both from optical counterparts to multiple-component FIRST objects (where the optical position need not match any one of the cataloged FIRST components closely) and clustering of galaxies around FIRST objects (which will produce an uncharacteristically high optical source surface densities in the vicinity of the radio sources.) The parameters for the background due to various types of APM objects are given in Table 1.
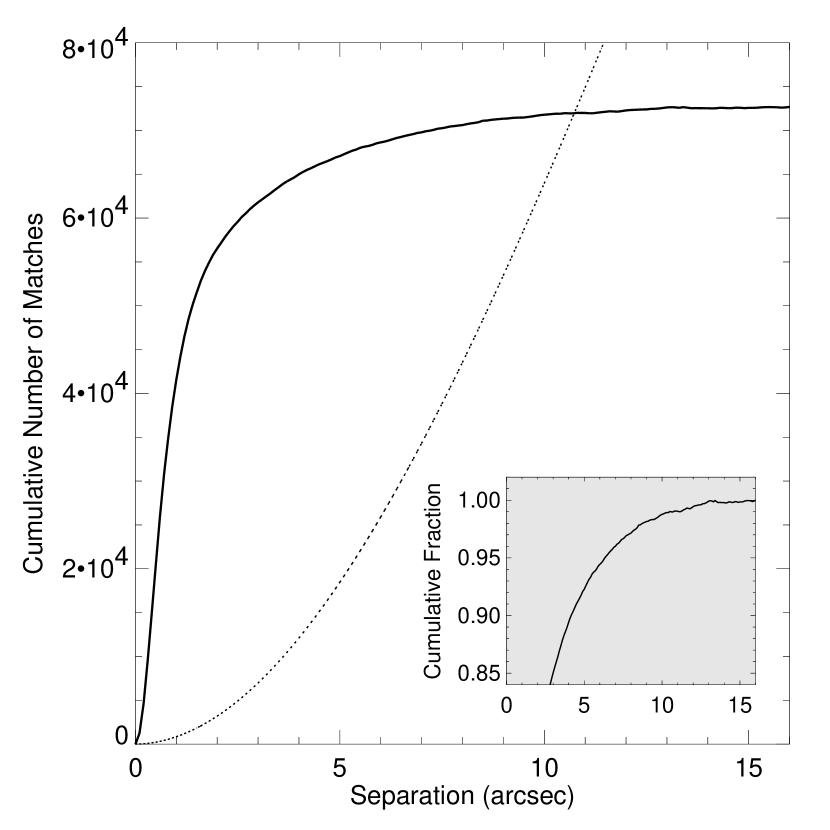
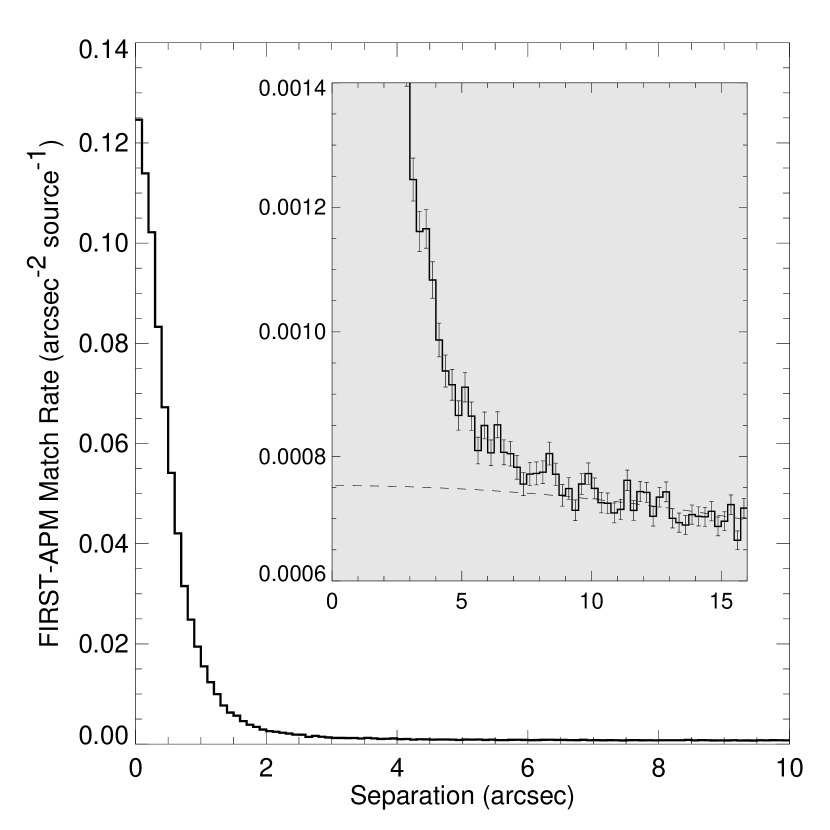
5.2 Match Results
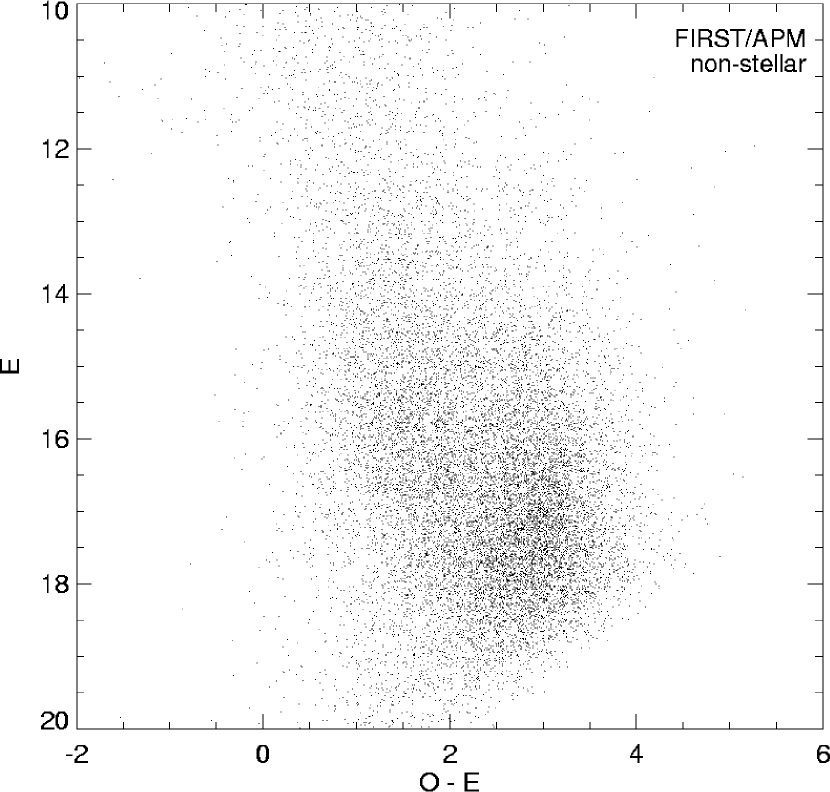
In Figure 8, we display the result of matching all 382,892 radio sources in our catalog to the astrometrically corrected APM catalog. The plot shows the cumulative excess of matched sources over the background of chance coincidences as a function of the offset between the radio and optical positions. We estimate that 98% of the APM sources within 1″ of a FIRST source are physically associated with the radio source; 42,400 sources meet this criterion. Even out to 2″, 94.5% of the 59,700 associations are real. Figure 8 indicates that some real matches occur out to ″ although the reliability decreases steadily as the separation increases. Integrating under the curve of Figure 8 out to 4″ implies 61,800 real associations (16% of all radio catalog entries). Inside the 1″ radius, 16% of the optical counterparts are classified as stellar on both plates, while 41% are classified as non-stellar on both plates; in the remaining cases, the classifiers disagree or the object is only detected on one plate. Note that, at faint magnitudes, classification becomes difficult owing to the limited number of pixels above threshold; in addition, active nuclei can make a galaxy appear stellar in the blue band, and the bulges of faint ellipticals and SOs are generally unresolved. Thus, galaxies are increasingly classified as stellar as the plate limit is approached.
In Table 3 we tabulate the completeness and reliability of objects that are only detected on a single red or blue plate. These have been estimated by shifting the radio positions by 3 arcmin in declination and running the matching analysis in an identical manner on this shifted dataset. This shows that 92.7% of the blue-only matches within 1” are real, and 97.5% of the red-only matches within 1” are real matches. This is a lower limit on whether these single band detections are real objects since we expect some of the the chance associations to be real celestial objects.
The matching results are more complicated to analyze when we take into account the complex radio sources that get broken into two or more components in the FIRST catalog. We call these “gregarious” sources (as distinguished from isolated sources) because they are found in clumps on the sky. Note that some gregarious sources are simply the chance superposition of two unrelated radio emitters at different distances; nonetheless, from our vantage point, they are gregarious, and confuse the matching statistics in a manner similar to that of the real multi-component objects. We define the sociological boundary between gregarious and isolated at ; i.e., any source with no other catalog entry within a radius of is classified as isolated, and all other sources are labeled gregarious. Such a fixed boundary is arbitrary, and, indeed, a small number of very extended objects will be incorrectly classified as isolated; we discuss this matter further in §5.
In Figure 9, we display the number of isolated matched sources as a function of the offset between the radio and optical positions in 0.1″ bins, normalized by the annular area of each bin. Figure 10 displays the ratio of the number of matches to the predicted false rate as a function of separation.

Both the background rate and the typical angular separation between FIRST and APM positions depend strongly on the optical classification. Figure 11 shows the distribution of separations for sources classified as stellar on both plates or non-stellar on both plates. The FIRST-APM positions typically differ by more for galaxies, which have less well-determined optical positions. However, it is easier to identify galaxies confidently as FIRST counterparts because the background rate for galaxies is four times smaller than for stars (see Table 1).
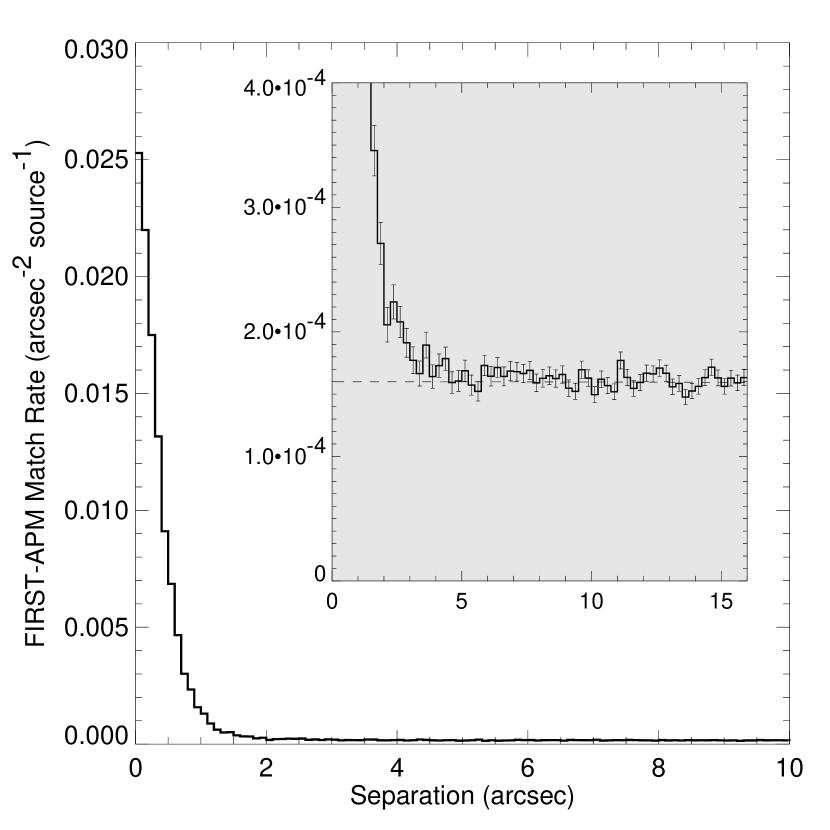
We quantify this effect by calculating the angular radius which contains 90% of the real associations as well as the percentage of false matches within the same radius. For example, these numbers are 4.2″ and 17% for the distribution of all FIRST/APM sources as shown in Figure 8. If we restrict the match to APM objects that are classified as galaxies on both plates (Fig. 11b), the values are and 2.7%. The 90% radius is quite similar to that for all associations, since galaxies constitute the majority of all identifications; however, the reliability for galaxies is much higher because the background rate for galaxies is smaller (Fig. 11). By comparison, if we restrict ourselves to APM sources that are stellar on both POSS plates (Fig. 11a), the 90% radius and error rate are and 6%. The smaller footprint of stars on the POSS-I leads to more accurate optical positions (hence the smaller 90% radius). These and other cases are summarized in Table 2 and in Figure 12, which displays the completeness and reliability of matches as a function of separation.


5.3 The Effects of Radio Morphology
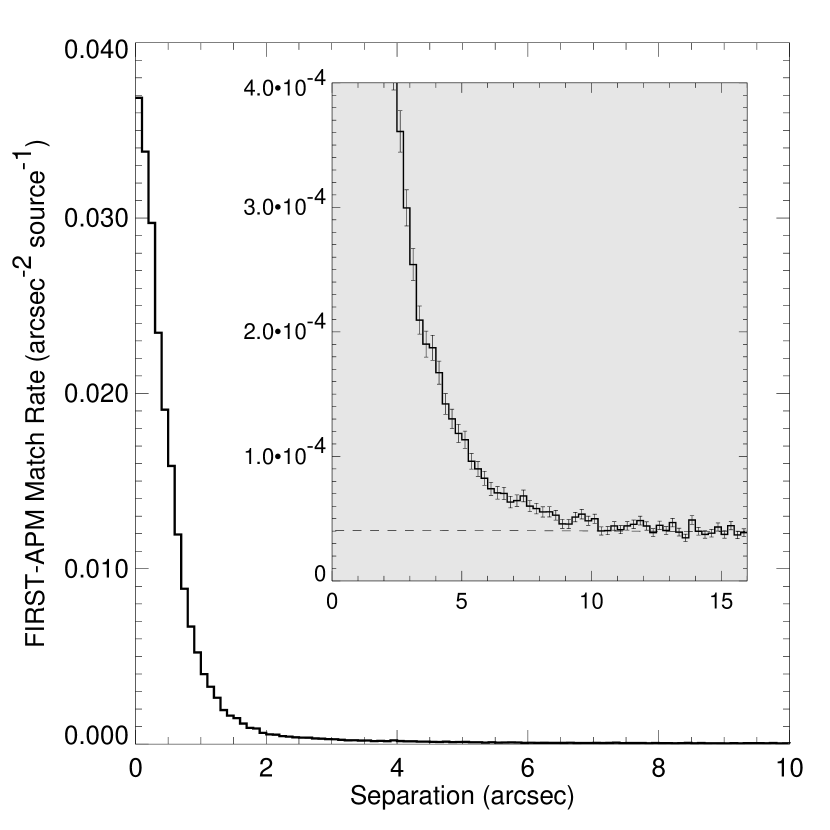
The statistical agreement between FIRST and APM positions is also affected by the morphology of FIRST sources. If we restrict the FIRST sample to point-like radio sources (but include all APM sources), the 90% association radius is 2.0″ with a false rate of 5%. Limiting the discussion to sources that are point-like in both the radio and the optical results in 90% of the matches within 1.1″ with a 2.4% false rate.

Figure 13 compares the histogram of separations for isolated sources with that for the gregarious sources. It can be seen that gregarious sources contribute most of the matches at large separations; indeed, they show evidence for a statistically significant excess of matches even beyond . Many of the gregarious FIRST sources are components of classical double radio sources, which may have no radio component at the center of the double. Consequently the optical counterpart will typically be the double separation from each component. We now begin to explore counterpart identification strategies for such sources.
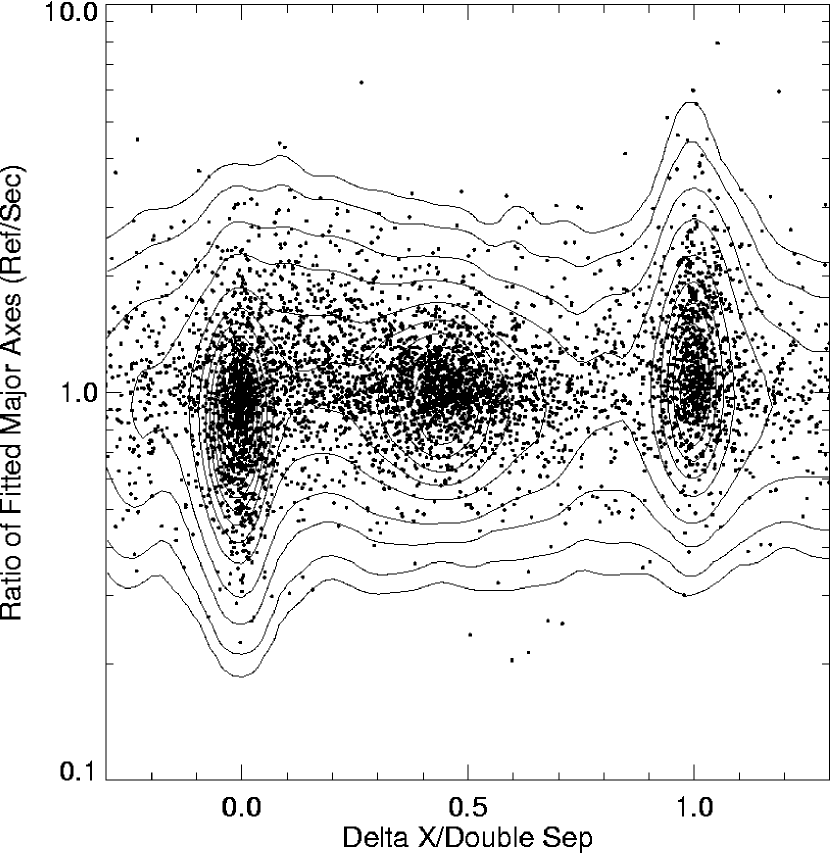
5.4 Optical Counterparts to Double Radio Sources
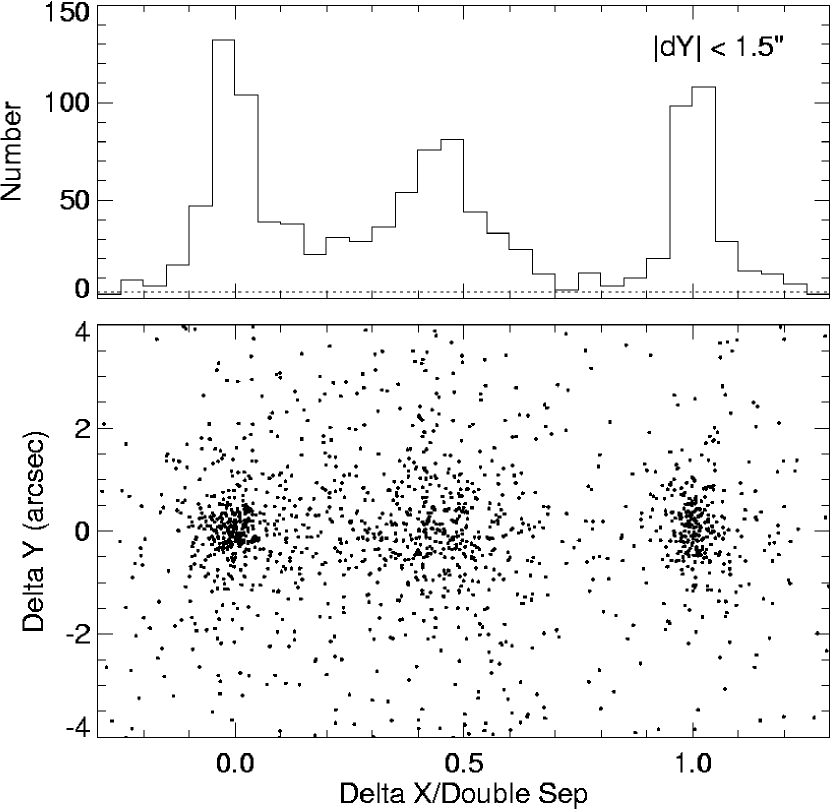
The wide variety of radio source morphologies (not to mention the extent to which their appearance depends on the resolution of the survey) makes it difficult to design a robust algorithm that predicts the locations of the optical counterparts to multiple-component sources. We present here an empirical approach to the problem for the simplest class of such sources – isolated doubles.

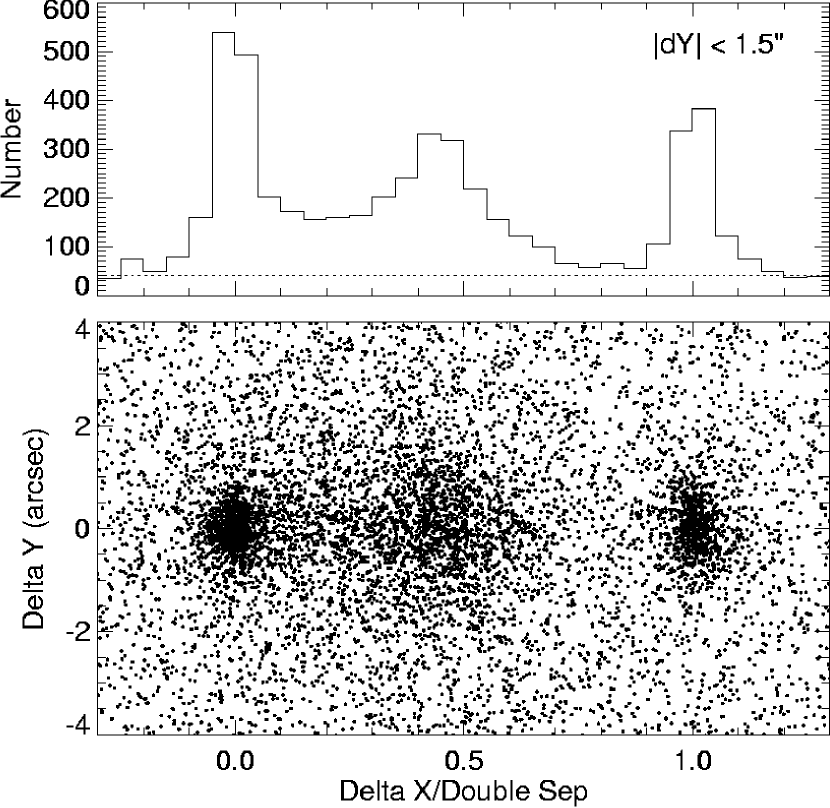
Figure 14 displays the distribution of isolated pairs of FIRST sources as a function of their separation. The minimum value of is imposed by the source detection algorithm (WBGH). The fall-off in the number of detected doubles beyond reflects a number of factors: 1) the survey beam resolves out very extended features and will therefore not detect sources on the largest scales, 2) the exclusion of triples and other multiple component sources from this subsample will preferentially remove extended sources on larger scales, and 3) there is a real decline in the number of large angular-diameter objects. For comparison with the APM catalog, we have selected objects with separations in the range .
The lower portion of Figure 15 displays the distribution of optical objects in the vicinity of the 21,579 pairs of radio sources meeting this criterion. The x-axis for each pair is defined by the line joining the centroids of the two objects; the scale is normalized to the separation, with the origin chosen as the brighter of the two components. The upper panel shows a histogram for all optical objects within of the line joining to two components; the expected false rate from a uniform distribution of sources with the same mean surface density as the FIRST survey is shown as the dashed line. Several features of the distribution are immediately apparent. There is a large concentration of optical objects coincident with the brighter of the two radio components, suggesting a core-jet morphology. A roughly equal number of identifications is found approximately half way between the two components with a slight bias in the direction of the brighter lobe; the broader spread in the y-direction for these counterparts reflects in part the bending of radio lobes as a consequence of their interaction with the intergalactic medium (e.g., Blanton et al. 2000, 2001). Finally, a much smaller fraction of the identifications is coincident with the weaker of the two lobes. The overall identification rate derived from integrating the upper curve and subtracting the background rate is %, similar to that for the radio sample as a whole.
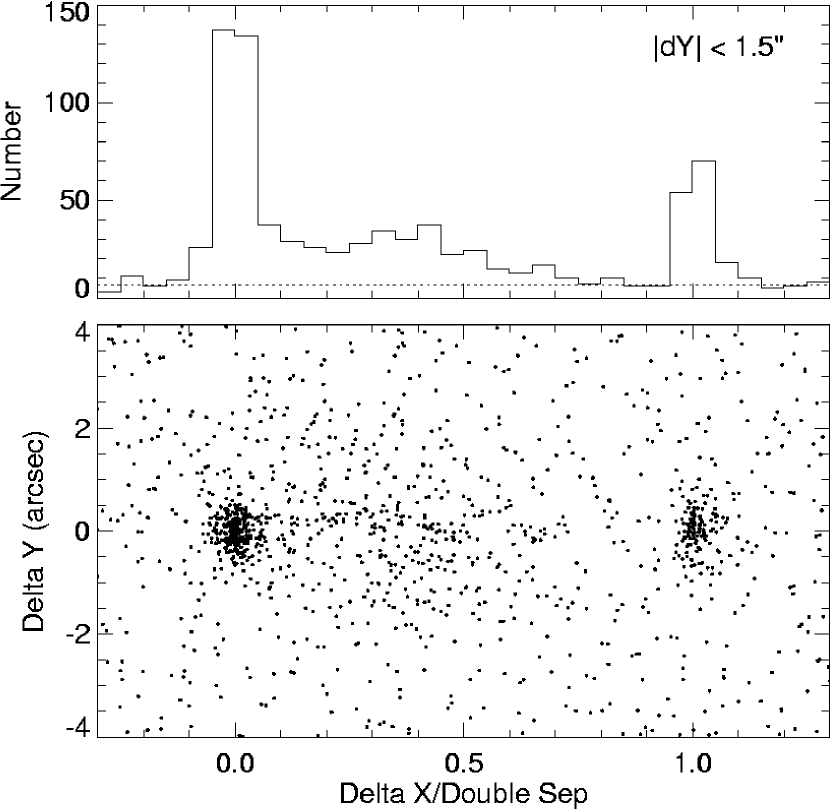
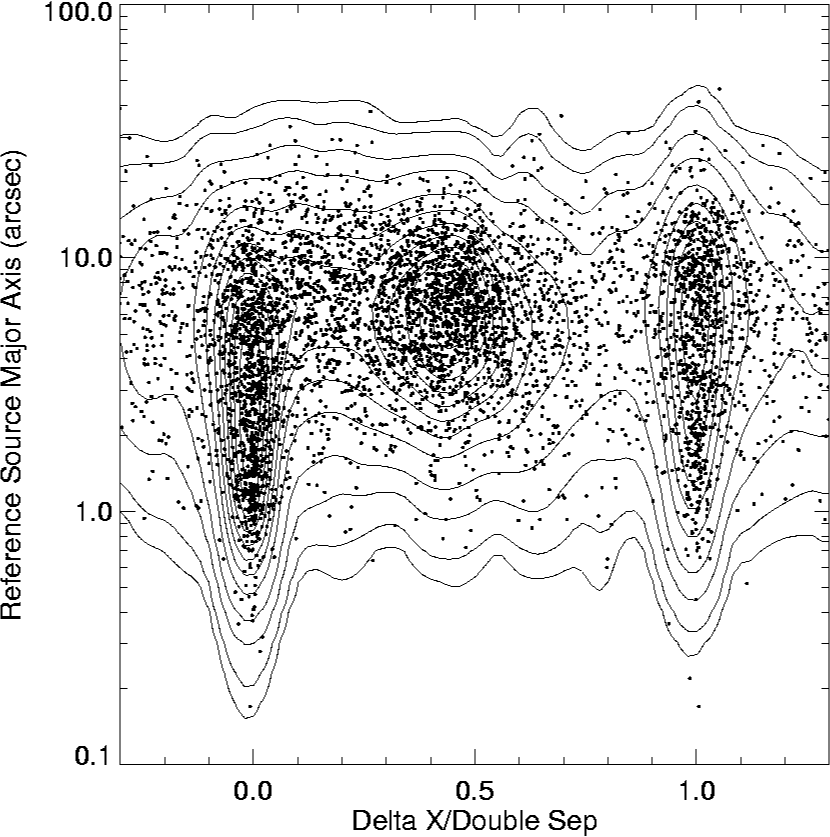
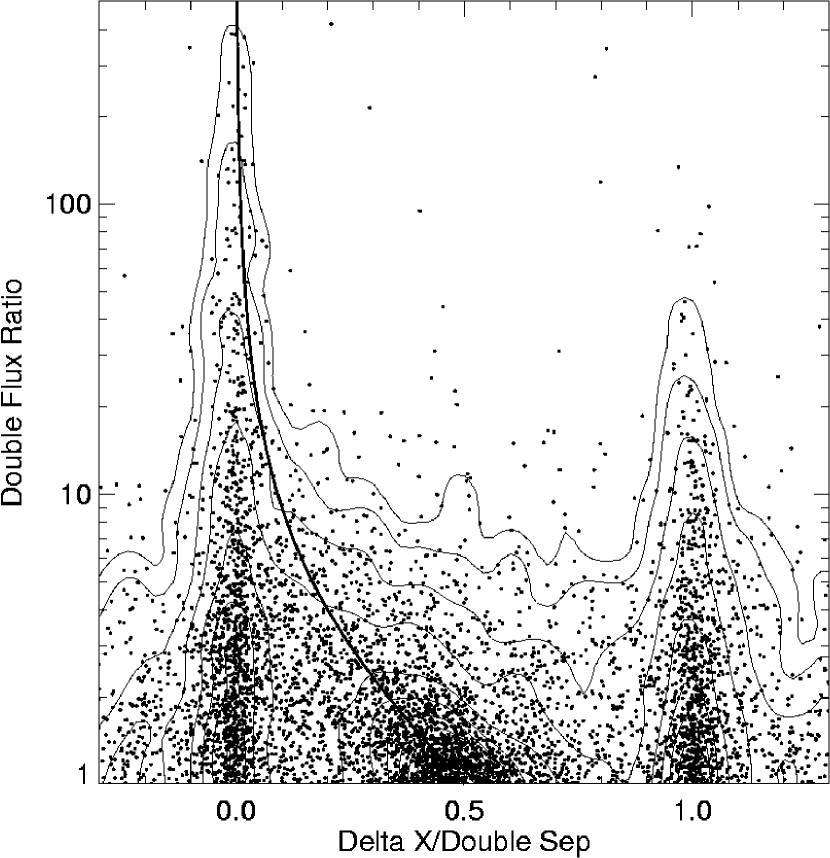
Dividing the optical counterparts by morphological class yields additional interesting results. The objects classified as galaxies on both plates (Figure 16a) produce the most counterparts midway between the components, while the stellar objects are predominantly associated with the brighter radio component (Figure 16b). Figure 17 shows that many of these core components are small in size (panel a) and are much brighter (panel b) than the other component: the median flux ratio for sources where the optical counterpart matches the brighter radio component is 3.0, while the median for the central-component matches is 1.4. When the brighter of the radio components identifies the optical counterpart, it also tends to be the smaller of the two components (panel c). Likewise, for cases in which the dimmer source has the optical counterpart, it tends to be smaller. In contrast, the sources with identifications that lie between the two radio lobes have very narrow ranges of flux density and size ratios near unity, and are virtually all resolved.
Using these trends in radio source component flux density and size ratios, total extents, and optical morphology (in addition to magnitude and color, perhaps) it would be possible to develop a reasonably reliable identification algorithm for double and multiple FIRST sources, although we regard such an effort as beyond the scope of this paper. What is clear from the foregoing analysis is that, since the identification rate for complex sources is similar to that for single-component objects, the effect on the final fraction of radio emitters identifiable at the POSS-I plate limit simply scales with the number of radio components removed from consideration as a consequence of their association with another catalog entry. Using an algorithm that assigns a probability to component associations based on flux density and separation, we find that, for separations up to there are 32,312 doubles444Note this number is different from that in Figure 15 because the latter includes only isolated doubles so as to examine as cleanly as possible the optical coincidence rates., 12,802 triples, and 5,716 groups of four or more sources with a probability of real association . This reduces our catalog to discrete radio emitters and yields an overall identified fraction at the POSS-I limit of %.
6 Characteristics of the Optical Counterparts to FIRST Sources
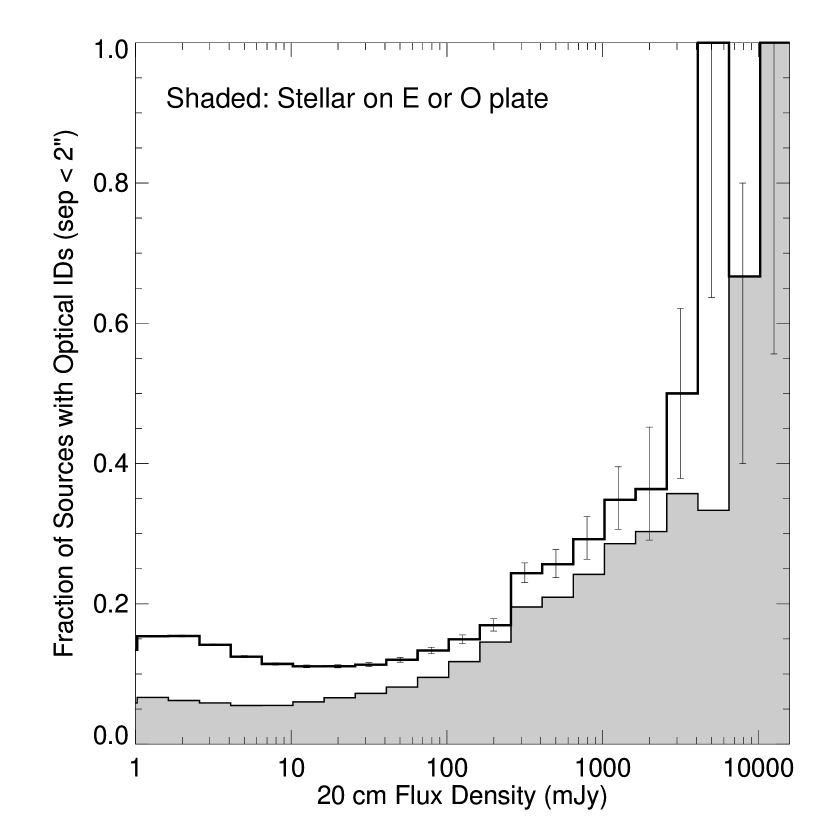
The objects in the FIRST catalog span over four orders of magnitude in radio flux density, and the identification rate as a function of flux density is displayed in Figure 18. Even for sources as bright as 1 Jy, only one-third of the objects have counterparts brighter than the plate limit. The identification rate falls monotonically with flux density to 20 mJy where it reaches a minimum of % and then climbs again toward the survey limit. The rise at low flux densities reflects the change in the composition of the radio source population which is dominated by distant AGN at high flux densities and by nearby star-forming galaxies below 1 mJy (Condon 1992). The fraction of sources classified as stellar on at least one of the two POSS plates is also reflective of this trend (Figure 19). Above 100 mJy over 80% of all counterparts are stellar (quasars), whereas this fraction decreases monotonically until at 1 mJy, 60% of the counterparts are classified as galaxies; given the strong tendency toward the misclassification of faint galaxies as stellar, the true fraction of galaxy counterparts is considerably higher.

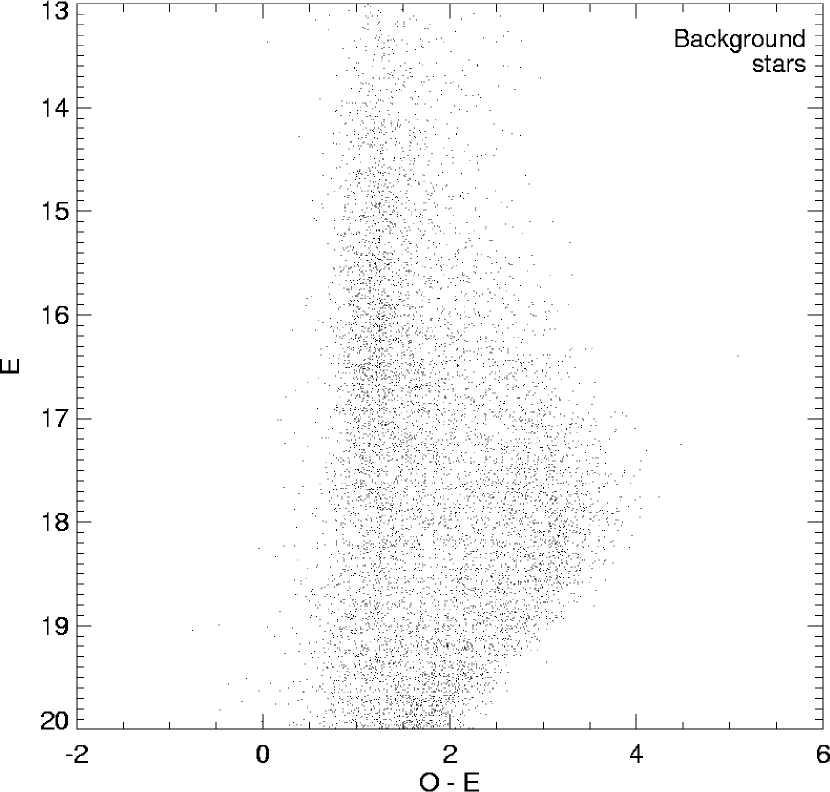
One way to explore the types of objects associated with FIRST sources is to place the optical counterparts onto a color - magnitude diagram. In Figures 20 and 21 we show the color-magnitude diagrams for the ‘stars’ and galaxies (based on a consistent APM classification from both POSS plates) within and match radii, respectively. For comparison, these figures also display similar diagrams for an equal number of stellar and nonstellar sources taken from random positions on the same plates.
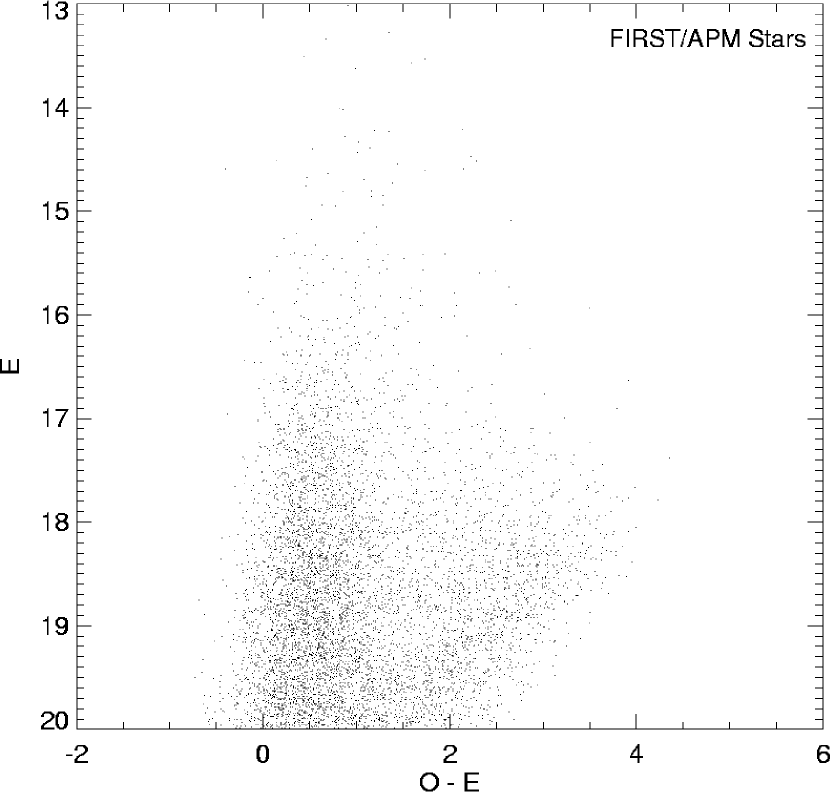
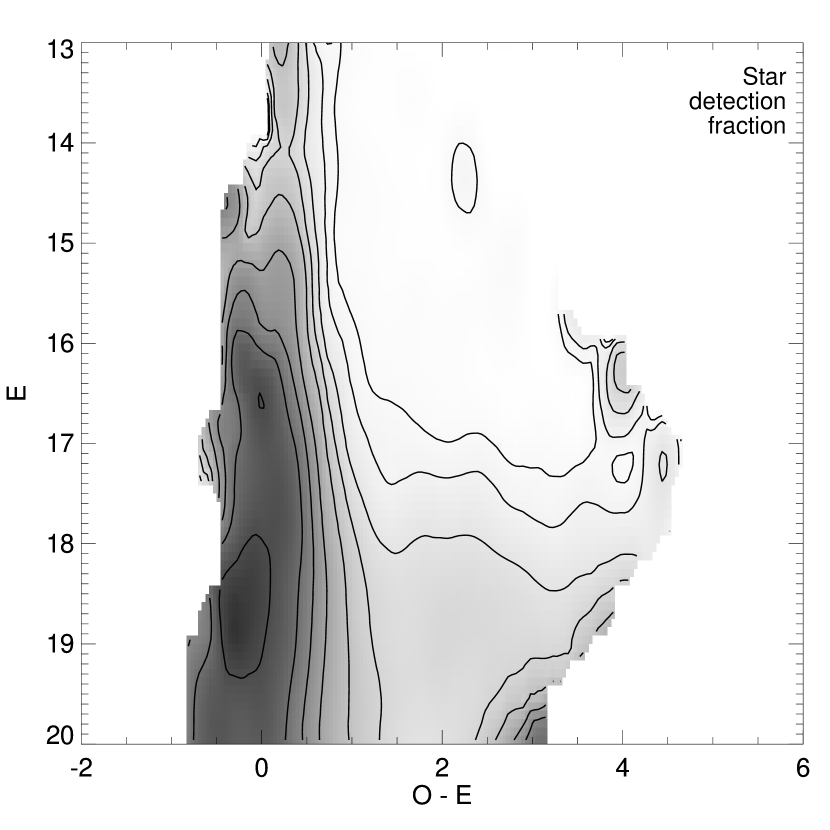
The radio counterparts classified as stellar are clearly much fainter and much bluer than most ‘stars’; this is illustrated in Figure 22, where we plot the fraction of the radio-detected ‘stars’ as a function of location in the color-magnitude plane. The detected fraction peaks at % for colors around for . These objects are nearly all quasars. The increasing fraction of detected objects with all colors fainter than magnitude is largely an artifact produced by the failure of the classifier to distinguish stars from galaxies near the plate limit; in fact, most of the faint, red stellar objects are actually galaxies, although a handful of very red objects have been shown to be high redshift quasars (Hook et al. 1998).
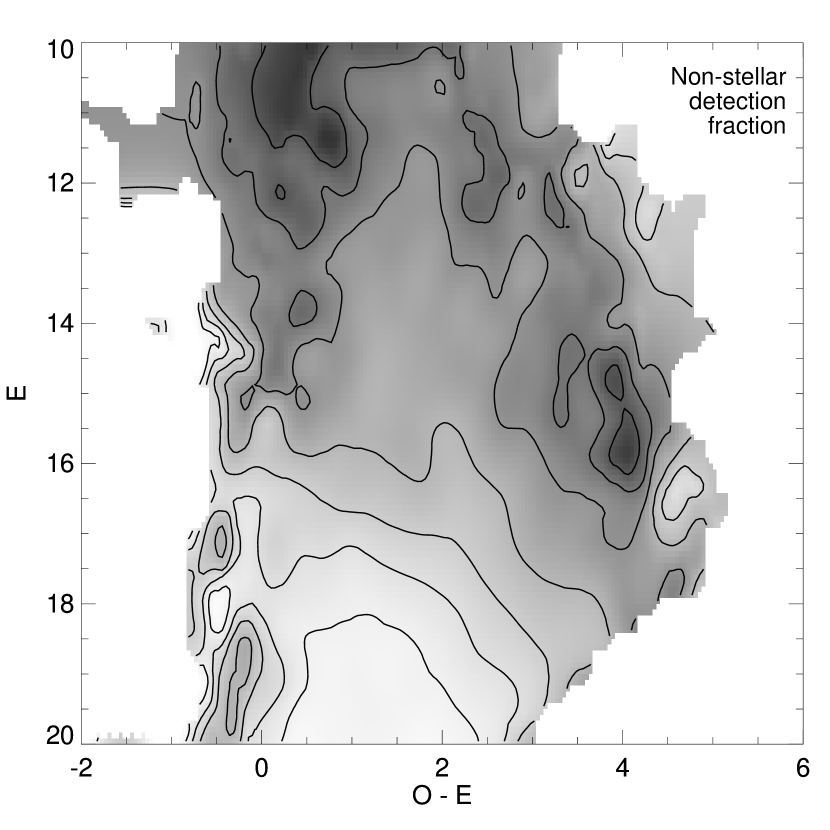
For the nonstellar objects, it is clear that the radio detections are biased toward brighter magnitudes, but are found for galaxies of all colors. In Figure 23, we show the detected fraction of galaxies in the color-magnitude plane. The roughly uniform detection rate as a function of color and the bias towards brighter galaxies are apparent; up to 10% of the brightest galaxies are detected and even for E16, 2% of all galaxies have FIRST counterparts.
7 The Catalog of FIRST Optical Counterparts
Table 4 displays a sample page of the catalog of APM-FIRST matches which is available from the FIRST home page (http://sundog.stsci.edu). Columns 1 and 2 contain the radio source coordinates (epoch J2000.0) and are followed by the offsets in Right Ascension, Declination, and radius (all in arcsec) of the nearest optical object falling within of the radio position. The global APM/FIRST shift, the plate-to-plate shifts, and the intraplate shifts as determined by FIRST (§4) have all been applied to the raw APM catalog positions before calculating these offsets. Columns 6–8 contain the optical classification, the psf parameter (see §3), and the magnitude of the counterpart on the red () plate. The optical classification codes are: stellar (consistent with the magnitude- and position-dependent point spread function, cl), non-stellar (a measurably extended source, cl=1), merged objects (sources with two local maxima within a single set of connected above-threshold pixels, cl=2), and noise (objects with nonphysical morphologies, cl=0). For further details of the principles involved, see §3 and Maddox et al. (1991a,b). A negative magnitude indicates that the object was not detected in this waveband and the absolute value is a 2 upper limit. Columns 9–11 list the same information for the blue () plate. Column 12 is the () color derived from columns 8 and 11 unless the object is only detected on one plate, whereupon the color is designated -9.99. All raw APM magnitudes have been corrected for plate to plate systematic calibration errors as described in §3.4; the uncertainties (rms) in the magnitudes are . The POSS plate number in column 13 is followed by selected radio parameters for the FIRST source, including the peak and integrated flux densities, and the deconvolved source major axis, minor axis, and position angle. The major and minor axes (FWHM) have been deconvolved using a 5.4” synthesized beam. Negative values indicate that the source size (before deconvolution) was smaller than the beam. These radio parameters are described in further detail in WBHG.
As demonstrated above, 95% of the counterparts within are actual FIRST identifications. There are, however, a number of reasons for studying the contents of the optical sky even farther from the FIRST positions: double and multiple-component sources are likely to have parent galaxies with substantial offsets from the radio positions, and the clustering of optical objects around FIRST sources appears to be a fruitful area for investigation (Helfand et al. 1998). In addition, catalog users may find it helpful to be able to calculate false rates for particular ranges of optical magnitude, radio flux density, or source morphology. Thus, we have constructed a second catalog (also available on-line) which includes all optical objects appearing on either POSS-I plate which lie within of a FIRST position; 68% of the FIRST sources have at least one such counterpart. The format of this database is identical to that of the primary catalog; it contains nearly half a million entries representing 454,754 unique optical objects in the vicinity of 261,434 radio catalog entries. Also as the FIRST survey grows in size we shall periodically update these on-line optical catalogues.
8 Discussion
The systematic optical identification of radio-selected samples with flux densities in the range 1–30 mJy began nearly twenty years ago using the first deep radio images obtained by Westerbork and the VLA. In Table 5, we summarize the published work on this problem. The area surveyed covers a little more than 50 deg2 and includes 1448 radio sources between the limits of the all-sky, single dish surveys (30 mJy) and the FIRST survey threshold (1.0 mJy). A total of 455 sources have suggested identifications, albeit to different levels of optical sensitivity, completeness, and reliability. Only 270 counterpart candidates have been published for radio-selected objects at thresholds roughly equivalent to the POSS-I plates. The total number from this flux density range in the work reported here represents a sample of confidently identified radio sources to this limit. Our project, then, represents an increase of more than two orders of magnitude in the number of optically identified faint radio sources. What source classes are represented in this sample, and how do the results compare with our expectations from earlier work?
The raw fraction of detections at the POSS-I limit, , is similar to the mean value derived from previous work (Table 5); the different optical bands used and the fuzzy lower bound to the POSS-I magnitudes easily explains the small discrepancy introduced when the corrections for multiple-component sources are applied (§5.4). The distribution amongst stellar and non-stellar counterparts is also roughly similar; detailed comparisons are not warranted given the inevitable difficulty of classifying objects near the plate limits where most of the candidates lie. Further progress in quantifying the source populations represented, and in establishing their luminosity functions, requires CCD imaging and spectroscopy, work we have begun to pursue for a variety of subsamples derived from this FIRST/APM database. We discuss these briefly here.
The comprehensive catalog of stellar radio observations by Wendker (1995) contains 18 stars in the FIRST survey area detected at any radio frequency between 100 MHz and 30 GHz; of these, only a dozen have ever been seen at a 20 cm flux density in excess of 1 mJy. Our comprehensive study of various stellar proper motion catalogs has produced an additional fourteen stellar radio source identifications (Helfand et al. 1999). Proper motions remain the largest obstacle to our identification of stellar counterparts fainter than Tycho catalog limit ( magnitude), and the advent of the GSC-II should significantly increase the number of stellar identifications to . Nonetheless, stars make a trivial contribution to the total radio source population above our 20 cm flux density threshold of 1 mJy. Other Galactic counterparts are similarly rare: we have detected only 3 (of the 8) known planetary nebulae and 7 (of the 18) known radio pulsars. In total, we expect that less than 0.03% of the FIRST catalog entries represent Galactic objects.
There are, of course, a much larger number of optical counterparts with stellar images on the POSS plates. These represent a mixture of quasars, BL Lac objects, AGN with sufficiently bright nuclei that they are classified as stellar, H II galaxies with similarly bright nuclei, and radio galaxies with sufficiently small diameters that they are unresolved. The FIRST Bright Quasar Survey (White et al. 2000) has established the distribution amongst these categories for objects brighter than E=17.8: quasars, BL Lacs, AGN, radio galaxies, and H II galaxies, with the remaining objects being a collection of stars and chance coincidences. We have begun a smaller survey to establish this distribution at fainter magnitudes (Becker et al. 2001).
The majority of the FIRST counterparts brighter than the POSS-I limit are galaxies. Two principal populations are represented: active galactic nuclei including both relatively nearby Seyferts and luminous elliptical hosts of more powerful radio galaxies up to , and a local population of star-forming galaxies (Condon 1992). Our work to date has consisted primarily of following up the counterparts to the several hundred bent, double-lobed radio galaxies which can act as tracers for galaxy clusters (Blanton et al. 2000, 2001). Studies of selected, magnitude-limited samples of the galaxy population are in progress.
One important use of FIRST radio sources is as tracers of the general matter density of the Universe; their broad redshift distribution and high mean samples a much larger volume than most surveys in other wavelength regimes. In applications such as determining the two-point (Cress et al. 1996), and higher order (Magliochetti et al. 1998) angular correlation functions, searching for a weak lensing signal on large angular scales (Refregier et al. 1999) and other such statistical studies, it may be useful to eliminate the low-redshift, star-forming galaxy population. The catalog presented here can be applied for such purposes.
9 Summary and Future Work
We have completed an optical identification program for FIRST radio sources by matching the FIRST catalog to a catalog constructed from the APM scans of the POSS-I survey. A detailed analysis of the properties of the APM catalog has been undertaken; we have recalibrated its photometry using the APS, and have produced a factor of improvement in astrometric accuracy by using the FIRST sources as a set of astrometric standards. We have discussed in some detail the procedures for identifying radio source counterparts through positional coincidence, calculating false match rates for various subsets of both catalogs. For stellar counterparts of isolated radio sources, the matches are 90% reliable and 90% complete within an offset of ; over 98% of all matches within are correct identifications. In total, nearly 73,000 radio source identifications are recorded, an increase by a factor of over the total number of counterparts previously reported for radio-selected samples in the flux density range 1-30 mJy. We present color-magnitude diagrams for the radio counterparts and briefly discuss the various source populations represented.
A catalog of all 454,754 optical objects within of the 382,892 radio sources in the north Galactic cap region FIRST has covered to date is available on the FIRST Webpage. As we complete radio observations and optical matching for additional regions of the sky, this catalog will be expanded accordingly. The results presented here suggest that future work to match FIRST with the GSC-II and the Sloan Digital Sky Survey (with which the FIRST sky coverage is matched) will yield enormous, valuable samples of optically identified radio sources for use in a wide variety of applications from stellar radio astronomy to cosmology.
References
- (1) Baade, W., & Minkowski, R. 1954a, ApJ, 119, 206
- (2) Baade, W., & Minkowski, R. 1954b, ApJ, 119, 215
- (3) Becker, R. H., White, R. L., & Helfand, D. J. 1995, ApJ, 450, 559
- (4) Becker, R. H., White, R. L., Gregg, M., Laurent-Muehleisen, S., Brotherton, M., Impey, C., Chaffee, F., Richards, G. T., Helfand, D. J., Lacy, M., Courbin, F., & Proctor, D. D. 2001, ApJS, 135, 227
- (5) Benn, C. R., Grueff, G., Vigotti, M., & Wall, J. J. 1988, MNRAS, 230, 1
- (6) Blanton, E. L., Gregg, M. D., Helfand, D. J., Becker, R. H., & White, R. L. 2000, ApJ, 531, 118
- (7) Blanton, E. L., Gregg, M. D., Helfand, D. J., Becker, R. H., & Leighly, K. M. 2001, AJ, 121, 2915
- (8) Bolton, J. G., Stanley, G. J., & Slee, O. B. 1949, Nature, 164, 101
- (9) Bunclark, P. S., & Irwin, M. J. 1983, in Proc. Statistical Methods in Astronomy, ESA SP-201, edited by E. J. Rolfe, p195
- (10) Condon, J. J. 1992, ARAA, 30, 575
- (11) Coleman, P. H., Condon, J. J., & Hazard, C. 1985, AJ, 90, 1437
- (12) Condon, J. J., Condon, M. A., & Hazard, C. 1982, AJ, 87, 739
- (13) Condon, J. J., & Mitchell, K. J. 1984, AJ, 89, 610
- (14) Condon, J. J., Dickey, J. M., & Salpeter, E. E. 1990, AJ 99, 1071
- (15) Cress, C. M., Helfand, D. J., Becker, R. H., Gregg, M. D., & White, R. L. 1996, ApJ, 473, 7
- (16) deRuiter, H. R., Zamorani, G., Parma, P., Hasinger, G., Hartner, G., Trumper, J., Burg, R., Giacconi, R., & Schmidt, M. 1997, A&A 319, 7
- (17) Evans, D. W. 1989, A&AS, 78, 249
- (18) Fomalont, E. B., Windhorst, R. A., Kristian, J. A., & Kellerman, K. I. 1991, AJ, 102, 1258
- (19) Georgakakis, A., Mobasher, B., Cram, L., Hopkins, A., Lidman, C. & Rowan-Robinson, M. 1999, MNRAS, 306, 708
- (20) Gregg, M. D., Becker, R. H., White, R. L., Helfand, D. J., McMahon, R. G., & Hook, I. M. 1996, AJ, 112, 407
- (21) Gunn, J. E. & Knapp, G. R. 1993, in Sky Surveys, ed. B. T. Soifer (San Francisco: ASP), 267
- (22) Harrington, R. G. 1952, PASP, 64, 275
- (23) Hayes, D. S., & Latham, D. W. 1975, ApJ, 197, 593
- (24) Helfand, D. J., Yadigaroglu, I. A., Berger, R., Postman, M., White, R. L., Lauer, T. R., Oegerle, W. R., & Becker, R. H. 1998, BAAS, 30, 1407
- (25) Helfand, D. J., Schnee, S., Becker, R. H., White, R. L., & McMahon, R. G. 1999, AJ, 117, 1568
- (26) Helfand, D. J., Stone. R. P. S., Willman, B., White, R. L., Becker, R. H., Price, T., Gregg, M. D., & McMahon, R. G. 2001, AJ, 121, 1872
- (27) Hey, J. S. 1973, in “The Evolution of Radio Astronomy” (London: Elek Science), p15
- (28) Hjellming, R. M. 1998, in Galactic and Extragalactic Radio Astronomy, ed. G. L. Verschuur & K. I. Kellerman (Berlin: Springer), p381
- (29) Hog, E. et al. 1997, A&A 323, L57
- (30) Hook, I. M, McMahon, R. G., Boyle, B. J. & Irwin, M. J. 1994, MNRAS, 268, 305.
- (31) Hook, I. M., McMahon, R. G., Irwin, M. J., & Hazard, C. 1996, MNRAS, 282, 1274
- (32) Hook, I. M., Becker, R. H., McMahon, R. G., & White, R. L. 1998, MNRAS, 297, 1115
- (33) Hopkins, A. Mobasher, B., Cram, L., & Rowan-Robinson, M. 1998, MNRAS, 296, 839
- (34) Humphreys, R. M., Landau, R. L., Ghigo, F. D., Zumach, W., LaBonte, A. E. 1991, AJ, 102, 395
- (35) Irwin, M. J. 1985, MNRAS, 214, 575
- (36) Irwin, M. 1994, IAU Commission 9 Newsletter, 5, 25.
- (37) Johnston, K. et al. 1995, AJ, 110, 880
- (38) Kron, R. G., Koo, D. C., & Windhorst, R. A. 1985, A&A, 146, 38
- (39) Kibblewhite, E. J., Bridgeland, M. T., Bunclark, P. S. & Irwin, M. J. 1984, Astronomical Microdensitometry Conference NASA CP-2317, ed. Klinglesmith, D. A. (Washington: NASA), p277
- (40) Lu, N. Y., Hoffman, G. L., Salpeter, E. E., & Houck, J. R. 1996, ApJS, 103, 331
- (41) Lund, J., & Dixon, R. 1973, PASP, 85, 230
- (42) Maddox, S. J., Sutherland, W. J., Efstathiou, G. & Loveday, J., 1990a, MNRAS, 243, 692
- (43) Maddox, S. J., Efstathiou, G. & Sutherland, W. J. 1990b, MNRAS, 246, 433.
- (44) Magliocchetti, M., Maddox, S. J., Lahav, O., & Wall, J. V. 1998, MNRAS, 300, 257
- (45) McMahon, R. G., & Irwin, M. J. 1992, in Digitised Optical Sky Surveys, eds. H. T. MacGillivray & E. B. Thomson (Dordrecht: Kluwer), p417
- (46) Metcalfe, N., Fong, R., Shanks, T. 1995, MNRAS, 274, 769
- (47) Minkowski, R. L., & Abell, G. O. 1963, “Stars and Stellar Systems Vol. III, Basic Astronomical Data” (Chicago: University of Chicago Press), p481
- (48) Mitchell, K. J., & Condon, J. J. 1985, AJ, 90, 1957
- (49) Nilson, P. 1973, The Uppsala General Catalogue of Galaxies, (Uppsala Astronomical Observatory, Uppsala)
- (50) Partridge, R. B., Hilldrup, K. C., & Ratner, M. I. 1986, ApJ, 308, 46
- (51) Patnaik, A. R., Browne, I. W. A., Wilkinson, P. N., Wrobel, J. M. 1992, MNRAS, 254, 655
- (52) Pennington, R. L., Humphreys, R. M., Odewahn, S. C., Zumach, W., & Thurmes, P. M. 1993, PASP, 105, 521
- (53) Postman, M., Bucciarelli, B. Sturch, C., Borgman, T. Casalegno, R., Doggett, J., & Costa, E. 1998a, in “New Horizons from Multi-Wavelength Sky Surveys (IAU Symposium 179), ed B. J. McLean, D. A. Golumbeck, J. J. E. Hayes, & H. E. Payne (Amsterdam: Kluwer), p379.
- (54) Postman, M, Lauer, T. R., Szapudi, I., & Oegerle, W. 1998b, ApJ, 506, 33
- (55) Reid, I. N. et al. 1991, PASP, 103, 661
- (56) Refregier, A., Brown, S. T., Kamionkowski, M. Helfand, D. J., Cress, C. M., Babul, A., Becker, R. H., & White, R. L. 1999, in “Cosmology with Wide Field Surveys”, eds. S. Colombi & Y. Mellier (Paris: Editions Frontieres), p209
- (57) Richards, E. A., Kellerman, K. I., Fomalont, E. B., Windhorst, R. A., & Partridge, R. B. 1998, AJ, 116, 1039
- (58) Roser, S., & Bastian, U. 1991, PPM Catalog (Heidelberg: Spektrum Akademisher Verlag)
- (59) Ryle, M. Smith, F G., & Elsmore, B. 1950, MNRAS, 110, 508
- (60) Snellen, I., McMahon, R. G., Hook, I. M., Browne, I. W. 2001, MNRAS, in press (preprint astro-ph/0110136)
- (61) Urban, S. E., Corbin, T. E., Wycoff, G. L. 1998, AJ, 115, 2161
- (62) Veron-Cetty, M.-P. & Veron, P. 1998, A Catalogue of Quasars and Active Nuclei (8th Edition), European Southern Observatory Scientific Report, 18, 1
- (63) Wendker, H. J. 1995, A&AS, 109, 177
- (64) Weistrop, D., Mall, J. V., Fomalont, E. B., & Kellerman, K. I. 1987, AJ, 93, 805
- (65) White, R. L., Becker, R. H., Helfand, D. J., & Gregg, M. D. 1997, ApJ, 475, 479
- (66) White, R. L. et al. 2000, ApJS, 126, 133
- (67) Windhorst, R. A., Kron, R. G., & Koo, D. C. 1984, A&AS, 58, 39
- (68) Windhorst, R. A., Miley, G. K., Owen, F. N., Kron, R. G., & Koo, D. C. 1985, ApJ, 289, 494
| APM Source | ||
|---|---|---|
| Properties | ( arcsec-2) | ( arcsec-4) |
| All matches | 7.58 | 7.10 |
| Stellar on both plates | 1.60 | 0.06 |
| Stellar on at least 1 plate | 5.16 | 3.85 |
| Non-stellar on both plates | 0.41 | 0.13 |
| Non-stellar on at least 1 plate | 2.98 | 3.57 |
| Detected on both plates | 2.56 | 0.51 |
| Detected on only 1 plate | 5.02 | 6.59 |
| Detected only on red plate | 2.60 | 2.76 |
| Detected only on blue plate | 2.43 | 3.83 |
| APM Sources | FIRST Sources | 90% RadiusaaAPM-FIRST separation that encloses 90% of the true associations. | Number of | Number of Chance | Percentage of |
|---|---|---|---|---|---|
| (arcsec) | True MatchesbbEstimated number of true matches within the 90% radius. | CoincidencesccEstimated number of chance background matches within the 90% radius. | False Matches | ||
| All | All | 4.2 | 65400 | 13000 | 16.6% |
| Non-stellarddAPM classification on both and plates. | All | 4.0 | 22600 | 640 | 2.7% |
| StellarddAPM classification on both and plates. | All | 1.7 | 7600 | 520 | 6.3% |
| All | Unresolved | 2.0 | 17800 | 850 | 4.6% |
| Non-stellarddAPM classification on both and plates. | Unresolved | 2.2 | 6200 | 60 | 0.9% |
| StellarddAPM classification on both and plates. | Unresolved | 1.1 | 2300 | 60 | 2.4% |
| Blue-only objects | Red-only objects | |||
|---|---|---|---|---|
| Radius | Completeness | Reliability | Completeness | Reliability |
| (arcsec) | ||||
| 1.0 | 0.56 | 0.93 | 0.46 | 0.98 |
| 2.0 | 0.78 | 0.82 | 0.70 | 0.94 |
| 3.0 | 0.88 | 0.71 | 0.78 | 0.89 |
| 4.0 | 0.94 | 0.60 | 0.84 | 0.83 |
| 5.0 | 0.97 | 0.50 | 0.87 | 0.77 |
| RA | Dec | RA | Dec | Sep | Ecl | Epsf | E | Ocl | Opsf | O | OE | Plate | Maj | Min | PA | ||
|---|---|---|---|---|---|---|---|---|---|---|---|---|---|---|---|---|---|
| (1) | (2) | (3) | (4) | (5) | (6) | (7) | (8) | (9) | (10) | (11) | (12) | (13) | (14) | (15) | (16) | (17) | (18) |
| 08 00 00.099 | +32 06 09.80 | 1.86 | 0.23 | 1.87 | 1 | 2.49 | 20.72 | 1 | 0.31 | 21.88 | 1.16 | 1344 | 1.10 | 1.09 | 3.0 | 2.7 | 173.9 |
| 08 00 00.234 | +43 45 30.57 | 0.56 | 0.21 | 0.59 | 1 | 0.07 | 20.22 | 0 | 0.00 | 22.17 | 9.99 | 1329 | 8.52 | 9.27 | 2.1 | 1.0 | 105.7 |
| 08 00 00.243 | +22 26 24.80 | 0.56 | 0.38 | 0.67 | 1 | 5.09 | 19.77 | 0 | 0.00 | 21.85 | 9.99 | 226 | 1.21 | 1.05 | 1.5 | 3.0 | 179.1 |
| 08 00 00.397 | +44 39 14.16 | 2.00 | 0.17 | 2.00 | 0 | 0.00 | 20.76 | 1 | 0.24 | 21.31 | 9.99 | 1317 | 19.48 | 22.0 | 2.3 | 1.5 | 80.0 |
| 08 00 00.752 | +32 46 50.87 | 0.14 | 0.77 | 0.78 | 1 | 4.60 | 19.54 | 2 | 3.11 | 22.46 | 2.91 | 989 | 4.20 | 3.90 | 1.1 | 1.7 | 67.1 |
| 08 00 01.358 | +47 01 38.37 | 0.16 | 0.16 | 0.23 | 0 | 0.00 | 20.76 | 1 | 0.97 | 22.23 | 9.99 | 1317 | 2.68 | 3.12 | 2.2 | 2.2 | 90.3 |
| 08 00 02.263 | +51 36 09.10 | 0.31 | 0.30 | 0.43 | 1 | 13.85 | 12.08 | 2 | 47.05 | 15.00 | 2.92 | 985 | 1.49 | 1.75 | 4.2 | 2.0 | 36.6 |
| 08 00 02.302 | +31 17 20.98 | 2.27 | 1.38 | 2.65 | 1 | 0.11 | 20.48 | 1 | 2.85 | 22.21 | 1.73 | 1344 | 2.16 | 2.73 | 3.3 | 2.1 | 169.9 |
| 08 00 02.515 | +35 49 27.12 | 2.02 | 4.07 | 4.54 | 1 | 1.52 | 18.88 | 1 | 0.96 | 21.40 | 2.52 | 989 | 1.09 | 0.87 | 2.2 | 3.6 | 132.4 |
| 08 00 02.702 | +22 48 54.11 | 0.79 | 0.66 | 1.03 | 2 | 24.52 | 17.29 | 1 | 3.15 | 21.62 | 4.33 | 226 | 1.87 | 2.91 | 5.3 | 2.6 | 94.6 |
| 08 00 02.932 | +27 17 27.51 | 0.64 | 0.46 | 0.79 | 1 | 0.80 | 20.48 | 1 | 0.40 | 20.77 | 0.29 | 1344 | 5.37 | 5.56 | 1.3 | 0.6 | 0.4 |
| 08 00 03.250 | +36 29 42.11 | 0.46 | 0.14 | 0.48 | 1 | 3.68 | 19.67 | 0 | 0.00 | 22.18 | 9.99 | 989 | 46.71 | 58.72 | 3.7 | 1.5 | 21.6 |
| 08 00 03.460 | +50 30 05.76 | 0.39 | 0.16 | 0.42 | 1 | 2.15 | 20.23 | 1 | 2.61 | 22.41 | 2.17 | 985 | 1.07 | 0.98 | 0.5 | 2.2 | 0.8 |
| 08 00 04.050 | +23 26 16.30 | 2.87 | 1.68 | 3.32 | 2 | 19.81 | 9.92 | 2 | 21.84 | 11.49 | 1.56 | 226 | 6.00 | 6.23 | 1.1 | 1.0 | 180.0 |
| 08 00 04.378 | +46 09 59.44 | 0.83 | 0.08 | 0.84 | 1 | 7.16 | 18.45 | 1 | 1.89 | 22.31 | 3.86 | 1317 | 2.01 | 2.76 | 4.2 | 2.3 | 134.0 |
| 08 00 04.981 | +28 06 08.29 | 2.43 | 0.54 | 2.49 | 2 | 67.99 | 14.50 | 1 | 23.40 | 18.21 | 3.71 | 1344 | 1.02 | 1.55 | 4.1 | 3.8 | 90.5 |
| 08 00 05.237 | +50 10 23.62 | 0.44 | 0.16 | 0.47 | 1 | 1.15 | 18.93 | 0 | 0.00 | 22.28 | 9.99 | 1317 | 3.09 | 3.88 | 5.3 | 2.4 | 60.1 |
| 08 00 05.463 | +32 11 23.10 | 0.43 | 0.77 | 0.88 | 1 | 7.23 | 20.30 | 0 | 0.00 | 21.83 | 9.99 | 1344 | 2.92 | 3.14 | 2.5 | 1.2 | 23.0 |
| 08 00 06.509 | +43 09 53.78 | 1.72 | 2.62 | 3.14 | 2 | 8.95 | 20.09 | 0 | 0.00 | 22.17 | 9.99 | 1329 | 2.69 | 2.07 | 2.3 | 2.8 | 138.3 |
| 08 00 06.555 | +32 01 47.98 | 0.85 | 0.40 | 0.94 | 2 | 10.27 | 20.44 | 0 | 0.00 | 21.83 | 9.99 | 1344 | 1.12 | 0.72 | 2.0 | 3.9 | 144.3 |
| 08 00 07.243 | +25 22 19.95 | 0.36 | 0.19 | 0.41 | 1 | 0.29 | 19.99 | 1 | 0.09 | 20.40 | 0.40 | 226 | 20.86 | 38.93 | 7.7 | 2.0 | 127.2 |
| 08 00 09.613 | +38 06 50.00 | 0.52 | 0.72 | 0.89 | 1 | 2.07 | 21.03 | 0 | 0.00 | 22.18 | 9.99 | 989 | 1.05 | 1.39 | 5.5 | 2.0 | 141.9 |
| 08 00 09.892 | +44 36 45.86 | 1.85 | 2.50 | 3.11 | 1 | 0.11 | 20.60 | 0 | 0.00 | 22.28 | 9.99 | 1317 | 1.21 | 1.36 | 6.5 | 3.7 | 24.4 |
| 08 00 10.262 | +41 20 36.84 | 1.42 | 1.72 | 2.23 | 0 | 0.00 | 20.84 | 1 | 8.15 | 22.12 | 9.99 | 1329 | 1.36 | 0.80 | 3.3 | 3.6 | 91.9 |
| 08 00 10.571 | +34 02 20.90 | 0.19 | 0.93 | 0.95 | 1 | 1.24 | 19.27 | 2 | 6.19 | 22.30 | 3.03 | 989 | 1.60 | 3.45 | 8.9 | 2.7 | 180.0 |
| 08 00 10.974 | +24 09 03.42 | 3.57 | 2.23 | 4.21 | 1 | 7.99 | 18.30 | 1 | 7.09 | 20.28 | 1.98 | 226 | 2.31 | 2.34 | 2.5 | 2.1 | 6.0 |
| 08 00 11.108 | +33 14 27.82 | 0.03 | 0.71 | 0.71 | 1 | 2.39 | 21.05 | 0 | 0.00 | 22.18 | 9.99 | 989 | 11.21 | 11.67 | 1.4 | 0.7 | 4.3 |
| 08 00 11.197 | +30 31 48.00 | 0.28 | 1.17 | 1.21 | 1 | 3.24 | 20.41 | 0 | 0.00 | 21.83 | 9.99 | 1344 | 26.07 | 25.93 | 0.4 | 0.7 | 110.6 |
| 08 00 12.213 | +22 49 27.46 | 0.02 | 1.88 | 1.88 | 1 | 0.29 | 19.97 | 0 | 0.00 | 21.85 | 9.99 | 226 | 1.37 | 2.14 | 4.3 | 3.9 | 87.2 |
| 08 00 12.515 | +26 22 16.93 | 2.49 | 0.59 | 2.56 | 0 | 0.00 | 20.26 | 1 | 2.03 | 20.53 | 9.99 | 226 | 26.25 | 27.72 | 1.3 | 1.3 | 180.0 |
| 08 00 12.603 | +45 39 23.51 | 3.34 | 3.24 | 4.66 | 2 | 7.07 | 20.19 | 0 | 0.00 | 22.28 | 9.99 | 1317 | 1.97 | 3.15 | 4.3 | 4.1 | 0.2 |
| Position | Area | Sources | Suggested Identifications | ReferenceeeReferences: 1. Condon, Condon, & Hazard 1982; 2. Windhorst, Kron, & Koo 1984; Kron, Koo, and Windhorst 1985; 3. Condon & Mitchell 1984; 4. Mitchell & Condon 1985; 5. Windhorst et al. 1985; 6. Coleman, Condon, & Hazard 1985; 7. Partridge, Hilldrup & Ratner 1986; 8. Weistrop et al. 1987; 9. Benn et al. 1988; 10. Condon, Dickey, & Salpeter 1990; 11. Lu et al. 1996; 12. Fomalont et al. 1991; 13. Richards et al. 1998; 14. deRuiter et al. 1997; 15. Hopkins et al. 1998; 16. Georgakakis et al. 1998. | ||||
|---|---|---|---|---|---|---|---|---|
| (1950) | (deg2) | (mJy) | (1–30 mJy) | POSS-I | Fainter | Total | ||
| 1204+1130 | 9.0 | 102 | 21 | – | 21 | 1 | ||
| 1306+2900 | ||||||||
| 1718+5000 | 5.5 | 0.6 | 240 | 45 | 100 | 145 | 2 | |
| 0014+1530 | ||||||||
| 0840+4440 | ||||||||
| 0852+1716 | 0.44aaPartial overlap with the sample of reference 6 | 0.1 | 37 | 11 | 0 | 11 | 3 | |
| 1300+3034 | 0.44 | 0.1 | 40 | 7 | 5 | 18 | 4 | |
| bbPartial overlap with sample of reference 2 | 0.6 | 66 | 11 | 14 | 25 | 5 | ||
| 0854+1730 | 9.0 | 6.0 | 130 | 31 | 0 | 31 | 6 | |
| 1204+1130 | ||||||||
| 0310+8008 | 0.13 | 1.0cc6 cm survey; fluxes translated to 20 cm using | 14 | 3 | 0 | 3 | 7 | |
| 1635+6620 | 0.13 | |||||||
| 0015+1533 | 0.01 | 0.3cc6 cm survey; fluxes translated to 20 cm using | 13 | 1 | 3 | 4 | 8 | |
| NGP | 12.57 | 168 | 31 | 35 | 66 | 9 | ||
| 0927+4710 | 12.0 | 329 | 53 | 4 | 57 | 10, 11 | ||
| 1416+5242 | 0.5 | 0.03cc6 cm survey; fluxes translated to 20 cm using | 6 | 1 | 1 | 2 | 12 | |
| HDF | 0.02 | 0.02dd3.6 cm survey; fluxes translated to 20 cm using | 5 | 0 | 4 | 4 | 13 | |
| Lockman Hole | 0.35 | 0.12 | 28 | 5 | 1 | 6 | 14 | |
| Phoenix Deep | 3.0 | 0.10 | 270 | 50 | 12 | 62 | 15, 16 | |
| Totals: | 53.1 | 1448 | 270 = 18.6% | 455 | ||||
| This work: | 4150 | 1.0 | 357,985 | 65,400ff65,400 is the number of 90%-confident identifications given in Table 2; it does not include lower confidence associations or objects identified with double radio sources, which boost the number of suggested identifications to . = 18.3% | 65,400 | |||