11email: bettoni@pd.astro.it, falomo@pd.astro.it, fasano@pd.astro.it, salvo@pd.astro.it
(2)Istituto di Radioastronomia di Bologna and Dipartimento di Astronomia, Universitá di Bologna 11email: fgovoni@ira.bo.cnr.it
(3)European Southern Observatory 11email: rscarpa@eso.org
The fundamental plane of radio galaxies††thanks: Based on observations collected at European Southern Observatory, La Silla, Chile.
We collected photometrical and dynamical data for 73 low red-shift (z0.2) Radio Galaxies (LzRG) in order to study their Fundamental Plane (FP). For 22 sources we also present new velocity dispersion data, that complement the photometric data given in our previous study of LzRG (Govoni et. al. 2000a). It is found that the FP of LzRG is similar to the one defined by non-active elliptical galaxies, with LzRG representing the brightest end of the population of early type galaxies. Since the FP mainly reflects the virial equilibrium condition, our result implies that the global properties of early–type galaxies (defining the FP) are not influenced by the presence of gas accretion in the central black hole. This is fully in agreement with the recent results in black hole demography, showing that virtually all luminous spheroidal galaxies host a massive black hole and therefore may potentially become active. We confirm and extend to giant ellipticals the systematic increase of the mass-to-light ratio with galaxy luminosity.
Key Words.:
galaxies, radio-galaxies1 Introduction
It is well known that the global properties of early–type galaxies are fairly well described through a three dimensional space of observables which, besides the effective radius and the corresponding average surface brightness , involves the central velocity dispersion (Djorgovski & Davis 1987, Dressler et. al. 1987). In fact, ellipticals and lenticulars are found to lie in a surprisingly tight, linear region of this space (the so called Fundamental Plane; hereafter FP) that has been shown to be close to the plane defining the virial equilibrium condition over the assumption of a rigorous homology among galaxies (Faber et. al. 1989).
The systematic deviation of the FP from the one defined by the virial equilibrium, has been interpreted as due to changes of the Mass to Light ratio (M/L) (due to different stellar content or to differences in dark matter distribution; Pahre et. al. 1995, Mobasher et. al. 1999), as well as to the breakdown of the homology assumption (e.g. kinematic anisotropy; Caon et. al. 1993, Graham et. al. 1996, Ciotti et. al. 1996, Busarello et. al. 1997). In this context it is therefore important to determine whether the FP has universal validity among ellipticals. In particular it is not yet clear if active and non-active galaxies do follow the same FP, as it would be expected in view of the recent results on Black Holes (BH) demography in galaxies (Gebhardt et. al. 2000, Ferrarese & Merritt 2000).
A relevant case is that of low redshift extragalactic radio sources that are associated with massive early–type galaxies. A number of optical studies have been carried out in the last decade to investigate the relationship between radio emission properties and the characteristics of the host galaxies (see e.g. Govoni et. al. 2000a and references therein). Comparison of the optical properties of radio galaxies with those of normal (non radio) ellipticals have shown that the probability to exhibit radio emission increases with the optical luminosity of the galaxies (Scarpa & Urry 2001) and also that the radio morphology (typically classes FR I and FR II) may depend on the absolute magnitude of the host galaxy (Owen & Laing 1989; Owen & White 1991). This could be related to the different BH mass (proportional to the galaxy luminosity) and to the jet power (Ghisellini & Celotti 2001).
As a whole, these studies have shown that the optical morphological/structural and photometrical properties of radio and non-radio ellipticals are remarkably similar, suggesting that all ellipticals may go through a phase of nuclear activity lasting for a small fraction of the total life of the galaxy.
Few previous observations were devoted to investigation of the dynamical properties of Radio Galaxies (RG). Apart a very small number (11) of radio sources included in the original work on the FP of ellipticals by Faber et. al. (1989) (hereafter FA89), only Smith, Heckman & Illingworth (1990; hereafter SHI90) performed a systematic study on the stellar dynamics of Powerful Radio Galaxies (PRG). They compared , and measurements for a compilation of PRG with the distribution in the FP of the bright ellipticals studied by FA89, concluding that the FP of PRG is consistent with that of normal ellipticals. However they also found evidence for smaller than normal velocity dispersions and significant rotational support in galaxies with marked morphological peculiarity.
In this paper we present a much deeper investigation of the FP of radio galaxies, based on a sample of 73 radio galaxies. The data are in part new (22 objects) and in part collected from the literature (51 objects). Most of literature values were derived from the Hypercat database (Prugniel & Maubon 2000). All values of , , and have been processed in order to make them homogeneous to a common standard (see Sec 4.2). Throughout the paper we assume =50km Mpc-1 and =0.
2 Observations and data analysis
We obtained medium resolution optical spectra of RG selected from the brightest (15) objects in the sample of 79 LzRG previously imaged, in the R filter, by us (Fasano et. al. 1996, Govoni et. al. 2000a,b). These observations were aimed at deriving the velocity dispersion from stellar absorption lines. In Table 1 we give the list of the objects observed together with exposure times and position angles used for the observations.
Optical spectroscopy was obtained in March/April 1998 and November 1998 with the ESO/Danish 1.52 m telescope at La Silla, using the Danish Faint Object Spectrograph and Camera (DFOSC). We used a CCD Loral/Lesser, with 2052 2052 pixels combined with an Echelle Grism of 316 grooves/mm yielding a velocity resolution (FWHM) of 71 km (for a slit 1″ wide) in the range =4800-5800 Å. A long slit, 2.0″ wide and centered on the galaxy, was oriented along the apparent major axis of the radio galaxy. With this configuration we reach a velocity dispersion resolution =60 km; the scale perpendicular to the dispersion is 0.39″/pixel. Template reference spectra of standard stars of spectral type from G8-III to K1-III, with low rotational velocity (V17 km), were secured at the beginning and at the end of each night. During the observations the seeing ranged between 1″ and 1.5″.
| Object | z | Exptime | |||
|---|---|---|---|---|---|
| (2000) | (2000) | sec | |||
| 0055-016 | 00 57 35 | -01 23 28 | 0.045 | 4800 | 90 |
| 0131-360 | 01 33 58 | -36 29 35 | 0.030 | 3600 | 90 |
| 0257-398 | 02 59 27 | -39 40 37 | 0.066 | 4800 | 120 |
| 0312-343 | 03 14 33 | -34 07 40 | 0.067 | 3600 | 145 |
| 0325+024 | 03 27 54 | +02 33 42 | 0.030 | 3600 | 155 |
| 0449-175 | 04 51 21 | -17 30 14 | 0.031 | 3600 | 180 |
| 0546-329 | 05 58 27 | -32 58 37 | 0.037 | 3000 | 180 |
| 0548-317 | 05 50 49 | -31 44 26 | 0.034 | 3600 | 180 |
| 0718-340 | 07 20 47 | -34 07 05 | 0.029 | 7200 | 75 |
| 0915-118 | 09 18 06 | -12 05 43 | 0.054 | 4800 | 43 |
| 0940-304 | 09 42 23 | -30 44 11 | 0.038 | 7200 | 87 |
| 1043-290 | 10 46 10 | -29 21 10 | 0.060 | 7200 | 180 |
| 1107-372 | 11 09 57 | -37 32 17 | 0.010 | 3600 | 32 |
| 1123-351 | 11 25 53 | -35 23 40 | 0.032 | 6000 | 85 |
| 1251-122 | 12 54 40 | -29 13 39 | 0.015 | 3600 | 17 |
| 1333-337 | 13 36 39 | -33 57 56 | 0.013 | 3600 | 60 |
| 1400-337 | 14 03 39 | -33 58 43 | 0.014 | 3600 | 84 |
| 1404-267 | 14 07 29 | -27 01 02 | 0.022 | 4800 | 105 |
| 1514+072 | 15 16 45 | +07 01 17 | 0.035 | 4800 | 5 |
| 1521-300 | 15 24 33 | -30 12 20 | 0.020 | 5400 | 60 |
| 2236-176 | 22 39 11 | -17 20 28 | 0.070 | 4800 | 124 |
| 2333-327 | 23 36 07 | -32 30 30 | 0.052 | 4800 | 173 |
-
a)
Slit position angle in degrees from North toward East
Optical spectra were reduced using standard procedures available in the IRAF package and includes bias subtraction, flat fielding, and wavelength calibration. The accuracy of the latter procedure was checked with measurements of the night sky = 5577.32 Å emission line. In all cases a precision of 20 km was reached. In order to increase the signal to noise and to match the observed spatial resolution (assuming the mean seeing) with the plate scale across dispersion, the spectra were rebinned over three pixels perpendicular to the dispersion, obtaining an effective spatial resolution of 1.17″/pixel. The observed spectral range includes the band (= 5175.4 Å), the E-band (5269 Å) and the FeI line (5335 Å).
The systemic velocity, corrected to the Sun, and the velocity dispersion were determined using the Fourier Quotient method (Sargent et. al. 1977, Bertola et. al. 1984). The spectra were first normalized by subtracting the continuum, converted to a logarithmic scale and then multiplied to a cosine bell function that apodizes 10% of the pixels at each end of the spectrum. This forces the ends of the spectra smoothly to zero. Finally the Fourier Transform of the galaxy spectra were divided by the Fourier Transform of a template star whose spectra (late G and early K spectral type) matched that of the galaxy. These spectra are used as templates of zero velocity dispersion.
The best-fit stellar template then yields a profile of the velocity dispersion and the stellar velocity curve with relative errors for the galaxy. The of the determinations obtained with different template stars turned out to be less than 20 km for and 10 km for the systemic radial velocity . The average values of these determinations were adopted as final values of and .
Since early-type galaxies exhibit some gradients in the radial velocity and velocity dispersion (Davies et. al. 1983, Fisher et. al. 1995), the derived ‘central’ parameter depends on the distances of the galaxies and the size of the aperture used for the observation. In order to compare our velocity dispersions with the data available in the literature we applied aperture corrections according to the procedure given by Jørgensen et. al. (1995). The individual measurements of are therefore corrected to a circular aperture with a metric diameter of 1.19 kpc , equivalent to 3.4″ at the distance of the Coma cluster.
For 8 of the 22 RGs observed previous determinations of the velocity dispersion were found in the Hypercat database. The comparison between our and previous measurements of is shown in Figure 1. When more than one measurement of is present in the literature, we took the mean value quoted by Hypercat. The average difference between our and Hypercat values of is:
- = 46.4 km; = 18 km
Additional notes on individual galaxies are given in the Appendix.

| name | log | log | log | ||
|---|---|---|---|---|---|
| kpc | km | km | |||
| 0055-016 | 19.98 | 1.102 | 2.48 | 0.11 | 13593 |
| 0131-360 | 20.16 | 1.145 | 2.40 | 0.17 | 8771 |
| 0257-398 | 19.25 | 0.872 | 2.34 | 0.16 | 19814 |
| 0312-343 | 21.25 | 1.352 | 2.41 | 0.07 | 20516 |
| 0325+024 | 21.46 | 1.301 | 2.34 | 0.12 | 9875 |
| 0449-175 | 20.50 | 1.163 | 2.20 | 0.15 | 9548 |
| 0546-329 | 20.47 | 1.267 | 2.59 | 0.34 | 11100 |
| 0548-317 | 20.34 | 0.988 | 2.09 | 0.48 | 10352 |
| 0718-340 | 19.70 | 1.043 | 2.52 | 0.50 | 9578 |
| 0915-118 | 20.90 | 1.342 | 2.44 | 0.07 | 16171 |
| 0940-304 | 19.72 | 0.973 | 2.59 | 0.20 | 12610 |
| 1043-290 | 21.80 | 1.572 | 2.36 | 0.18 | 19527 |
| 1107-372 | 19.66 | 1.093 | 2.47 | 0.09 | 3362 |
| 1123-351 | 20.95 | 1.382 | 2.65 | 0.84 | 10632 |
| 1258-321 | 20.40 | 1.237 | 2.42 | 0.12 | 5553 |
| 1333-337 | 19.76 | 1.139 | 2.46 | 0.56 | 4122 |
| 1400-337 | 20.70 | 1.408 | 2.49 | 0.20 | 4567 |
| 1404-267 | 20.70 | 1.210 | 2.47 | 0.06 | 7187 |
| 1514+072 | 21.89 | 1.620 | 2.43 | 0.12 | 11130 |
| 1521-300 | 19.60 | 0.563 | 2.22 | 0.02 | 6579 |
| 2236-176 | 21.33 | 1.492 | 2.39 | 0.15 | 22396 |
| 2333-327 | 19.86 | 1.022 | 2.43 | 0.03 | 15707 |
Table 2 reports our measurements of and the estimated
uncertainities, together with the parameters and
, taken from Govoni et. al. (2000a), that are relevant
to construct the FP. The average surface brightness has been
evaluated from the formula:
= RT + 5log(r) + 2.5log(2),
where RT is the total R apparent magnitude and r is the effective radius. All these quantities are corrected for the contribution of the point source (see Govoni et al. 2000b), for cosmological dimming and for –correction according to Poggianti (1997). The distance/systemic velocities used to derive and are relative to the Cosmic Microwave Background (CMB) reference frame and come from the Lyon Meudon Extragalactic Database (LEDA, Paturel et. al. 1997).
3 Extended sample of LzRG
We have collected from the literature stellar velocity dispersion measurements of LzRGs for which photometric and structural parameters are also available. To make these data homogenous with our measurements we processed them applying the same procedure adopted for our subsample of LzRG (see above section and Govoni et. al. 2000b).
We excluded from the analysis the radio galaxies belonging to dumbbell systems or close galaxy pairs, as well as those having recession velocity (corrected to CMB) less than 3000 km, since these circumstances may induce significant uncertainties in the parameters considered.
3.1 Previous work on the Fundamental Plane of LzRGs
An early investigation of the FP of LzRG was undertaken by FA89 in their study of early-type galaxies. They give and (in the B band), as well as for 11 RGs. However 6 objects are dumbbell systems or have small recession velocity and for this reason are not considered in our analysis. For the remaining 5 we obtained in the R band applying a color correction based on the integrated color (B-R) obtained from Hypercat.
The first systematic study of the FP of RGs was performed by Smith, Heckman & Illingworth (1990, SHI90) who reported kinematical and photometrical data for 20 powerful radio galaxies previously imaged in the V band (Smith & Heckman 1989, hereafter SH89), as well as for 16 more galaxies from Heckman et. al. (1985). Among the latter ones, only 7 are supplied with complete photometric information, whereas 5 objects, out of the remaining 27 in the total sample, turn out to belong to dumbbell systems or close pairs. This reduces the usable sample of SHI90 to 22 objects available for FP analysis. In order to derive consistently with our definitions (see above formula) we used their isophotal magnitudes V25 and the effective radii reported in SH89 (Table 8) and applied a correction of -0.16 (average difference between mtot and m24.5 in our study of RG; Govoni et. al. 2000b) to obtain total magnitudes. Then we corrected for the color term (V-R) using the colors from SH89, when available, or assuming (V-R)=0.55 in the other cases.
3.2 Additional data for the Fundamental Plane of LzRG
In order to improve the statistics of our analyses, we have searched the literature for additional LzRG that have measurements of velocity dispersion, and . We have combined photometric data of LzRGs from the studies of Ledlow & Owen (1995, LO95) and Gonzalez-Serrano & Carballo (2000, GC00) whith the velocity dispersions given by Wegner et. al. (1999, EFAR) or by Hypercat.
The cross identification betwen LO95 and EFAR added 17 new LzRGs to our compilation, whereas that between GC00 and Hypercat adds 7 more LzRGs. In both cases, in order to derive consistently with our definitions, we used the magnitudes and the effective radii given in the original papers and applied the same corrections as for the data of SHI90.
In total, the sample of LzRG for which we collected data from the literature consists of 51 objects. The relevant data for these objects are given in Tables 3 and 4. These, together with the sample for which we present new data, leads to a total of 73 LzRG, and represents the largest dataset of photometric and spectroscopic data on Radio Galaxies till now.
3.3 Comparison sample of non-radio elliptical galaxies
In order to compare the FP of LzRGs with that of normal galaxies, we used the sample of radio-quiet early–type galaxies studied by Jørgensen et. al. (1996, JFK96). It is by far the richest, still homogeneous sample for which both photometric and kinematic information is available. Previous samples of early type galaxies used to describe the FP (e.g. FA89) have a significantly larger scatter with respect to the data of JFK96. Since the JFK96 sample consists of cluster galaxies, it has also the advantage of the reliability of the distance determination.
To compare our data on LzRG with the JFK96 data, we converted their Gunn photometry to the R band, by means of the average relation =0.3, given in Jørgensen (1994).
| name | log | log | ||
| km | kpc | km | ||
| Smith et. al. (1990) | ||||
| 3C29 | 2.318 | 1.180 | 20.29 | 13400 |
| 3C31 | 2.394 | 1.183 | 20.79 | 5007 |
| 3C33 | 2.362 | 1.066 | 20.43 | 17840 |
| 3C62 | 2.436 | 1.264 | 21.07 | 44370 |
| 3C76.1 | 2.301 | 0.784 | 19.28 | 9713 |
| 3C78 | 2.417 | 1.094 | 19.44 | 8634 |
| 3C84 | 2.391 | 1.234 | 20.37 | 5156 |
| 3C88 | 2.276 | 1.370 | 21.93 | 9054 |
| 3C89 | 2.398 | 1.610 | 22.51 | 41550 |
| 3C98 | 2.238 | 1.020 | 20.84 | 9174 |
| 3C120 | 2.301 | 1.146 | 20.51 | 10010 |
| 3C192 | 2.283 | 0.940 | 20.06 | 17930 |
| 3C196 | 2.322 | 1.464 | 21.23 | 59360 |
| 3C223 | 2.305 | 1.192 | 21.03 | 41010 |
| 3C293 | 2.267 | 0.876 | 18.99 | 13550 |
| 3C305 | 2.250 | 0.744 | 18.13 | 12470 |
| 3C338 | 2.462 | 1.562 | 21.48 | 9084 |
| 3C388 | 2.562 | 1.643 | 21.86 | 27220 |
| 3C444 | 2.190 | 1.763 | 22.62 | 45870 |
| 3C449 | 2.350 | 1.423 | 22.83 | 5126 |
| PKS0634-206 | 2.290 | 0.878 | 18.70 | 16790 |
| PKS2322-122 | 2.350 | 1.477 | 21.62 | 24610 |
| Faber et. al. (1989) | ||||
| NGC315 | 2.493 | 1.414 | 20.58 | 5126 |
| NGC741 | 2.447 | 1.415 | 20.99 | 5546 |
| NGC4839 | 2.387 | 1.311 | 21.41 | 6955 |
| NGC7626 | 2.511 | 1.044 | 20.85 | 7615 |
| 3C40 | 2.233 | 0.640 | 18.18 | 5426 |
| name | log | log | ||
| kpc | km/sec | |||
| Ledlow & Owen (1995)+ EFAR/Hypercat | ||||
| 0039-095B | 2.447 | 0.362 | 17.69 | 16604 |
| 0053-015 | 2.473 | 1.186 | 20.46 | 11459 |
| 0053-016 | 2.396 | 0.866 | 19.57 | 12798 |
| 0110+152 | 2.292 | 1.253 | 20.96 | 13137 |
| 0112-000 | 2.401 | 0.799 | 19.63 | 13582 |
| 0112+084 | 2.562 | 1.500 | 21.35 | 14740 |
| 0147+360 | 2.384 | 0.601 | 18.57 | 5227 |
| 0306+237 | 2.396 | 0.811 | 19.18 | 20122 |
| 0431-133 | 2.430 | 1.382 | 21.02 | 9825 |
| 0431-134 | 2.346 | 0.714 | 19.39 | 10393 |
| 1510+076 | 2.526 | 0.455 | 18.45 | 12927 |
| 1514+072 | 2.393 | 1.664 | 22.17 | 10308 |
| 1520+087 | 2.342 | 1.497 | 21.85 | 10223 |
| 1602+178A | 2.328 | 0.849 | 20.01 | 9350 |
| 1610+296 | 2.508 | 0.814 | 18.76 | 9602 |
| 2322+143a | 2.310 | 0.550 | 18.96 | 13381 |
| 2335+267 | 2.538 | 1.349 | 20.71 | 9060 |
| Gonzalez-Serrano & Carballo (2000)+ Hypercat | ||||
| NGC507 | 2.517 | 1.005 | 19.72 | 4621 |
| NGC708 | 2.382 | 1.385 | 21.58 | 4498 |
| gin116 | 2.455 | 1.021 | 19.80 | 9791 |
| NGC4869 | 2.299 | 0.788 | 19.58 | 6895 |
| NGC4874 | 2.425 | 1.487 | 21.22 | 7428 |
| NGC6086 | 2.508 | 1.181 | 20.57 | 9534 |
| NGC6137 | 2.47 | 1.506 | 20.66 | 9348 |
4 The Fundamental Plane of radiogalaxies
In order to derive the parameters describing the FP:
| (1) |
we minimized the root square of the residuals perpendicular to the plane. This procedure is to be preferred with respect to the classical one (minimizing the root square of the residuals along a given axis) when there are measurement errors in all observed quantities. It is also slightly different from that used by JFK96, which minimizes the sum of the absolute residuals perpendicular to the plane.
In Table 5 the FP coefficients , and obtained using this fitting procedure for different subsamples of radio and non radio galaxies are reported. Since the adopted fitting procedure does not provide analytical form for the uncertainties of the parameters, we indicate in Table 5 the 1 uncertainties computed according to the classical formalism and assuming the values of the FP coefficients given in the table.
Each sample in the table is indicated with a capital letter and the fits obtained merging together two or more samples are indicated with sequences of letters, according to the previous correspondence (for instance JO means JFK96+This Work).
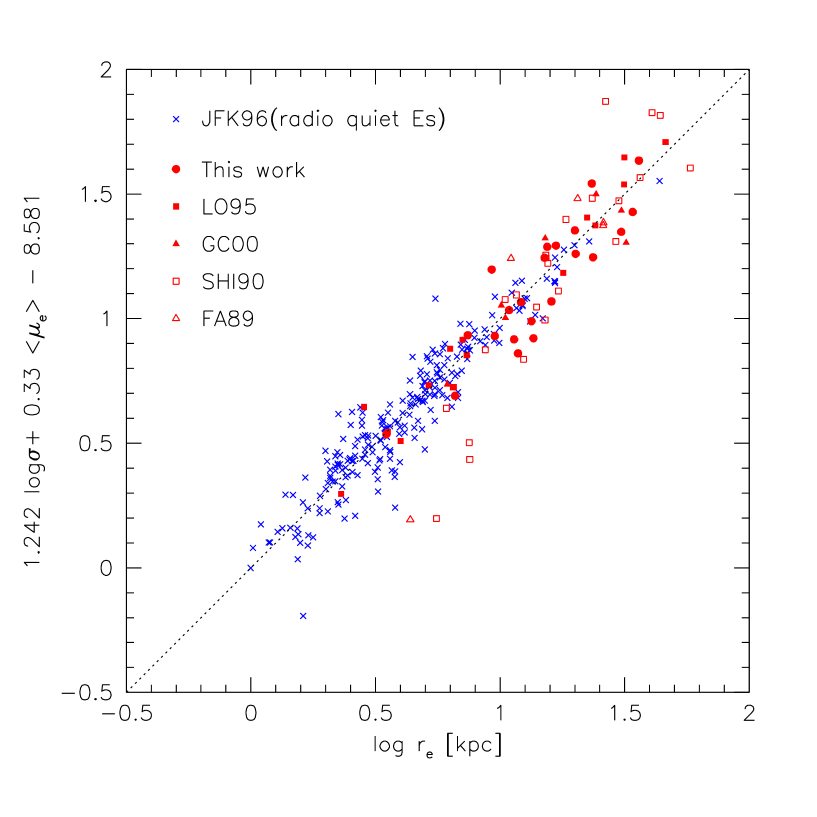
We note from Table 5 that, in spite of the slightly different fitting procedure, the FP coefficients we found for the JFK96 sample of radio-quiet galaxies (our comparison sample) are indistinguishable from those given in the original JFK96 paper (see their equation [1]). In Figure 2 we plot all the galaxies in the above described samples, together with our FP fit of non radio ellipticals (JFK96).
From Table 5 the FP coefficients derived from our sample of 22 radio-galaxies turn out to be consistent (within 1 of the estimated uncertainties) with those relative to the control sample of non radio galaxies. The same happens for the 17 radio-galaxies in the L095 sample. On the contrary, fitting the SHI90 sample of 22 radio-galaxies yields FP coefficients different (well beyond 3) from those relative to the comparison sample. This is likely to be due to the presence of a few outliers in their galaxy sample, as shown in Figure 2. Finally, given the small size of FA89 and GC00 samples a reliable estimates of the FP can not be derived from them. Nevertheless, we have reported in Table 5 the coefficients resulting from the formal fit of these samples. In the case of the GC00 sample, they are consistent with those relative to the control sample, whereas considerable differences (again caused by the presence of an outlier) come in the case of the FA89 sample.
In Table 5 we also report the fits obtained merging together two or more galaxy samples. Among them, we assume as representative of the global FP of elliptical galaxies, the fit:
| (2) |
which includes the comparison sample (JFK96) and the radio samples from this work(O), from LO95(L) and from GC00(G). This fit allows to extend the FP up to the bright end of the luminosity function of early–type galaxies.
The M/L ratio is a function of the stellar population and dark matter content of galaxies. In Figure 3 we show the relation between the Mass to Light ratio (M/L) and the velocity dispersion . We derived the masses of our galaxies by using the relation M=5/G (Bender et. al. 1992). This figure indicates that LzRGs follow the same relation found for normal elliptical galaxies. The scatter of the M/L ratio as a function of log is 0.2dex, similar to that found by JFK96.

| Sample | rms | ||||
|---|---|---|---|---|---|
| J (JFK96) | 229 | 1.240.04 | 0.3300.007 | 8.580.06 | 0.059 |
| O (This Work) | 22 | 1.360.23 | 0.2950.031 | 8.150.23 | 0.071 |
| L (LO95) | 17 | 1.240.23 | 0.3110.015 | 8.210.18 | 0.047 |
| G (GC00) | 7 | 2.550.74 | 0.3110.073 | 11.370.53 | 0.055 |
| S (SHI90) | 22 | 2.600.31 | 0.1610.021 | 8.190.26 | 0.070 |
| F (FA89) | 5 | 2.310.48 | 0.0720.043 | 5.860.50 | 0.030 |
| OLG | 46 | 1.580.16 | 0.310 0.015 | 8.990.15 | 0.063 |
| OLGSF | 74 | 1.920.15 | 0.2560.013 | 8.690.15 | 0.082 |
| JOLG | 275 | 1.270.04 | 0.3260.007 | 8.560.06 | 0.060 |
| JOLGSF | 303 | 1.350.04 | 0.3080.007 | 8.400.06 | 0.069 |
5 Conclusions
The main conclusion of this study is that the fundamental plane of radio galaxies, as defined by our collection of data for 73 objects, is consistent with the one defined by normal, non-radio elliptical galaxies. Some recent results on BH demography (Ferrarese & Merrit 2000, Gebhardt et. al. 2000) strongly suggest that all galaxies may host a massive BH in the nucleus, and that the BH mass is proportional to the mass of the spheroidal component. This means that, virtually, all ellipticals have the basic ingredient for becoming active. Considering the small amount of gas (few solar masses per year) necessary to sustain the radio emission of even the most powerful radio sources, the activity could be triggered by extremely modest alteration of the status of equilibrium in which galaxies settled soon after they form. According to this view it is therefore not surprising that radio and non radio ellipticals have indistinguishable global properties, irrespective of their nuclear activity. Here, we present one more result supporting this scenario.
Both metallicity effects and age variations have been suggested as the main cause (Faber et. al. 1995) of the strong dependence of M/L on , that is on the total mass of the galaxy. This relation is consistent with a progressive reddening of the stellar population going from small to big galaxies (e.g., Prugniel & Simien 1996), but most of dependence remains unexplained. It looks like that ellipticals pass from being baryon dominated to be dark matter dominated with increasing luminosity, with a ”fine tuning” required by the small and basically constant dispersion around the FP.
Appendix A Notes on individual galaxies
0055-016 - UGC 595 - 3C29 this galaxy belongs to the rich cluster A119 and is D26 in the Dressler (1980) list. Smith et. al. (1990) measured a velocity dispersion of 19918 kmbut recently Wegner et. al. (1999) give a value of 253 km in better agreement with our measurements.
0131-360 - NGC 612 This galaxy show a strong dust lane along the apparent major axis, our spectrum has been obtained perpendicularly to the dust lane, i.e. along the minor axis of the optical galaxy, no rotation is visible.
0915-118 - 3C218, Hydra A, A well studied galaxy showing strong [OIII]( Å) emission lines. Heckman et. al. (1985) found km, slightly higher than our measurement km.
1107-372 - NGC 3557, We measure a velocity dispersion of 2957 km and a velocity gradient of 150 km in the central 5″ in good agreement with data available in Hypercat.
1258-321 - ESO443-G024, this galaxy is in the cluster A3537. Dressler et. al.(1991) measured a velocity dispersion of 27927 km in good agreement with our data.
1333-337 - IC 4296, Our value of sigma is lower than the mean value quoted by Hypercat (340 km). The agreement is better with the measure of Franx et. al. (1989). From our spectrum, taken at PA=60∘ we measure a rotation of 71 km in agreement with data taken at the same position angle by Saglia et. al. (1993).
1400-337 - NGC 5419, Our measure is in good agreement with the mean value quoted by Hypercat. The spectrum, taken at PA=84∘, show a maximum rotational velocity of 90 km over 5″ .
1514+072 - UGC9799, our measure of the velocity dispersion is very close to the mean value of 247 km quoted in Hypercat.
Acknowledgements.
This research made use of Vizier service (Ochsenbein et. al. 2000) and of the NASA/IPAC Extragalactic Database (NED) which is operated by the Jet Propulsion Laboratory, California Institute of Technology, under contract with the National Aeronautics and Space Administration. We have made use of the LEDA (http://leda.univ-lyon1.fr) and Hypercat database.References
- Bender et al. (1992) Bender, R., Burstein,D., & Faber, S.M. 1992, ApJ, 399, 462
- Bertola et al. (1982) Bertola, F., Bettoni, D., Rusconi, G., & Sedmack G. 1984, AJ, 89, 356
- Busarello et al. (1997) Busarello, G., Capaccioli, M., Capozziello, S., Longo, G., & Puddu, E. 1997, A&A 320, 415
- Caon et al. (1993) Caon, N., Capaccioli, M., & D’Onofrio, M. 1993, MNRAS, 265, 1013
- Ciotti et al. (1996) Ciotti, L., Lanzoni, B., & Renzini, A. 1996 MNRAS, 282, 1
- Davies et al. (1983) Davies, R.L., Efstathiou, G., Fall, S.M. Illingworth, G.,& Schechter, P.L. 1983, ApJ, 266, 41
- Djorgovski & Davis (1997) Djorgovski,S., & Davis, M. 1987, ApJ, 313, 59
- Dressler (1980) Dressler, A. 1980, ApJS, 42, 565
- Dressler et al. (1987) Dressler, A., Lynden-Bell, D., Burstein, D., Davies, R.L., Faber, S.M., Terlevich, R.J., & Wegner, G. 1987, ApJ, 313, 42
- Dressler et al. (1991) Dressler, A. Faber, S.M., & Burstein, D. 1991, 368, 54
- Faber et al. (1989) Faber, S.M., Wegner, G., Burstein, D., Davies, R.L., Dressler, A., Lynden-Bell, D., & Terlevich, R. 1989, ApJSS, 69, 763(FA89)
- Faber et al. (1995) Faber, S.M., Trager, S.C., Gonzales, J.J., & Worthley, G. 1995, in IAU Coll. 164, Stellar Populations, ed. P.C. Van der Kruit, G. Gilmore, Kluwer Academic Publishers, Dordrecht p. 249
- Fasano et al. (1996) Fasano, G., Falomo, R., & Scarpa, R. 1996, MNRAS, 282, 40
- Ferrarese & Merrit (2000) Ferrarese, L., & Merrit,D. 2000, ApJ, 539, L9
- Fisher et al. (1995) Fisher, D., Illingworth, G., & Franx, M. 1995, ApJ, 438, 539
- Franx et al. (1989) Franx, M., Illingworth, G., & Heckman, T. 1989, ApJ, 344, 613
- Gebhardt et al. (2000) Gebahrdt, K., Bender, R., Bower, G., Dressler, A., Faber, S.M., Filippenko, A.V., Green, R., Grillmair, C., Ho, L.C.,,Kormendy, J., Lauer, T.R., Magorrian, J., Pinkney, J., Richstone, D., & Tremaine, S., 2000, ApJL, 359, L13
- Ghisellini and Celotti (2001) Ghisellini, G., & Celotti, A. 2001, astro-ph/0106570
- (19) Govoni, F., Falomo, R., Fasano, G., & Scarpa, R. 2000a, A&A, 353, 507
- (20) Govoni, F., Falomo, R., Fasano, G., & Scarpa, R. 2000b, A&ASS, 143, 369
- Gonzalez-Serrano and Carballo (2000) Gonzalez-Serrano J.I., & Carballo, R 2000, A&A, 142, 353 (GC00)
- Graham et al. (1996) Graham, A., Lauer, T.R., Colless, M., & Postman, M. 1996, ApJ, 465, 564
- Heckman et al. (1985) Heckman, T.M., Illingworth, G.D., Miley, G.K., & van Breugel, W.J.M. 1985, ApJ, 299, 41
- Jorgensen (1994) Jørgensen, I. 1994, PASP, 106, 967
- Jorgensen et al. (1995) Jørgensen, I., Franx, M., & Kjærgaard, P. 1995, MNRAS, 276, 134
- Jorgensen et al. (1996) Jørgensen, I., Franx, M., & Kjærgaard, P. 1996, MNRAS, 280, 167(JFK96)
- Ledlow & Owen (1995) Ledlow, M.J., & Owen, F.N. 1995, AJ, 110, 1959(LO95)
- Mobasher et al. (1999) Mobasher, B., Guzman, R., Aragon-Salamanca, A., & Zepf, S. 1999, MNRAS, 304, 225
- Ochsenbein et al. (2000) Ochsenbein, F., Bauer, P., & Marcout, J. 2000, A&AS, 143, 23
- Owen and Laing (1989) Owen, F.N., & Laing, R.A. 1989, MNRAS, 238, 357
- Owen and White (1991) Owen, F.N., & White, R.A. 1991, MNRAS, 249, 164
- Pahre et al. (1995) Pahre, M. A., Djorgovski, S.G., & de Carvalho, R.R. 1995, ApJ, 453, L17
- Paturel et al. (1997) Paturel, G., Andernach, H., Bottinelli, L., di Nella, H., Durand, N., Garnier, R., Gouguenheim, L., Lanoix, P., Marthinet, M. C., Petit, C., Rousseau, J., Theureau, G., & Vauglin, I. 1997, A&ASS, 124, 109
- Poggianti (1997) Poggianti, B. 1997, A&ASS, 122, 399
- Prugniel & Simien (1996) Prugniel, Ph., & Simien, F. 1996 A&A 309, 749
- Prugniel & Maubon (2000) Prugniel, Ph., & Maubon, G. 2000, “Dynamics of Galaxies: from the Early Universe to the Present” ASP Conf. Ser. Vol. 197, p. 403
- Saglia et al (1993) Saglia, R. P., Bender, R., & Dressler, A 1993, A&A, 279, 75
- Sargent et. al. (1977) Sargent, W.L.W., Schechter, P.L., Boksenberg, A.,& Shortridge, K. 1977, ApJ, 212, 326
- Scarpa & Urry (2001) Scarpa, R., & Urry, M. 2001, ApJ, 556, 749
- Smith & Heckman (1989) Smith, E.P., & Heckman, T.M. 1989b, ApJ, 341, 658(SH89)
- Smith et al. (1990) Smith, E.P., Heckman, T.M., & Illingworth, G.D. 1990, ApJ, 356, 399(SHI90)
- Wegner et al. (1999) Wegner, G., Colless, M., Saglia, R.P., McMahan, R.K., Davies, R.L., Burstein, D., Baggley, G.J.V., & Peacock, J.A. 1999, MNRAS, 306, 259(EFAR)