A Catalogue and Analysis of Local Galaxy Ages and Metallicities
Abstract
We have assembled a catalogue of relative ages, metallicities and abundance ratios for about 150 local galaxies in field, group and cluster environments. The galaxies span morphological types from cD and ellipticals, to late type spirals. Ages and metallicities were estimated from high quality published spectral line indices using Worthey & Ottaviani (1997) single stellar population evolutionary models.
The identification of galaxy age as a fourth parameter in the fundamental plane (Forbes et al. 1998) is confirmed by our larger sample of ages. We investigate trends between age and metallicity, and with other physical parameters of the galaxies, such as ellipticity, luminosity, and kinematic anisotropy. We demonstrate the existence of a galaxy age–metallicity relation similar to that seen for local galactic disk stars, whereby young galaxies have high metallicity, while old galaxies span a large range in metallicities.
We also investigate the influence of environment and morphology on the galaxy age and metallicity, especially the predictions made by semi-analytic hierarchical clustering models (HCM). We confirm that non-cluster ellipticals are indeed younger on average than cluster ellipticals as predicted by the HCM models. However we also find a trend for the more luminous galaxies to have a higher [Mg/Fe] ratio than the lower luminosity galaxies, which is opposite to the expectation from HCM models.
keywords:
galaxies: elliptical, galaxies: photometry, galaxies: evolution1 Introduction
Elliptical galaxies were once thought to be very old (15 Gyrs) systems, forming in a simple monolithic collapse, and evolving passively ever since. From colour–magnitude (e.g. Bower et al. 1992; Ellis et al. 1997; Kodama et al. 1998), Mg– (e.g. Ziegler & Bender 1997; Bernardi et al. 1998) and M/L studies (e.g. van Dokkum et al. 1998) it appears that most stars in elliptical galaxies formed at z 2. However, even though the bulk of the star formation occurred at high redshift, the evolutionary history of ellipticals is more complex. In terms of the star formation history, there is a variety of evidence for more recent activity. In the Local Group, the dwarf spheroidal galaxies reveal signs of younger stellar populations (see review by Grebel 1997). Some nearby giant ellipticals show H line emission (Goudfrooij et al. 1994) indicative of ongoing star formation (albeit at a low rate), E + A spectra indicating the presence of a secondary starburst in the last few Gyrs (Caldwell et al. 1993; Zabludoff et al. 1996), and blueward deviations from cluster colour–magnitude relations due to young stellar components (e.g. Terlevich et al. 1999). The presence of young globular clusters also suggests recent star formation events in ellipticals (e.g. Whitmore et al. 1997; Brown et al. 2000). The cause of this extended star formation history is probably driven by gaseous mergers and accretion events. For example, Schweizer & Seitzer (1992) showed that ellipticals with blue galaxy colours (associated with recent star formation) also reveal morphological disturbances (suggestive of dynamical youth).
On the theoretical side, the ‘monolithic collapse scenario’ has been challenged by the idea of hierarchical clustering and merging (HCM) of disk galaxies, and their dark matter halos, to form ellipticals (e.g. Kauffmann & Charlot 1998; Baugh et al. 1998). In this model, environment plays a key role in determining the evolution of an elliptical; cluster ellipticals are assembled at high redshift, while their field counterparts formed much more recently. These different evolutionary paths can be probed by examining the star formation history.
Directly measuring the age of the stars in elliptical galaxies has been problematic due to the well known age–metallicity degeneracy of old stellar populations. However it is now possible, with the combination of moderate resolution spectra and new stellar population models to break this degeneracy, and estimate the relative ages and metallicities of stellar populations independently (e.g. González 1993; Worthey 1994). To quote Governato et al. (1999), “These [age–dating] methods will prove invaluable in tracing the origin of early–type galaxies in different environments and will provide a larger database to test theories of galaxy formation.”
In an initial study exploiting these new age estimates, we examined the scatter about the fundamental plane (FP) for elliptical galaxies with galaxy age (Forbes, Ponman & Brown 1998). We found a strong correlation indicating that a galaxy’s position relative to the FP depends on its age, and showed that this age is consistent with the idea that it traces the last major episode of star formation, which in turn was presumably induced by a gaseous merger event. An analysis of the ages and metallicities of galaxies from the small samples of Gonzalez (1993) and Kuntschner (2000) has recently been carried out by Trager et al. (2000)
In this paper we have set out to compile a catalogue of high quality ages, metallicities and abundances for (mostly) early type galaxies from the literature. These ages are based on central absorption line indices calibrated to the Lick system. Such a catalogue will have many applications. For example, after galaxies have been age–dated we may begin to explore an ‘evolutionary sequence’ of elliptical galaxies tracking their energetic, chemical, structural and dynamic properties as they age. Another use is to test various predictions of the HCM models as mentioned above. We hope that this catalogue will be of use to many researchers involved in galaxy evolutionary studies. Due to their size, Tables 2 and 4 are available electronically from author DF or from http://astronomy.swin.edu.au/staff/dforbes/agecat.html
In section 2 we briefly explain how the spectroscopic age–dating technique used in the paper works, and in section 3, we outline some of the limitations of this method. This paper is based on data mined from many sources. Section 4 details each source, and any additional steps necessary to merge them into a homogeneous catalogue. We present this catalogue in section 5. In section 6 we investigate how the ages and metallicities of the galaxies from the catalogue correlate with the physical parameters of the galaxies, such as luminosity, anisotropy parameter, morphology and environment. We comment on our findings in light of predictions from models.
2 The Lick System And Galaxy Ages
The Lick system is perhaps the most widely used definition of absorption line indices for old stellar populations. It is based on spectra obtained with the Image Dissector Scanner (IDS) on the Lick 3m telescope, by S. Faber and collaborators (e.g. Faber & Jackson 1976; Burstein et al. 1984). These spectra cover the wavelength range 4000–6400Å with 9Å resolution. Further details can be found in Worthey et al. (1994), Worthey & Ottaviani (1997) and Trager et al. (1998).
As well as creating an extensive library of galaxy, globular cluster and stellar spectra, new stellar population models were developed to accompany the Lick indices (Worthey 1994). The relative age and metallicity sensitivity of each line index was quantified, thus allowing the well known age–metallicity degeneracy of old stellar populations to be broken. In this paper, we have chosen to use the H line index and the combination index [MgFe] as these have good age and metallicity sensitivity respectively, and are available for many galaxies.
The H line index is defined between 4847.875 and 4876.625Å with continua either side. It has the advantage of being sensitive to stellar age and a relatively strong line at a wavelength where most CCDs have a good quantum efficiency. One serious disadvantage of H is that it suffers from nebular emission in some galaxies, which ‘fills in’ the absorption line (González 1993). The bluer Balmer series (e.g. H and H) suffer far less from this problem (Osterbrock 1989) but these indices are slightly less age dependent (Worthey & Ottaviani 1997) and are more difficult to measure accurately than the H index, so have not yet been measured for a large sample of galaxies.
In luminous elliptical galaxies, Mg appears to be overabundant compared to Fe (e.g. Worthey et al. 1992; Davies et al. 1993). The fitting functions used in the Worthey models are derived from the Lick stellar library, which contain stars in the solar neighbourhood and are thus of mainly solar abundance ratios (McWilliam 1997). If the galaxies being studied have non solar abundance ratios, then the ages and metallicities will not necessarily be accurate. The combination index [MgFe] was defined by González to be an average of the Mg and Fe, and is thus a better tracer of metallicity than either Mg or Fe alone. It is calculated from (Fe, where Fe is the average of the Fe52 and Fe53 line indices. The individual line indices are defined as 5160.125 to 5192.625Å for Mg, 5245.650 to 5285.650Å for Fe52 and 5312.125 to 5352.125Å for Fe53. Due to the overabundance issues, and the widespread availability of [MgFe] index values in the literature, we have used it as the metallicity sensitive index for this work. We note that [NI] 5199Å emission may contribute to the red continuum band of Mg in some galaxies (Goudfrooij & Emsellem 1996). This would tend to make galaxies appear slightly younger than they really are. This is unlikely to be a strong effect in our sample as we have removed galaxies with evidence for emission lines (see Table 1). Furthermore the Mg index is combined with two Fe indices which do not suffer from emission.
Although H line indices on the Lick system now exist for over 500 galaxies, not all were obtained at sufficient S/N to derive accurate ages. Our aim here is to compile a relatively homogeneous sample of high quality H line indices. From the literature we have included galaxies that have EWH measurement errors of Å . Assuming no errors in [MgFe], this corresponds to an uncertainty in age of about , and an uncertainty of dex in [Fe/H] for a Gyrs old galaxy. The mean measurement errors in our final sample are 0.6Å for both H and [MgFe] (see section 3.6 for a discussion on the effects of correlated errors) . A number of published studies meet our H quality criteria, and these are discussed briefly below. Unfortunately several other studies do not, in general, meet this criteria (e.g. Gorgas et al. 1990; Jrgensen 1997, 1999; Trager et al. 1998). The H errors in these studies are typically 0.3Å which effectively rules out individual age determinations from such data.
Our basic approach is to collect central (i.e. small aperture) H and [MgFe] line indices from the literature, and via interpolation of the Worthey single stellar population (SSP) evolutionary tracks (Worthey 1994; Worthey & Ottaviani 1997), derive age and [Fe/H] metallicity values. We also calculate the Mg/Fe ratio as an indicatior of the [Mg/Fe] abundance ratio. Before discussing the samples, we remind the reader of several caveats that should be born in mind before interpretation of any results presented in this paper.
3 Caveats
3.1 Models
In this paper we have chosen to use the models of Worthey & Ottaviani (1997) to translate measured line indices into age and metallicity estimates. The results are model dependent. Several alternative models are available and include: Buzzoni et al. (1992, 1994), Bruzual & Charlot (1993), Fritze-von Alvensleben & Burkert (1995) and Vazdekis et al. (1996). Recently Maraston, Greggio & Thomas (2001) have studied the differences between the model predictions of Worthey & Ottaviani (1997) and Buzzoni et al. (1992, 1994). They find, in particular, that the values assumed for the Horizontal Branch evolutionary mass and hence Teff have a large effect on the predicted Fe and H line strengths. This leads to different derived ages. For example, at solar or super-solar metallicities Worthey models predict younger ages than Buzzoni et al. of 1–2 Gyrs. However the situation is worse for metal–poor galaxies, with age differences up to 4 Gyrs being possible. Fortunately most of the galaxies in our sample have central metallicities that are at least solar according to their [MgFe] index.
To check the degree to which using a different model would affect our results, we have estimated ages and metallicities for some of the galaxies in our sample using both the Worthey models used throughout this paper, and those of Vazdekis et al. (1996). The Vazdekis models use a superset of the stars used by Worthey (1994) to calculate the fitting functions that produce the Lick indices from the models, however they use different isochrones to determine the SSP HR diagram. Figure 1 shows that while the [Fe/H] values agree well between the models, the Vazdekis models systematically predict younger ages than the Worthey models do. This is not a problem per se, as both models give the same ranking of the galaxies in terms of age, but it should be noted that the ages we quote in this paper should be considered as relative to each other, and not absolute.

3.2 Non–solar Abundances
It has been known for some time that the most luminous ellipticals have non–solar abundance ratios, e.g. [Mg/Fe] +0.3 (O’Connell 1976; Peletier 1989; Worthey, Faber & González 1992; Carollo et al. 1993; Vazdekis et al. 1997). Unfortunately spectra of stars with enhanced elements are not generally available. So using Fe or Mg alone will result in significantly different age estimates. The combination index [MgFe] to some extent overcomes this problem by providing a ‘mean’ metallicity indicator, although there is still a slight tendency to underestimate the age of the most massive ellipticals.
As well as estimating ages and [Fe/H] metallicities for galaxies, we use the ratio of Mg divided by Fe as a proxy for the [Mg/Fe] abundance ratio (see discussion by Matteucci et al. 1998).
3.3 Aperture Effects
Studies of line index radial gradients have generally found most early
type galaxies to have a small variation from young metal–rich centers
to older and more metal–poor stars in the outer parts (Davies et al. 1993; Carollo et al. 1993, Gonzalez 1993). Thus different apertures may
affect the derived mean age and metallicity. In this paper, we have
calculated mean line indices within for the samples with
radial gradient information and used the values quoted by
Gonzalez (1993). This is achieved by weighting the profile by a
canonical surface brightness law:
| (1) |
where is the profile surface brightness at a radius , and is the value of the spectral line index at radius . The profile is normalised such that :
To calculate within an aperture of , we use a value of in equation 1 such that
Some of the samples used here do not have radial gradient information available. In the case of data from Carollo et al. (1993) and Kuntschner (1998) we use their fixed aperture measurements at 3 and 2.8 respectively. Mehlert et al. (1997) uses . Although aperture effects will be present (e.g. apertures larger than may tend to increase the derived age and reduce the metallicity) they tend not to be large since observed radial gradients are fairly shallow.
We can begin to probe the importance of aperture effects in our sample by comparing different age estimates for the same galaxies. In Figure 2 we show the age estimates for galaxies that are in common with the Gonzalez (1993) sample (a sample that uses ). The figure shows a one-to-one unity line and 2 Gyrs about this line. The bulk of the galaxies have ages within 2 Gyrs of that derived from the Gonzalez data, over the full age range.
There are however notable exceptions with large age differences. They are NGC 2778 (giving the Gonzalez derived age first) 4.7 vs 12.7 Gyrs from Fisher et al. (1995), NGC 3608 5.6 vs 14.3 from Halliday et al. (1998) and NGC 7619 14.1 vs 3.8 Gyrs from Fisher et al. (1995). It is impossible with just two age estimates to decide which better represents the age of the galaxy. We note however, that in these three cases aperture effects are probably not the cause as the Fisher et al. and Halliday et al. line indices were all corrected to be at , same as the Gonzalez (1993) data. In the final catalogue (Table 2) we give the simple mean of all different age estimates.

3.4 Emission
We have chosen to use the H line index as the dominant age indicator, since this is the most widely available. It has the advantage of being a relatively strong absorption line but can be affected by nebular emission which can rapidly fill the absorption feature, making the galaxy appear older than it really is. González (1993) made an empirical correction for H emission based on the [OIII] 5007Å equivalent width, i.e. H = H + EW([OIII]) 0.7. For an individual galaxy this correction may not be entirely correct, but on average it makes the H line index a more accurate age indicator. Some of the galaxies in the samples of Davies et al. (1993), Carollo et al. (1993), Vazdekis et al. (1997) and Halliday (1998) are in common with those of González (1993). Furthermore we have derived H line indices in an aperture for these four samples and for González (1993). We thus correct all common galaxies using the González (1993) [OIII] measurements. Both Fisher samples (Fisher et al. 1995, 1996) have been H emission corrected using their own measurements of [OIII]. For all samples, galaxies with strong emission have been excluded from this analysis and are listed in Table 1. The ages derived by Kuntschner (1998) (see sec. 4.9) used the H Balmer line index, which is far less sensitive to nebular emission than H, but to be consistent with the other samples, we have used ages derived from their H and [MgFe] measurements.
3.5 Luminosity Weighting
The galaxy ages and metallicities derived from absorption lines and stellar population models assume that a single stellar population is present. If more than one population of stars is present within the measurement aperture (which is the most likely case), then the derived ages will be dominated by the younger stellar population. This is because the strength of the line indices reflect the luminosity of the stellar population that produces them, and that young stars are particularly luminous at blue wavelengths. Thus even a small percentage, by mass, of young stars mixed with old stars can dominate the resulting age estimate.
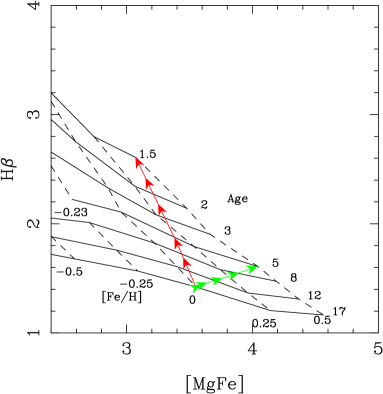
The effect of young stars mixed with an old stellar population is illustrated in Figure 3. Here we start with a solar metallicity, old (age = 17 Gyrs) stellar population. We then add increments of a metal–rich ([Fe/H] =0.5), young population (1.5 and 5 Gyrs are shown) of various strengths. Even a small fraction of young stars results in an inferred age that is much less than 17 Gyrs.
3.6 Correlated Errors
While the errors on the measured indices are independent, the model tracks are not orthogonal (e.g. Figure 3). This produces non orthogonal errors in age and metallicity which can lead to spurious correlations if not understood properly. Additionally, the degree of non orthogonality of the age and metallicity tracks changes with position on the grid. For this reason we have used Monte Carlo methods to model the effects of these correlations on ’ideal’ initial data distributions.
The model works by assuming an initial linear distribution between age and metallicity. A large sample of ‘galaxies’ is drawn at random from this distribution. We then use the Worthey models to assign [MgFe] and H index values to these galaxies, and at this stage, we add the Gaussian errors to the Lick indices. The errors are drawn at random from a distribution whose corresponds to the mean quoted error for that index in the real data. Once we have a set of model data with errors, we process them in the same way as the real galaxies, to produce a model age-metallicity catalogue. This can be compared to the assumed initial age-metallicity distribution, using a 2d Kolmogorov-Smirnov (KS) test, or converted into contours which contain of the model galaxies, comparable to a error ellipse. In section 6.1 we compare the data to models for a single age initial population, a single metallicity initial population and a population where the metallicity ([Fe/H]) depends linearly on age.
4 The Samples
Sample Galaxy Reason Galaxy Reason Galaxy Reason Davies NGC 315 Emission NGC 741 Emission NGC 4486 Emission Davies NGC 4636 Emission NGC 4839 No Fe obs. Carollo ESO208-21 Emission ESO323-16 Emission ESO381-29 Emission Carollo IC 1459 H error IC 2006 H error IC 2035 H error Carollo IC 3370 H error IC 4889 H error IC 4943 Emission Carollo NGC 1052 H error NGC 1298 Emission NGC 1947 Emission Carollo NGC 2502 H error NGC 2663 H error NGC 2974 H error Carollo NGC 3108 H error NGC 3136 Emission NGC 3136B Emission Carollo NGC 3226 Emission NGC 3250 H error NGC 3260 Emission Carollo NGC 3557 Emission NGC 4374 H error NGC 4684 Emission Carollo NGC 4696 Emission NGC 4832 Emission NGC 5011 H error Carollo NGC 5044 Emission NGC 5077 Emission NGC 5090 H error Carollo NGC 5266 Emission NGC 5796 H error NGC 5846 H error Carollo NGC 5903 Emission NGC 6849 Emission NGC 7097 H error Carollo NGC 7200 H error Fisher95 A 496 No H obs. NGC 5846 Emission NGC 6166 Emission Fisher95 NGC 7720 Emission Fisher96 NGC 2560 H error NGC 3998 H error NGC 4550 No Fe obs. Mehlert NGC 4850 Emission Vazdekis NGC 4594 Emission Longhetti E244-G12 Emission E289-G15 Emission E386-G04 Emission Longhetti IC 4823 Emission IC 5063 Emission NGC 7135 Emission
4.1 Davies et al.
The earliest study in our compilation is that of Davies, Sadler & Peletier (1993). Their spectra of 13 luminous elliptical galaxies were taken on the KPNO 4m telescope using two different spectrographs. Here we are interested in the central line indices which come mostly from the RC spectrograph with a resolution of 6Å . For our purposes we will use their radial gradient measurements of H, Fe52 and Fe53 to calculate mean values within , using equation 1 above. As the Davies et al. study does not include measurements, we do not include it in our analysis. We do however provide our derived ages and metallicities for Davies et al. in Table 2.
4.2 Carollo et al.
After several observing runs on the ESO 3.6m, Carollo et al. (1993) obtained spectra for 42 early type galaxies. The spectral resolution was about 9Å . They averaged the inner 3 to obtain the mean central values for each line index. Many galaxies had to be excluded due to strong emission, or large H errors; these galaxies are listed in Table 1. They did not measure Mg or Fe53, so we use the Worthey models for the Fe52 and H indices to derive ages and metallicities, but do not include them in our analysis. We do however provide our derived ages and metallicities for Carollo et al. in Table 2.
4.3 González
Using the Lick 3m telescope, González (1993) obtained spectra of 41 galaxies with a spectral resolution of 3.5 Å . The H line index was corrected for emission by scaling from the strength of [OIII] emission. Here we have chosen to use his aperture size. Most of the galaxies in his sample are located in low density environments, although five are in the Virgo cluster.
4.4 Fisher et al.
In two papers, Fisher, Franx & Illingworth (1995, 1996) investigated the line strength gradients in a large number of early type galaxies. They obtained spectra at the Lick 3m with a resolution of 3Å and at the KPNO 4m telescope with spectral resolution varying from 6.5 to 11Å . The combined sample includes 20 S0 galaxies, 2 ellipticals, 8 brightest cluster galaxies and 1 compact elliptical (M32). Radial gradient information was obtained for several line indices including H, Mg, Fe52 and Fe53. We have weighted each individual line measurement assuming an R1/4 profile and derived an average line index within using equation 1.
4.5 Mehlert et al.

Using several different telescopes, Mehlert et al. (1997) obtained spectra for 35 early type galaxies in the Coma cluster. Of these, 14 represent a complete sample down to MB = –21.6. They derived radial gradient information for the Mg, Fe and H line indices. We have used their aperture measurements. NGC 4839 has been corrected for H emission using the [OIII] measurements from Fisher et al. (1995), and NGC 4850 has been excluded due to strong H emission. We have used the radial line index measurements to exclude portions of galaxies showing signs of emission. A comparison between our derived ages, and those of Mehlert (1999, private communication) are shown in Figure 4. There is generally good agreement, except perhaps for the very oldest galaxies.
4.6 Vazdekis et al.
Three well known early type galaxies (i.e. NGC 3379, 4472 and 4594) were observed by Vazdekis et al. (1997) using the 4.2m WHT. They obtained radial gradient information for several line indices at 5Å resolution. After excluding NGC 4594 due to strong emission, we have calculated mean indices within for the remaining two galaxies using equation 1.
4.7 Longhetti et al.
Longhetti et al. (1998) studied a sample of early type galaxies in low density environments. In particular they obtained spectra, at a resolution of 2.1Å , for 21 galaxies with shells and 32 in pairs. Longhetti et al. identified those galaxies with signs of H emission. These have been excluded from our analysis and are listed in Table 1. We have velocity–corrected their published data using the formulation quoted in Longhetti et al. (1998).
4.8 Halliday
In her thesis, Halliday (1998) presents MMT observations of 14 low luminosity early type galaxies. Eight are located in the Virgo cluster and six in lower density environments. The spectra are high S/N with a resolution of 1.5Å . From the radial gradient information we have derived mean line indices within using equation 1. Where possible galaxies have been corrected for H emission using [OIII] from González (1993), otherwise we use the H radial profile information from Halliday (1998) to determine and exclude portions of the galaxy most affected by emission, as was done with the Mehlert et al. (1997) data.
4.9 Kuntschner
Kuntschner (1998; 2000) obtained spectra for a complete sample of early type galaxies in the Fornax cluster to MB = –17.1. This included the cD galaxy NGC 1399 and the peculiar galaxy NGC 1316 (also known as Fornax A). Line indices were measured for an effective aperture of 2.8 (230 pc). For their typical galaxy this is about . In addition to H, Mg, Fe, they measured H and C4668. Using their H values (corrected for emission where possible) and [MgFe] indices, as given in Kuntschner (2000), we have derived ages and metallicities for their sample.

Kuntschner (1998; 2000) derived ages and metallicities from H, C4668 and Fe3 (defined in Kuntschner 2000). The H line index has the advantage of being less affected by nebular emission (Osterbrock 1989) than H. In Figure 5 we show a comparison of the ages and metallicities, of their Fornax galaxies, derived from H–[MgFe] by us and from H–C4668 by them (Kuntschner 1998). The figure shows that either method gives similar [Fe/H] values over a large metallicity range, and reasonable agreement in age, for ages less than about 12 Gyrs. We suspect that weak emission is filling the H line, and causing us to overestimate the age of these few galaxies. To remain consistent with the data from the other authors, we use the H–[MgFe] ages for the analysis in this paper.
4.10 Vazdekis & Arimoto
Vazdekis & Arimoto (1999) have defined a new line index based around H. It has the advantage of being very insensitive to metallicity, while providing a robust age for old stellar populations. Using data from Jones (1997) and Vazdekis (1996) they derive ages for six early type galaxies. The ages for these galaxies are taken directly from their work.
4.11 Goudfrooij et al.
Recently Goudfrooij et al. (1999) published an initial paper on line strengths in 16 edge–on S0 and spiral galaxies. They placed the spectrograph slit along the minor axis of the galaxy bulge and carefully tried to exclude any disk contribution to the measured bulge line indices. The spectra were obtained with the ESO NTT 3.6m and the 2.5m INT on La Palma. Their typical resolution was about 2Å . They kindly supplied us with their central line indices on the Lick system, from which we have derived ages and metallicities.
5 The Catalogue

To estimate ages and metallicities for the galaxies, we interpolate Worthey SSP evolutionary tracks. Figure 6 shows the distribution of galaxies from samples with H and [MgFe] indices, superposed upon constant age model tracks (solid lines) and constant metallicity model tracks (dashed lines). This figure illustrates many of the caveats outlined in section 3, i.e.
i) The constant age and metallicity tracks are not orthogonal, resulting in correlated errors in age and metallicity.
ii) Not all galaxies lie within the parameter space covered by the models. Part of this could simply be due to observational errors, but in part it will also be due to incompleteness in the models, which are still evolving rapidly.
iii) The constant age tracks for older galaxies are much closer together than for young galaxies, making the errors in the ages of older galaxies much larger than those for the younger ones. This can clearly be seen in Figure 6.
| Galaxy | Age | [Fe/H] | [Mg/Fe] | Source | Quality |
|---|---|---|---|---|---|
| NGC0221 | 3.8 | -0.04 | 0.04 | 12 | 1 |
| NGC0224 | 5.1 | 0.42 | 0.21 | 5 | 1 |
| NGC0315 | 4.9 | 0.36 | 0.26 | 5 | 1 |
| NGC0507 | 6.2 | 0.21 | 0.24 | 5 | 1 |
| NGC0522 | 4.6 | -0.06 | – | 5 | 1 |
| NGC0547 | 7.6 | 0.30 | 0.27 | 5 | 1 |
| NGC0584 | 2.1 | 0.5 | 0.19 | 5 | 1 |
| NGC0636 | 3.6 | 0.38 | 0.15 | 5 | 1 |
| NGC0678 | 4.8 | 0.45 | – | 5 | 1 |
| NGC0720 | 3.4 | 0.5 | 0.27 | 5 | 1 |
| NGC0813 | – | 0.5 | 0.17 | 9 | 3 |
| NGC0821 | 7.2 | 0.22 | 0.25 | 5 | 1 |
| NGC0891 | 11 | -0.47 | – | 5 | 1 |
| NGC0936 | 16 | -0.01 | 0.19 | 4 | 1 |
| NGC0973 | 6.2 | 0.06 | – | 4 | 1 |
| NGC1032 | 3.1 | 0.5 | – | 4 | 2 |
| NGC1184 | 5.9 | 0.22 | – | 4 | 1 |
| NGC1209 | 15 | -0.01 | – | 1 | 3 |
| NGC1210 | 17 | -0.21 | 0.16 | 9 | 3 |
| NGC1316 | 3.4 | 0.25 | 0.15 | 12 | 1 |
| NGC1336 | 12.7 | -0.1 | 0.22 | 8 | 1 |
| NGC1339 | – | – | 0.24 | 8 | 3 |
| NGC1351 | 12.6 | 0.1 | – | 8 | 1 |
| NGC1373 | 7.7 | 0.00 | 0.17 | 8 | 1 |
| NGC1374 | 7.7 | 0.32 | 0.23 | 8 | 1 |
| NGC1375 | 1.5 | 0.24 | 0.00 | 8 | 1 |
| NGC1379 | 8.9 | 0.09 | 0.23 | 8 | 1 |
| NGC1380 | – | – | 0.18 | 8 | 3 |
| NGC1380A | – | – | 0.02 | 8 | 3 |
| NGC1381 | 6.6 | 0.23 | 0.18 | 8 | 1 |
| NGC1399 | – | 0.5 | 0.26 | 8 | 3 |
| NGC1404 | 5.9 | 0.47 | 0.19 | 8 | 1 |
| NGC1419 | 14.5 | -0.18 | 0.19 | 8 | 1 |
| NGC1427 | 7.9 | 0.17 | 0.18 | 8 | 1 |
| NGC1453 | 7.6 | 0.30 | 0.23 | 5 | 1 |
| NGC1461 | 6.8 | 0.29 | 0.16 | 4 | 1 |
| NGC1549 | 7.6 | 0.15 | 0.21 | 9 | 1 |
| NGC1553 | 17 | 0.03 | 0.18 | 9 | 3 |
| NGC1571 | 8.9 | 0.13 | 0.18 | 9 | 1 |
| NGC1600 | 7.3 | 0.41 | 0.25 | 5 | 1 |
| NGC1700 | 2.3 | 0.5 | 0.13 | 12 | 1 |
| NGC2300 | 5.0 | 0.39 | 0.25 | 5 | 1 |
| NGC2329 | 17 | – | – | 3 | 3 |
| NGC2778 | 8 | 0.25 | 0.21 | 12 | 2 |
| NGC2832 | 12 | 0.20 | – | 3 | 1 |
| NGC2865 | 1.5 | – | 0.16 | 9 | 1 |
| NGC2945 | 17 | – | 0.3 | 9 | 3 |
| NGC3051 | 17 | – | 0.27 | 9 | 3 |
| NGC3078 | 14 | 0.01 | – | 1 | 3 |
| NGC3115 | – | 0.5 | 0.14 | 4 | 3 |
| NGC3289 | 1.5 | – | 0.13 | 9 | 1 |
| NGC3377 | 4.1 | 0.20 | 0.22 | 12 | 1 |
| NGC3379 | 9.3 | 0.16 | 0.24 | 12 | 1 |
| NGC3384 | – | 0.5 | 0.1 | 4 | 3 |
| NGC3412 | 1.9 | 0.42 | 0.09 | 4 | 1 |
| NGC3585 | 3.1 | 0.5 | 0.14 | 4 | 2 |
| NGC3605 | 5.8 | 0.22 | 0.09 | 12 | 1 |
| NGC3607 | 3.6 | 0.5 | 0.16 | 4 | 2 |
| NGC3608 | 10 | 0.16 | 0.22 | 12 | 2 |
| NGC3818 | 5.0 | 0.39 | 0.23 | 5 | 1 |
| NGC3941 | – | 0.5 | 0.11 | 4 | 3 |
| NGC4036 | – | 0.5 | 0.24 | 4 | 3 |
| NGC4073 | 7.5 | 0.35 | – | 3 | 1 |
| Galaxy | Age | [Fe/H] | [Mg/Fe] | Source | Quality |
|---|---|---|---|---|---|
| NGC4105 | 17 | – | 0.28 | 9 | 3 |
| NGC4106 | 14 | 0.04 | 0.23 | 9 | 1 |
| NGC4239 | 5.5 | – | – | 11 | 1 |
| NGC4251 | 1.9 | 0.48 | 0.09 | 4 | 1 |
| NGC4261 | 14.4 | 0.19 | 0.28 | 5 | 1 |
| NGC4278 | 10.7 | 0.14 | 0.17 | 5 | 1 |
| NGC4339 | 7.9 | 0.12 | 0.18 | 7 | 1 |
| NGC4350 | 9.3 | 0.30 | 0.16 | 4 | 1 |
| NGC4374 | 11.8 | 0.12 | 0.28 | 5 | 1 |
| NGC4382 | 1.6 | 0.44 | 0.08 | 4 | 1 |
| NGC4387 | 13 | -0.04 | 0.17 | 12 | 1 |
| NGC4458 | 16 | -0.30 | 0.23 | 7 | 1 |
| NGC4464 | 17 | – | 0.23 | 7 | 3 |
| NGC4468 | 2.7 | 0.08 | 0.05 | 7 | 1 |
| NGC4472 | 8.5 | 0.24 | 0.25 | 12 | 1 |
| NGC4478 | 4.1 | 0.32 | 0.18 | 12 | 1 |
| NGC4489 | 2.6 | 0.24 | 0.09 | 12 | 1 |
| NGC4551 | 5.2 | 0.28 | 0.17 | 7 | 1 |
| NGC4552 | 9.6 | 0.28 | 0.27 | 5 | 1 |
| NGC4564 | 5.9 | 0.44 | 0.2 | 7 | 1 |
| NGC4649 | 11 | 0.30 | 0.3 | 5 | 1 |
| NGC4697 | 8.2 | 0.08 | 0.27 | 5 | 1 |
| NGC4754 | – | 0.5 | 0.11 | 4 | 3 |
| NGC4762 | – | 0.5 | 0.19 | 4 | 3 |
| NGC4807 | 5.2 | 0.23 | 0.2 | 10 | 1 |
| NGC4816 | 8.3 | 0.20 | 0.25 | 10 | 1 |
| NGC4827 | 10 | 0.18 | 0.24 | 10 | 1 |
| NGC4839 | 15 | 0.07 | 0.25 | 12 | 1 |
| NGC4840 | 6.6 | 0.32 | 0.23 | 10 | 1 |
| NGC4841A | 12 | 0.11 | 0.19 | 10 | 1 |
| NGC4860 | 12 | 0.24 | 0.28 | 10 | 1 |
| NGC4865 | – | 0.5 | 0.18 | 10 | 3 |
| NGC4869 | 15 | 0.12 | 0.22 | 10 | 1 |
| NGC4871 | 12 | -0.02 | 0.22 | 10 | 1 |
| NGC4872 | 2.8 | 0.36 | 0.16 | 10 | 1 |
| NGC4874 | 13 | 0.14 | 0.23 | 3 | 1 |
| NGC4876 | 2.1 | 0.24 | 0.28 | 10 | 1 |
| NGC4883 | 11 | 0.11 | 0.19 | 10 | 1 |
| NGC4884 | – | 0.5 | 0.25 | 10 | 3 |
| NGC4895 | 10 | 0.03 | 0.23 | 10 | 1 |
| NGC4896 | 10 | -0.02 | 0.18 | 10 | 1 |
| NGC4908 | 12 | 0.05 | 0.24 | 10 | 1 |
| NGC4923 | 8.5 | 0.11 | 0.22 | 10 | 1 |
| NGC4926 | 13 | 0.08 | 0.32 | 10 | 1 |
| NGC4931 | 2.8 | 0.30 | 0.14 | 10 | 1 |
| NGC4944 | 2.9 | 0.23 | 0.16 | 10 | 1 |
| NGC4952 | 6.6 | 0.21 | 0.25 | 10 | 1 |
| NGC4957 | 4.9 | 0.32 | 0.19 | 10 | 1 |
| NGC5018 | 1.5 | 0.37 | 0.11 | 9 | 1 |
| NGC5582 | 17 | – | 0.24 | 7 | 3 |
| NGC5638 | 7.0 | 0.23 | 0.24 | 5 | 1 |
| NGC5812 | 5.0 | 0.39 | 0.22 | 5 | 1 |
| NGC5813 | 17 | – | 0.3 | 5 | 3 |
| NGC5831 | 2.6 | 0.5 | 0.21 | 12 | 1 |
| NGC5846 | 12 | 0.19 | 0.26 | 5 | 1 |
| NGC5866 | 1.8 | 0.35 | 0.10 | 4 | 1 |
| NGC6010 | 4.3 | 0.39 | – | 4 | 1 |
| NGC6127 | 9.3 | 0.24 | 0.24 | 5 | 1 |
| NGC6702 | 1.9 | 0.48 | 0.12 | 5 | 1 |
| NGC6703 | 4.1 | 0.33 | 0.19 | 5 | 1 |
| NGC6734 | 4.5 | 0.18 | 0.19 | 9 | 1 |
| NGC6736 | 17 | – | 0.24 | 9 | 3 |
| NGC6776 | 3.2 | 0.43 | – | 9 | 1 |
| NGC6829 | 4.3 | 0.39 | – | 9 | 1 |
| NGC6849 | 17 | – | 0.18 | 9 | 3 |
| Galaxy | Age | [Fe/H] | [Mg/Fe] | Source | Quality |
|---|---|---|---|---|---|
| NGC6958 | 12 | -0.10 | 0.2 | 9 | 1 |
| NGC7052 | 11 | 0.22 | 0.27 | 5 | 1 |
| NGC7264 | 4.3 | 0.19 | – | 5 | 1 |
| NGC7284 | 7.8 | 0.20 | 0.28 | 9 | 1 |
| NGC7332 | 4.5 | 0.24 | – | 12 | 1 |
| NGC7396 | 2.6 | 0.39 | – | 12 | 1 |
| NGC7454 | 5.2 | -0.09 | 0.15 | 5 | 1 |
| NGC7562 | 11 | -0.06 | 0.3 | 5 | 1 |
| NGC7619 | 9 | 0.25 | 0.26 | 12 | 2 |
| NGC7626 | 11.7 | 0.19 | 0.28 | 5 | 1 |
| NGC7703 | 2.6 | 0.29 | – | 12 | 1 |
| NGC7768 | 17 | -0.03 | – | 3 | 3 |
| NGC7785 | 8.3 | 0.19 | 0.23 | 5 | 1 |
| NGC7814 | 10 | -0.10 | – | 5 | 1 |
| IC0843 | 17 | – | 0.28 | 10 | 3 |
| IC1711 | 6.5 | 0.06 | – | 10 | 1 |
| IC1963 | – | 0.5 | 0.11 | 8 | 3 |
| IC2006 | 4.0 | 0.5 | 0.19 | 8 | 1 |
| IC3947 | 17 | – | 0.33 | 10 | 3 |
| IC4041 | 2.3 | 0.36 | 0.13 | 10 | 1 |
| IC4045 | 14 | 0.07 | 0.23 | 10 | 1 |
| IC4051 | 12 | 0.20 | 0.29 | 10 | 1 |
| IC5011 | 11 | 0.13 | 0.17 | 9 | 1 |
| IC5105 | 17 | 0.08 | 0.21 | 9 | 3 |
| IC5250A | – | 0.5 | 0.19 | 9 | 3 |
| IC5250B | 4.3 | 0.33 | 0.2 | 9 | 1 |
| IC5328 | 17 | 0.02 | 0.16 | 9 | 3 |
| IC5358 | 16 | -0.00 | 0.25 | 9 | 1 |
| IC5364N1 | 2.6 | 0.5 | 0.16 | 9 | 2 |
| IC5364N2 | 17 | – | 0.24 | 9 | 3 |
| UGC10043 | 7.3 | -0.23 | – | 9 | 2 |
| UGC11587 | 1.9 | 0.5 | – | 9 | 2 |
| ESO4710191 | 3.3 | 0.45 | 0.24 | 9 | 1 |
| E107-G04 | 1.8 | 0.5 | 0.14 | 9 | 2 |
| E138-G29 | 9.9 | 0.12 | 0.22 | 9 | 1 |
| E240-G10 | 13 | 0.06 | 0.24 | 9 | 1 |
| E274-G06 | 12 | 0.09 | 0.32 | 9 | 1 |
| E283-G19 | 17 | – | 0.38 | 9 | 3 |
| E283-G20 | 1.9 | 0.41 | 0.25 | 9 | 1 |
| E297-G34 | 17 | – | 0.15 | 9 | 3 |
| E358-G25 | – | – | 0.00 | 8 | 3 |
| E358-G50 | – | – | 0.00 | 8 | 3 |
| E358-G59 | – | – | 0.14 | 8 | 3 |
| E358-G06 | – | – | 0.09 | 8 | 3 |
| E359-G02 | – | – | -0.04 | 8 | 3 |
| E400-G30 | – | – | -0.07 | 9 | 3 |
| E486-G17 | 7.3 | 0.03 | – | 9 | 1 |
| E486-G19 | 2.0 | 0.28 | – | 9 | 1 |
| E486-G29 | 17 | – | – | 9 | 3 |
| E507-G45 | 4.2 | 0.45 | 0.23 | 9 | 1 |
| E507-G46 | 17 | – | 0.22 | 9 | 3 |
| E538-G10 | 11 | -0.03 | 0.22 | 9 | 1 |
| E539-G11 | 14 | -0.24 | 0.28 | 9 | 1 |
| E545-G40 | 17 | – | 0.13 | 9 | 3 |
Notes: Sources of age (in Gyrs), metallicity and abundance ratios are: Carollo et al. (1993) = 1; Davies et al. (1993) = 2; Fisher et al. (1996) = 3; Fisher et al. (1995) = 4; Gonzalez (1993) = 5; Goudfrooij et al. (1999) = 6; Halliday (1998) = 7; Kuntschner (1998) = 8; Longhetti et al. (1998) = 9; Mehlert et al. (1997) = 10; Vazdekis & Arimoto (1999) = 11; mean of several = 12. Ages with errors and metallicity errors dex have quality index = 1; Errors and dex have index = 2; Highly uncertain values (not used in analysis) have index = 3.
Our final catalogue is given in Table 2. Here we list the galaxy name, along with our estimate for galaxy age in Gyrs, [Fe/H] metallicity and [Mg/Fe] abundance. The source of the original line index measurements are also given; in the case of multiple measurements we have taken the simple mean. We also list a quality index. Most galaxies have index = 1 indicating that their age and metallicity estimates are accurate to and dex respectively. This is of course in terms of how their measurement error translates onto the model grid, and does not include any error associated with a systematic shift of the grid. Index = 2 galaxies have larger errors. About a quarter of the galaxies were found to lie outside of the Worthey & Ottaviani (1997) stellar model grid, i.e. usually suggesting ages greater than 17 Gyrs or metallicities higher than [Fe/H] = 0.5. In these cases we give an upper limit. The very high [Fe/H] galaxies tend to be the most luminous galaxies, and are also those with super-solar [Mg/Fe] abundances. The galaxies indicating ages of 17 Gyrs could be either genuinely old or suffer from residual H emission. Thus extreme metal–rich and old galaxies should be regarded with caution. They are not included in the subsequent plots or analysis. These, along with galaxies that don’t have [MgFe] line indices available, are assigned index = 3.
5.1 Comparison with other age estimates
| Galaxy | Our Age | Other Age | Source |
|---|---|---|---|
| NGC 1052 | – | 0.9 | 1 |
| NGC 1700 | 2.3 | 2.5 | 2 |
| NGC 2865 | 1.5 | 1.2 | 3 |
| NGC 3156 | – | 0.9 | 3 |
| NGC 3610 | – | 1.5–6.5 | 4 |
| NGC 3656 | – | 1 | 5 |
| NGC 3921 | – | 0.8 | 3 |
| NGC 5322 | – | 1–3 | 6 |
| NGC 6776 | 3.2 | 2–3 | 7 |
| NGC 7252 | – | 0.7 | 3 |
| NGC 7585 | – | 1 | A stars |
| ESO341-IG04 | – | 0.8 | 8 |
In Table 3, we have listed age estimates for young, or proto–ellipticals that we are aware of in the literature. These estimates come from stellar dynamics, proto–globular clusters, extended structures etc. For the three galaxies that also have spectral age estimates from this paper, the agreement is very good.


Another set of age estimates for early type galaxies comes from Schweizer & Seitzer (1992). In their paper, they attempted to quantify the ‘morphological disturbance’ of their sample galaxies, and via a starburst model, estimate the time since a merger. Depending on the gas fraction and star formation efficiency, they listed six age estimates for each galaxy. In Figure 7 we plot their “most representative” age against our age estimate. We note that the starburst model used by Schweizer & Seitzer (1992) assumed solar metallicity. Figure 8 indicates that the young stellar component is usually metal–rich (i.e. [Fe/H] 0.5 using [MgFe] as a metallicity indicator). By assuming solar metallicity we would expect the Schweizer & Seitzer ages to be an overestimate.
Examination of Figure 7 reveals substantial scatter, with very little formal correlation. We do not believe the Schweizer & Seitzer ages to be as reliable as the spectral ages given here but they do give some indication of whether the galaxy is young or old.
6 Results and Discussion
| Galaxy | Type | Environ | Dist. | MB | V | Ellip | R | |
|---|---|---|---|---|---|---|---|---|
| NGC0221 | cE | Group | 0.72 | -15.42 | 46 | 76 | – | -0.04 |
| NGC0224 | Sb | Group | 0.72 | -19.94 | 100 | 173 | – | -0.35 |
| NGC0315 | E | Group | 58.9 | -22.2 | 32 | 299 | 0.31 | -0.07 |
| NGC0507 | S0 | Group | 67.6 | -21.95 | – | 329 | – | 0.24 |
| NGC0522 | Sc | Group | 38.5 | -18.99 | – | – | – | – |
| NGC0547 | E1 | A194 | 63.4 | -21.84 | – | 240 | 0.07 | 0.00 |
| NGC0584 | E4 | Group | 22.2 | -20.42 | 157 | 223 | 0.37 | -0.19 |
| NGC0636 | E3 | Group | 22.3 | -19.54 | 74 | 166 | 0.14 | -0.10 |
| NGC0678 | SBb | Group | 39.3 | -19.64 | – | – | – | – |
| NGC0720 | E5 | Group | 20.8 | -20.47 | 48 | 244 | 0.37 | 0.05 |
| NGC0813 | S0 | Field | 107 | -21.33 | – | – | – | – |
| NGC0821 | E6 | Field | 21.0 | -19.92 | 89 | 207 | 0.37 | 0.15 |
| NGC0891 | Sb | Field | 8.83 | -18.92 | – | – | – | – |
| … |
Various properties for the galaxies in our catalogue are listed in Table 4. This includes the Hubble type from NED111The NASA/IPAC Extragalactic Database (NED) is operated by the Jet Propulsion Laboratory, California Institute of Technology, under contract with the National Aeronautics and Space Administration.. Galaxies are placed in one of three environments, either as a cluster galaxy if in a known cluster, a group galaxy if in the group catalogue of Garcia (1993), or in the field if not classified as group or cluster. Galaxy ellipticity comes from either Davies et al. (1983) or the RC3. The other properties are generally taken from Prugniel & Simien (1996). The distance includes Virgocentric and Great Attractor correction terms for Ho = 75 km s-1 Mpc-1. When a galaxy was not listed in Prugniel & Simien, we used Hypercat (Prugniel & Golev 1999) and NED. Below we compare the new age, metallicity and abundance information from Table 2 with other galaxy properties.
6.1 Galaxy Metallicity – Age Relation
In Figure 8 we show the metallicity – age relation for the galaxies in our catalogue. The figure also shows model results showing the distribution of galaxies with given age–metallicity distributions, taking into account the correlated errors (see section 3.6 and error bars in Figures 8 and 9). The contours show a best fit constant age distribution (dot dash), a best fit constant [Fe/H] distribution (dash), and a best fit linear relation between age and [Fe/H] (solid contour). This linear relation (, where the age () is measured in Gyrs) is shown by the solid line in Figure 8.
There is a trend for the younger galaxies to have more metal–rich stellar populations. This is as would be expected if the more recent starbursts are occurring in progressively more enriched gas. The shape of the metallicity – age relation is similar to that for local stars in the disk of our Galaxy (Rana 1991). While there may be some evidence for the field galaxies preferentially populating the low age, high metallicity part of the plot, and cluster galaxies tending to be in the high age, low metallicity portion, there is no strong difference in the relation for galaxies in different environments from this plot.
We have used a KS test, using models which take into account the correlated errors (section 3.6) to test what sort of underlying age–metallicity distribution can best describe the observed age–metallicity distribution. All three models were optimised to minimise the KS statistic (i.e. maximise the fit to the data). The KS test immediately rules out both the single mean age, and single mean metallicity models to greater than . The linear relation between age and metallicity (solid line in Figure 8) has a probability of being inconsistent with the data of only , and thus can not be ruled out. We thus conclude that only a galaxy population with a relation between age and metallicity is consistent with the data. The exact form of the relation though is beyond the scope of this work. We note that Trager et al. (2000) also favour a linear relation for the subset of galaxies from Gonzalez (1993) and Kuntschner (2000). We comment further on this when we discuss variations of age and metallicity with environment in section 6.2
6.2 Age Variations with Environment


In his thesis, González (1993) claimed that field ellipticals varied greatly in age, at roughly constant metallicity. Kuntschner & Davies (1998), on the other hand said that the ellipticals in the Fornax cluster were essentially a metallicity sequence at constant age. However, González included in his sample both S0 and non–cluster elliptical galaxies. Using only field ellipticals from our catalogue, many of which come from González (1993), and the Fornax ellipticals from Kuntschner & Davies we reexamine these claims in Figure 9. This plot shows that both field and cluster ellipticals are generally consistent with the overall metallicity – age relation (see Figure 8), and that neither are strictly a sequence in metallicity or age alone (see also Kuntschner 1998). In fact it would seem that the oldest galaxies span a range in metallicities, while the younger galaxies all have a high metallicity.
In Figure 10 we show the distribution of elliptical galaxies as a function of environment. The ellipticals in non–cluster environments tend to be slightly younger than their cluster counterparts, however this result is only 98.5% significant, and needs to be confirmed with improved data.
This leads to an interesting interpretation of the apparent González–Kuntschner discrepancy. While the galaxies from both studies follow the overall age–metallicity relation shown in Figure 8, the Kuntschner ellipticals are on average older than the González galaxies, so they span a range in metallicities, while the younger González galaxies lie on a portion of Figure 8 where there are only high metallicity galaxies.
6.3 Deviations from the Fundamental Plane

In an earlier paper (Forbes, Ponman & Brown 1998) we showed that a
galaxy’s position relative to the B band fundamental plane (FP) was
largely due to its age. In particular, young galaxies had negative
residuals and old galaxies positive ones for the FP defined as :
R(.
In that paper, most ages came from spectroscopic estimates
but it was also supplemented by other methods (e.g Schweizer &
Seitzer 1992). In Figure 11 we re-plot the FP residual
diagram using our new galaxy ages (i.e. all spectroscopic). Residuals
from the FP come from Prugniel & Simien (1996) or calculated from
Hypercat (Prugniel & Golev 1999). A similar trend, as reported by
Forbes et al. (1998), is seen. A fit to both the elliptical and S0
galaxies gives a slope of (bootstrap errors on the
fit). The scatter is considerably reduced if one only considers
elliptical galaxies. The figure also shows the location of four
1 Gyr old merger remnants. This relation can be understood in terms of
a centrally located starburst that fades with time (Forbes et al. 1998).
6.4 Kinematic Trends with Age
Trager (1997) examined the relationship between galaxy (log) age and both isophotal shape and internal kinematics for 40 ellipticals. He found ‘L’ shaped plots, in the sense that galaxies only occupied three quadrants of the possible parameter space. Old ellipticals with disky isophotes and/or isotropic rotators were absence from the plot. Was this simply due to a small sample or is this an important evolutionary clue about elliptical galaxies ?
Here we focus on kinematic properties rather than isophotal shape, as the latter can be strongly influenced by orientation effects. However we note that isophotal shape (as given by the 4th cosine term) is correlated with the anisotropy parameter (Kormendy & Bender 1996), so any trends with kinematics can probably be extended to isophotal shape as well.

In Figure 12a we plot versus galaxy age. In general, the plot shows a tendency for old galaxies to be slow rotators, while young galaxies can be either slow or rapid rotators. Furthermore in S0 galaxies rotation dominates over random motions relative to their elliptical counterparts. Although the galaxies do not separate neatly into three quadrants, there is still a general tendency for fewer old, rapidly rotating galaxies.
Another important kinematic parameter is the anisotropy parameter, usually denoted as . This is the rotation parameter normalised by the value for an isotropic oblate spheroid of a given ellipticity (Davies et al. 1983). Ellipticals with are said to be anisotropic and those with isotropic, or rotationally flattened.
In Figure 12b we plot the anisotropy parameter versus age for the galaxies classified as elliptical in the RC3. Again there is a general tendency for fewer old, isotropic galaxies. Thus our larger sample generally supports the initial finding of Trager (1997).
If the absence of old, rapidly rotating/isotropic (and hence disky)
ellipticals is real, how can this be explained ? Selection against
such galaxies in our catalogue seems unlikely, but can’t be ruled
out. It is perhaps worthwhile to explore possible physical mechanisms
to explain this effect.We now examine three possibilities. Isotropic
ellipticals
i) did not form in the early Universe.
ii) have been destroyed.
iii) have been transformed into something else.
Bender et al. (1992) have suggested that the anisotropy parameter indicates the relative importance of cold gas to stars in the merger that created the elliptical. Within this framework, low luminosity isotropic ellipticals are thought to be the result of gaseous mergers. As the early Universe is generally more gaseous than today, we would expect the galaxies formed at early epochs (which are now old) to be isotropic. So within this framework, it seems unlikely that isotropic ellipticals did not form in the early Universe.
For the second option, young isotropic galaxies must be preferentially destroyed over similarly aged anisotropic ones (e.g via a merger). It is again difficult to imagine a scenario in which this is the case.
Transformation of galaxies can take many forms. Changes in the dynamical properties of an isolated undisturbed elliptical occurs on time scales longer than the Hubble time so kinematic transformation via passive evolution is unlikely.
A potentially important aspect of the kinematic measures discussed here is that they are luminosity–weighted (as are the age estimates). The presence of young stars in a disk may dominate the central spectral indices and hence the galaxy age estimate (de Jong & Davies 1997). This same disk, with its relatively high ratio, will also contribute to the overall measurement for the galaxy. As the disk starburst fades, its relative contribution drops significantly. So as isotropic ellipticals age they may move not only to the right in Figure 12, but also down as the elliptical/bulge makes a larger relative contribution to the measured kinematics.
Some qualitative support for this idea comes from Scorza & Bender (1995). They studied the kinematics of 9 ellipticals with disks and estimated the value for the ‘bulge’ of the elliptical after subtracting the disk contribution. The reduction in the original measured value ranged from 0 to 0.9 in the sense of making galaxies more anisotropic.
It may also be possible for ellipticals to move from the lower right of Figure 12b to the upper left. If an old anisotropic galaxy accretes a small gaseous galaxy, which leads to the formation of a gaseous disk and associated star formation, then this could have the effect of resetting the galaxy age while making it appear isotropic as well.
Disky, isotropic ellipticals tend also to have high ellipticities and reveal power–law inner surface brightness profiles (e.g. Kormendy & Bender 1996). We examined the distribution of ages for galaxies with ‘power–law’ versus ‘core’ surface brightness profiles, and found a weak trend for power–law galaxies to be younger on average, with very few old power–law ellipticals. This is in the same sense as expected from Figure 12. However there were insufficient numbers of galaxies in our sample to produce statistically significant results.
6.5 Predictions from Hierarchical Clustering and Merging Models
In a hierarchical Universe galaxies are built up from the merging of smaller subunits. Starting from an extended Press–Schechter theory, various groups have developed semi–analytical models to describe galaxy formation via hierarchical clustering and merging (HCM; Kauffmann et al. 1993; Cole et al. 1994; Somerville & Primack 1999). Although some differences exist between the different formulations, they have some basic characteristics of galaxy formation in common. For example, HCM requires that massive ellipticals are younger than less massive ones. Environment is a key property in determining galaxy evolution under HCM. Ellipticals in low density environments (i.e. the field) have a more complex and extended star formation history making them on average younger than their cluster counterparts.
In the following we compare the results from our catalogue with the
HCM predictions of Kauffmann and co–workers (e.g. Kauffmann &
Charlot 1998; Thomas & Kauffmann 1999). Although our catalogue of
galaxies is in no sense statistically complete, it could be considered
a random sample and therefore fairly representative of nearby
galaxies. Our ages are measuring the last major episode of star
formation, which is presumably an indicator of the time since assembly of the galaxy in a dynamical sense, and not the mean age of
the stars in a galaxy. We attempt to make quantitative comparisons
where possible, however one should bear in mind differences between
‘observers’ and ‘theorists’ definitions. These are briefly outlined
below in the four predictions:

i) Large ellipticals are younger than small ellipticals.
A
basic requirement of all HCM models is that more massive ellipticals
are formed more recently than less massive ones and hence should be
younger on average. Based on a sample of 40 galaxies, Faber
et al. (1995) suggested that large ellipticals were older on
average than small ellipticals. However, in our previous paper (Forbes
& Ponman 1999), our sample of 88 galaxies did not show a strong
luminosity – age trend. In Figure 13 we show the
distribution of total B band luminosity with galaxy age for the
elliptical and S0 galaxies in our catalogue. We find no statistically
significant correlation in our sample. This result supports those of
colour–magnitude studies (e.g Terlevich et. al. 1999), but it is also
possible that environment effects are obscuring any trend; we examine
this next.
ii) Field ellipticals are younger than cluster ellipticals.
In the models, galaxy ‘environment’ is defined in terms of the
circular velocity (VC) of the dark matter halos, with ‘field’
ellipticals having VC 600 km s-1 and ‘cluster’ galaxies
halos having V km s-1 (Kauffmann & Charlot 1998).
The V–luminosity weighted age difference between these cluster and field
ellipticals ranges from about zero for small ellipticals to 1 Gyr for
the most massive ellipticals. HCM has received some support from the
work of Bernardi et al. (1998) who claim differences in the Mg –
relation for cluster and field ellipticals indicating an age
difference of 1.2 0.35 Gyrs in the correct sense. In our
catalogue, we have classified galaxies into known clusters, groups (if
in the list of Garcia 1993) and field (essentially non–group and
non–cluster galaxies).
In Figure 10 we show the age
distribution for field and group galaxies compared to their cluster
counterparts.
We find that the mean age of elliptical
galaxies in clusters is 9.0 0.7 Gyrs (error on the mean),
compared to 7.1 0.6 for field and group ellipticals. The age difference of
1.9 Gyrs is similar to that claimed by Bernardi et al. (1998), although
the small numbers of galaxies means that our result is not
statistically significant.

iii) Large bulge-to-disk galaxies are younger than small
bulge-to-disk galaxies.
According to HCM, after an elliptical
galaxy forms from the merger of smaller disk systems, subsequent
cooling of the gas in the halo may ‘accrete’ onto the elliptical
forming a bulge and disk system. Thus HCM predicts that spirals can be
transformed into ellipticals and back into spirals again. Furthermore
spirals with large bulge-to-disk ratios (e.g. Sa) have had less time
to develop a disk, and are hence younger than late type spirals (e.g.
Sc). Kauffmann (1996) shows that for field galaxies, the V band luminosity
weighted age varies from 6.5 to 12.5 Gyrs for M(bulge) – M(tot),
where M(bulge) is the B band bulge magnitude and M(tot) the total B
band magnitude of the galaxy. Figure 14 shows the galaxy
age versus M(bulge) - M(tot) for field galaxies in our catalogue. We
have translated the galaxy T type (from RC3) into M(bulge) - M(tot)
based on the study of Simien & de Vaucouleurs (1986). We also show
the HCM predictions of Kauffmann (1986). The limited data for late
type galaxies (M(bulge) – M(tot) ) follows a similar overall
trend to the models, but lie outside the range of ages
predicted.
Most of the spiral galaxies in Figure 14 come from the study of Goudfrooij, Gorgas & Jablonka (1999). They were careful to reduce the disk light emission as much as possible, but if some residual disk light does remain in the slit (placed along the minor axis) then this may bias the late type spirals to younger ages. They noted that the bulges of spirals have similar ages to ellipticals.
It is worth mentioning an alternative bulge formation mechanism based
on secular growth from disk material (e.g. Pfenniger & Norman
1990). In contrast to the ‘bulge first’ formation of HCM, this
scenario has bulges formed after the disk, i.e. ‘disk first’. So we
would expect early type spirals to be older than late type spirals.
Trager, Dalcanton & Weiner (1998) have presented line indices for two
early type and two late type spirals. They conclude that the bulges of
the two early type spirals are indeed older than the late type
ones. Our data suggest the opposite trend; clearly more data are
needed to resolve this issue.
iv) Large, field ellipticals have lower [Mg/Fe] ratios than
small, cluster ellipticals.
It is now fairly well established that
massive ellipticals have an enhancement in elements,
e.g. [Mg/Fe] ratios that are super-solar by about 0.3
dex. (e.g. Peletier 1989; Worthey, Faber & González 1992; Davies
et al. 1993; Carollo et al. 1993). These ratios probably indicate that
massive ellipticals have short star formation timescales and/or an IMF
that is skewed towards high mass stars. Such element abundances
provide an important probe of galaxy formation and evolution.

The incorporation of chemical evolution into the HCM semi analytical models, and the predictions for [Mg/Fe] ratios, are described in Thomas & Kauffmann (1999). They note that the range of predicted [Mg/Fe] does not yet match the observations. So rather than make direct comparisons, we will simply explore [Mg/Fe] trends. The first trend we compare is that of [Mg/Fe] with luminosity for elliptical galaxies. The HCM model predicts a general decrease in the average [Mg/Fe] ratio for more luminous ellipticals. As noted above, the observational data show a clear trend for increasing [Mg/Fe] in large ellipticals (see Figure 15). This disagreement between the theory and observation is noted by Thomas & Kauffmann, and they go on to suggest that a flatter IMF will help raise the predicted [Mg/Fe] ratios. As an aside, the bulges of spirals also reveal a similar [Mg/Fe] trend with luminosity (Jablonka et al. 1996). It is difficult to explain this trend and understand the element enhancement if bulges are being built up slowly (i.e. on timescales longer than those associated with SN Ia explosions).
A second prediction of the model is that field galaxies should exhibit lower [Mg/Fe] ratios on average than their cluster counterparts. We do not find this to be the case (see Figure 16). Thomas & Kauffmann (1999) do state that their models under predict the number of galaxies with high [Mg/Fe] compared to observations, however the shape of the distributions shown in Figure 16 do not match the distributions of [Mg/Fe] for ellipticals and bulges predicted by the models, which have a much flatter distribution, skewed towards lower values of [Mg/Fe]. The few galaxies in the models which do have [Mg/Fe] ratios comparable with observations, formed in the first 1–2 Gyrs.

It is also important to note that massive ellipticals have [Mg/Fe] over abundant at all radii not just at the galaxy centre (Davies et al. 1993; Kuntschner 1998). This indicates that the exact nature of the star formation occurred over the whole galaxy. This combined with the very short star formation time scale implied (i.e. less than the SN Ia time scale of Gyr) favours a dissipational collapse and/or gaseous mergers at early epochs for these galaxies. Lower luminosity ellipticals, with near solar [Mg/Fe], allow for more extended star formation, as might be associated with a merger.
7 Conclusions and Future Work
Using high quality spectral line index data from the literature we have derived ages, metallicities and abundance ratios for about 150 galaxies. These, mostly early-type galaxies, cover a range of luminosities and environments. We confirm previous findings that the scatter in the elliptical galaxy fundamental plane depends on the galaxy age. Our data support some predictions of hierarchical galaxy formation (i.e. that field ellipticals are younger than their cluster counterparts), but are at odds with others (i.e. massive ellipticals are not obviously younger than small ellipticals as predicted). We also find an interesting absence of old, rapidly rotating galaxies in our sample.
An outstanding issue in contemporary galaxy studies concerns the apparent dichotomy in elliptical galaxy properties. The dichotomy occurs at about MB = –20.5 (although it overlaps in luminosity), with low luminosity ellipticals tending to have disky isophotes, power-law surface brightness profiles and be isotropic rotators. As such they have much in common with S0 galaxies (Kormendy & Bender 1996). Various aspects of the dichotomy debate are presented by van den Bergh (1998). He suggests that low luminosity ellipticals may represent the product of a dissipational collapse. High luminosity ellipticals, on the other hand, formed less dissipatively from stellar mergers according to Bender, Burstein & Faber (1992). However the super solar [Mg/Fe] ratios of such galaxies probably indicates a rapid star formation timescale within the merging subunits.
Our results for trends with galaxy age lend some support to this view. The galaxies with ‘dissipative features’ (e.g. high V/, high ellipticity, power-law profiles) tend to be young. It is likely the young stellar population is associated with a stellar disk (as found by de Jong & Davies 1997) and a disky E/S0 galaxy reveals other the dissipative features. As this disk starburst fades with time, the old stellar population contributes more to the line indices (and hence the age) but also to the kinematics.
Although we have assembled a large number of relative ages and metallicities for local galaxies, there are some issues with this dataset which prevented us from properly testing many of the predictions of HCM. The main points which need to be addressed in future studies include:
i) Sparsity of field and group galaxies in the sample. Many predictions of HCM compare the properties of field, cluster and group galaxies, however the field and group galaxy data available to date is of lower quality than the cluster data.
ii) Nebular emission (see section 3.4) could still be affecting the ages and metallicities we derive for some of the galaxies in our sample. This could be minimised in future studies by using higher order Balmer line indices, such as H and H.
iii) The sample definition in this paper has by
necessity been very simple. We have used all data which satisfied our
signal-to-noise criterion.
Future work should concentrate on creating a far more uniformly selected
sample, which can be regarded as either complete or
representative for a particular galaxy population.
Acknowledgements
We thank H. Kuntschner, T. Ponman, S. Trager, A. Smith, K. Masters for
help and useful discussions. We also thank D. Mehlert, C. Halliday,
Longhetti, P. Goudfrooij for supplying us with electronic versions of
their data.
This research has made use of the NASA/IPAC Extragalactic Database (NED) which is operated by the Jet Propulsion Laboratory, California Institute of Technology, under contract with the National Aeronautics and Space Administration.
References
Baugh C. M., Cole S., Frenk C. S., Lacey C. G., 1998, ApJ, 498, 504
Bender R. , Burstein D., Faber S. M., 1992, ApJ, 399, 462
Bernardi M., et al., 1998, ApJ, 508, L143
Bower R. G., Lucey J. R., Ellis R. S., 1992, MNRAS, 254, 601
Brown R. J. N., Forbes D. A., Kissler–Patig M., Brodie J. P., 2000,
MNRAS, 317, 406
Bruzual G., Charlot S., 1993, ApJ, 405, 538
Burstein D., Faber S. M., Gaskell C. M. , Krumm N., 1984, ApJ, 287, 586
Buzzoni A., Gariboldi G., Mantegazza L., 1992, AJ, 103, 1814
Buzzoni A., Mantegazza L., Gariboldi G., 1994, AJ, 107, 513
Caldwell N., Rose J. A., Sharples R. M., Ellis R. S., Bower R. G., 1993, AJ, 106, 473
Carollo C. M., Danziger I. J., Buson L., 1993, MNRAS, 265, 553
Cole S., Aragon-Salamanca A., Frenk C. S., Navarro J. F., Zepf
S. E., 1994, MNRAS, 271, 781
Davies R. L., Illingworth G., 1983, ApJ, 266, 516
Davies R. L., Sadler E. M., Peletier R. F., 1993, MNRAS, 262, 650
Ellis R. S., et al. , 1997, ApJ, 483, 582
Faber S. M., Jackson R. E., 1976, ApJ, 204, 668
Faber S. M., Trager S., González J., Worthey G., 1995, in Stellar
Populations, eds P. C. van der Kruit and G. Gilmore (Dordrecht: Kluwer), 249
Fisher D., Franx M., Illingworth G. D., 1995, ApJ, 448, 119
Fisher D., Franx M., Illingworth G. D., 1996, ApJ, 459, 110
Forbes D. A., Ponman T. J., Brown R. J. N., 1998, ApJ, 508, L43
Fritze-V. Alvensleben U., Burkert A., 1995, A&A, 300, 58
Garcia A. M., 1993, A&AS, 100, 47
González J. J., 1993, Ph.D Thesis, University of California, Santa Cruz
Gorgas J., Efstathiou G., Salamanca A. A., 1990, MNRAS, 245, 217
Goudfrooij P., Emsellem, E., 1996, A&A, 306, L45
Goudfrooij P., Gorgas J., Jablonka P., 1999, Ap&SS, 269, 109
Governato F., Gardner J. P., Stadel J., Quinn T., Lake G., 1999, AJ,
117, 1651
Halliday C., 1998, Ph.D Thesis, University of Durham, UK
Jablonka P., Martin P., Arimoto N., 1996, AJ, 112, 1415
Jones L. A., 1997, PhD Thesis, Univ, of North Carolina, Chapel Hill
de Jong R. S., Davies R. L., 1997, MNRAS, 285, L1
Jrgensen I., 1997, MNRAS, 288, 161
Jrgensen I., 1999, MNRAS, 306, 607
Kauffmann G., White S. D. M., Guiderdoni B., 1993, MNRAS, 264, 201
Kauffmann G., 1996, MNRAS, 281, 487
Kauffmann G., Charlot S., 1998, MNRAS, 294, 705
Kodama T., Arimoto N., Barger A. J., Aragon-Salamanca A., 1998, A&A,
334, 99
Kormendy J., Bender R., 1996, ApJ, 464, L119
Kuntschner H., 1998, PhD Thesis, Durham
Kuntschner H., 2000, MNRAS, 315, 184
Longhetti M., Rampazzo R., Bressan A., Chiosi C., 1998, A&AS, 130, 251
Maraston C., Greggio L., Thomas D., 2001, Ap&SS, 276, 893
Matteucci F., Ponzone R., Gibson B. K., 1998, A&A, 335, 855
Mehlert D., Bender R., Saglia R. P., Wegner G., 1997, in Mazure, A.,
Casoli F., Durret F. , Gerbal D., eds, Coma Berenices: A New Vision of
an Old Cluster. Word Scientific Publishing Co Pte Ltd, p. 107
O’Connell R. W., 1976, ApJ, 206, 370
Osterbrock D. E., ”Astrophysics of Gaseous Nebulae and Active
Galactic Nuclei”, University Science Books, NY 10012, 1989.
Peletier R., 1989, PhD Thesis, Groningen
Pfenniger D., Norman C., 1990, ApJ, 363, 391
Prugniel P., Golev V., 1999, in Carral P., Cepa J., eds, Star Formation in Early Type Galaxies. ASP Conference Series 163, p. 296
Prugniel P., Simien F., 1996, A&A, 309, 749
Rana M. C., 1991, ARAA, 29, 129
Renzini A., 1999, in Carollo C.M., Ferguson H.C., Wyse R.F.G., eds, Origin of Bulges. Cambridge University Press, Cambridge. p. 9
Schweizer F., Seitzer P., 1992, 104, 1039
Scorza C., Bender R., 1995, A&A, 293, 20
Simien F., de Vaucouleurs G., 1986, ApJ, 302, 564
Somerville R. S., Primack J. R., 1999, MNRAS, 310, 1087
Terlevich A. I., Kuntschner H. , Bower R. G., Caldwell N., Sharples R. M., 1999, MNRAS, 310, 445
Thomas D., Kauffmann G., 1999, in Hubeny I., Heap S., Cornett R., eds, Spectrophotometric Dating of Stars and Galaxies. ASP Conference Proceedings, Vol. 192, p. 261
Trager S. C., 1997, Ph.D Thesis, University of California, Santa Cruz
Trager S. C., Worthey G., Faber S. M., Burstein D., González J. J.,
1998, ApJS, 116, 1
Trager, S. C., Faber, S. M., Worthey, G., González, J. J., 2000, AJ, 120, 165
van den Bergh S., 1998, “Galaxy morphology and classification” Cambridge University Press.
van Dokkum P. G., Franx M., Kelson D. D., Illingworth G. D., 1998,
ApJ, 504, 17
Vazdekis A., 1996, PhD Thesis, Univ. of La Laguna, Spain
Vazdekis A., Casuso E., Peletier R. F.,Beckman J. E., 1996, ApJS,
106, 307
Vazdekis A., Peletier R. F., Beckman J. E., Casuso E.,
1997, ApJS, 111, 203
Vazdekis A., Arimoto N., 1999, ApJ, 525, 144
Whitmore B. C., Miller B. W., Schweizer F., Fall S. M., 1997, AJ,
114, 1797
McWilliam A., 1997, ARAA, 35, 503
Worthey G., Faber S. M., González J. J., 1992, ApJ, 398, 69
Worthey G., 1994, ApJS, 95, 107
Worthey G., Ottaviani D. L., 1997, ApJS, 111, 377
Zabludoff A. I., et al. , 1996, ApJ, 466, 104