Infrared Views of the TW Hya Disk
Abstract
The face-on disk around TW Hya is imaged in scattered light at 1.1 and 1.6 m using the coronagraph in the Near Infrared Camera and Multi Object Spectrometer aboard the Hubble Space Telescope. Stellar light scattered from the optically thick dust disk is seen from 20–230 AU. The surface brightness declines as a power law of r-2.6±0.1 between 45 and 150 AU. The scattering profile indicates that the disk is flared, not geometrically flat. The disk, while spatially unresolved in thermal radiation at 12 and 18 m in observations from the W. M. Keck Observatory, shows amorphous and crystalline silicate emission in its spectrum. A disk with silicate grains of a 1 micron in size in its surface layers can explain the color of the scattered light and the shape of the mid-infrared spectrum. Much larger grains in the disk interior are necessary to fit the millimeter-wave spectral energy distribution, and hence grain growth from an original interstellar size population may have occurred.
1 Introduction
TW Hya (= CD–34 7151, H = 7.6 mag) is a star with a large H emission equivalent width, visual variability and location at 23∘ galactic latitude, and it was thus labeled as “peculiar” by Henize (1976). Rucinski & Krautter (1983) identified it as a spectral type K7Ve T Tauri star far from any molecular cloud (i.e. “isolated”). TW Hya displays classical signs of being surrounded by an accretion disk, including variable H emission (Muzerolle et al., 2000) and excess flux over photospheric in the ultraviolet and near-infrared. In addition it has disk signatures in the form of far-infrared (Rucinski, 1985), submillimeter continuum (Weintraub et al., 1989) and CO line emission (Zuckerman, Forveille, & Kastner, 1995). All of these disk indicators are large for a star as old as TW Hya, which has an age of 8 Myr determined from pre-main sequence evolutionary tracks (Webb et al., 1999). Zuckerman et al. inferred a face-on viewing geometry for the disk based on the small CO line widths they observed. Recent imaging observations do indeed reveal a circular disk. Scattered radiation from the disk has been imaged at visible and near-infrared wavelengths (Krist et al., 2000; Trilling et al., 2001), and circumstellar dust emission has been imaged at a wavelength of 7 mm using the VLA (Wilner et al., 2000).
The Hipparcos mission measured the distance to TW Hya as 567 pc (Wichmann et al., 1998). An eponymous association of 20 star systems has been identified from x-ray and proper motion surveys within 10∘ and 10 pc of TW Hya (de la Reza et al., 1989; Webb et al., 1999; Sterzik et al., 1999; Zuckerman et al., 2001). The approximately coeval members of the TW Hya Association are amongst the products of recent star formation closest to the Sun. However, only three other members have measurable far-infrared excesses from IRAS: HR 4796A, HD 98800, and Hen3-600 (LIR/L⋆=0.01, 0.19, and 0.21, respectively). The optical depth around TW Hya (LIR/L⋆=0.25) is the largest and corresponds to the reprocessing expected for a optically thick disk (Adams, Lada, & Shu, 1987).
The state of disks of intermediate age (107 yr) has not been well studied. The structure of the youngest disks (106 yr), hundreds to thousands of AU in radius around embedded protostars have been copiously studied with millimeter interferometry (Beckwith & Sargent, 1996, e.g.) and visual and infrared imaging (Burrows et al., 1996; Padgett et al., 1999, e.g.). There are only a few examples of older late-type stars surrounded by disks which have been spatially resolved in the near-infrared, most of which are in binary systems (Roddier et al., 1996; Koresko, 1998, e.g.). At ages 107 yr, most known disks orbit early type stars because only in these systems do the disks scatter enough photons to be detectable (e.g. Pic (Smith & Terrile, 1984)). TW Hya, thanks to its proximity to the Sun and its age, is thus an excellent laboratory for studying a disk of intermediate age around a low mass star. This age range is thought to be critical in the evolution of the planetesimals that form the cores of gas giant and terrestrial planets (Weidenschilling & Cuzzi, 1993).
2 Observations and Data Analysis
2.1 NICMOS
TW Hya was observed at two different wavelength bands with the Near Infrared Camera and Multi Object Spectrometer (NICMOS) aboard the Hubble Space Telescope. The star was placed in the coronagraphic hole in camera 2 (0.076 ″ pixel-1, 19″ square field of view). The observational strategy was the same for both – a total of 1216 s of integration taken in three non-destructive multiple-readout (MULTIACCUM) sequences at each of two telescope orientations, rolled 7∘ with respect to each other about the target axis. To minimize time-dependent point spread function (PSF) variations, the rolled image sets were obtained within 40 minutes in a single target visibility period. The first observation was made with the F160W filter (=1.59µm, FWHM=0.40µm) on 1998 August 16 and the second was made with the F110W filter (=1.10µm, FWHM=0.59µm) on 1998 November 25. A summary of the observations is presented in Table 1.
Prior to each set of coronagraphic observations, two 0.86 s target acquisition frames were obtained with the F171M (=1.72 µm, FWHM=0.07 µm) filter. Contemporaneous lamp flats and backgrounds were obtained at F160W for the purpose of locating the coronagraphic hole and enabling good flat-fielding near the hole. Special coronagraphic flat fields at each band were created by modifying a standard high signal to noise ratio on-orbit reference flat field. In a 1616 pixel region around and including the coronagraphic hole, the pixel sensitivities were measured in the F160W internal flat field (hole-finding) image, scaled to F110W if necessary, and replaced in the reference flat.
| Filter | TW Hya visit | Date | Time (UT) | PSF Star | Visit | Date |
|---|---|---|---|---|---|---|
| F160W | 7 | 1998 Aug 16 | 4:05–4:19 | HR 8721 | 81aaHR 8721 drifts behind the coronagraph in this visit due to the loss of lock on one guide star. We used only the first 240 s of integration in which the drift was minimal. In this time, the SNR of HR 8721 is 1.5 times that of TW Hya. | 1998 Aug 11 |
| F160W | 8 | 1998 Aug 16 | 4:35–4:48 | HR 8721 | 81aaHR 8721 drifts behind the coronagraph in this visit due to the loss of lock on one guide star. We used only the first 240 s of integration in which the drift was minimal. In this time, the SNR of HR 8721 is 1.5 times that of TW Hya. | 1998 Aug 11 |
| F110W | 91 | 1998 Nov 25 | 20:15–20:27 | Eri | 80 | 1998 Nov 14 |
| F110W | 92 | 1998 Nov 25 | 20:42–20:55 | Eri | 81 | 1998 Nov 14 |
The MULTIACCUM data sets were processed with “nicred” (MacLeod, 1997). Dark frames prepared by the NICMOS instrument definition team were used to subtract the dark current and correct the detector shading. After bias subtraction, linearization and flat fielding, known bad pixels were replaced with a Gaussian weighted average of neighboring pixels, and the three MULTIACCUM images from each spacecraft orientation were medianed. The best available photometric calibration was applied to the final images (F110W: 1 ADU s-1 = 2.03110-6 Jy and, referenced to Vega, 0 mag = 1775 Jy; F160W: 1 ADU s-1 = 2.19010-6 Jy and 0 mag = 1083 Jy). The uncertainty in this absolute photometric calibration is 2% (M. Rieke, private communication).
In the reduced and calibrated NICMOS images, scattered and diffracted light from the star can be much higher than the disk flux, so the instrumental PSF from an unresolved source must be subtracted. The same observing strategy, including the telescope roll, was used in our GTO program for 14 other stars at F110W and 77 at F160W. These were all processed in the same way as the TW Hya images, and we use targets which do not show extended disk emission as a library of possible PSF stars. The detailed character of the NICMOS PSF changes with time primarily due to thermal variations in the HST optical assembly (Kulkarni et al., 2000) and small shifts of the camera cold mask (Krist et al., 1998); hence some PSF star subtractions produce much lower residuals than others (Schneider et al., 2001). The software IDP3 (Lytle et al., 1999) utilizing cubic convolution interpolation was used to register coronagraphic PSFs to both orientations of the TW Hya observations. Only stars brighter than TW Hya were considered, so the signal to noise ratio in the PSFs were greater than that of TW Hya at every radius, and the PSF subtraction residuals were dominated by systematic uncertainties. To minimize the effect of the cold mask shift, we considered PSFs taken within one month of TW Hya. Five F160W PSFs and one F110W PSF met all criteria.
The fine structure of the broad band PSF is affected by the spectral energy distribution of the source. When subtracting a reference point source, therefore, mismatches in effective temperature can result in increases in the subtraction residuals. At F160W, where several possible PSF observations existed, the chosen PSF is the K4V star HR 8721 (=GL 879) which is quite close to TW Hya (K7) in spectral type. At F110W, however, where many fewer PSFs were taken, the spectral type of the chosen PSF, Eridani, is F4V. We tested that the effect of the color mismatch is small in two ways. First, we subtracted coronagraphic PSFs of different colors and examined the residuals; two examples are plotted in Figure 1. Although color mismatch does increase the residuals, it does not introduce a false excess that could mimic a disk, nor does it significantly affect the shape of the observed TW Hya disk. Second, we created synthetic PSFs of different spectral types with Tiny Tim (Krist & Hook, 1997). Since Tiny Tim models diffraction and not scattering from the coronagraph or other elements in the optical path, its PSFs isolate the effects of color alone. The Tiny Tim subtraction residuals were significant only within 0.6″ of the star and were smaller than those from real PSF subtractions.
The dominant source of photometric uncertainty in the PSF-subtracted images results from uncertainty in how to appropriately scale the PSF to the brightness of TW Hya. There are two possible methods to determine the scaling factor: a) the use of a priori photometry of the two stars and b) the use of measurements made on the subtracted image, including nulling the flux in the diffraction spikes and demanding that the flux approach zero at large radii from the star. The former suffers from the fact that no images of the stars are taken in the broad-band filters used for the coronagraphic imaging, because the stars saturate the detector in the minimum integration time, so stellar models must be employed for the color transformations from the acquisition filters. The latter suffers from the fact that the disk contaminates the measurements.
Our PSF scalings were determined by minimizing the flux in the subtracted diffraction spikes outside the region of apparent disk flux. We scale the PSF images in ADU s-1 for Eri (F110W) by 0.0099 and Gl 879 (F160W) by 0.031. The uncertainty in this scaling is 3% based on the variation between the four diffraction spikes. This uncertainty in the scaling results in approximately a 10% uncertainty in the disk photometry in each band.
2.2 Keck
Images and spectra of TW Hya were taken with the facility Long Wavelength Spectrograph (LWS) (Jones & Puetter, 1993) on the 10 m Keck I telescope on UT 11 December 2000 and 4–5 February 2001. During all three nights, the weather was photometric with low water vapor optical depth. The images were limited by seeing with FWHM =0.′′57 and 0.′′50 at 11.7 µm and 17.9 µm respectively. LWS uses a pixel Boeing Si:As detector, and has a plate scale of 0.08 arcsec pixel-1, resulting in a focal- plane field of view of square. It also provides a dispersion of 0.037 m pixel-1; when combined with a 6 pixel (0.′′48) slit, the resolution is R 120. When viewed through the long slit, vignetting limits the field of view to 8.5″. Observational details are found in Table 2.
In spectroscopic mode, data were taken with the telescope secondary chopped in the same direction as the nod with a frequency of 5 Hz and amplitude of 10′′. Only the on-source chop fell on the detector. In preliminary data analysis, the images were double differenced to subtract the thermal background and bad pixels were corrected by interpolation. The infrared bright star HR 4532 (11.7 m flux density = 53.6 Jy) was observed just after TW Hya to provide atmospheric calibration.
In imaging mode, data were obtained by chopping the secondary at 5 Hz and nodding after 20 s. In some cases, the data were taken by chopping and nodding 5”, so four images appear on the detector; in others the throw was 10” so one image appears on the detector. In either case, every double differenced (i.e. fully background subtracted) image was centroided and recentered to remove telescope drift.
| Mode | Object11HR 4532 was used as the PSF and atmospheric calibrator. The bright star HR 3748 (11.7 µm flux density = 53.6 Jy) was observed for photometric calibration. | Filter center | Filter width | Date | Integration | Airmass |
|---|---|---|---|---|---|---|
| (m) | (m) | Time (s) | ||||
| Imaging | TW Hya | 11.7 | 1.0 | 11 Dec 2000 | 120 | 1.7 |
| TW Hya | 11.7 | 1.0 | 04 Feb 2001 | 216 | 1.7 | |
| PSF | 11.7 | 1.0 | 04 Feb 2001 | 216 | 1.6 | |
| TW Hya | 17.9 | 2.0 | 05 Feb 2001 | 809 | 1.8 | |
| PSF | 17.9 | 2.0 | 04 Feb 2001 | 216 | 1.8 | |
| Spectroscopy | TW Hya | 10.5 | 4.9 | 11 Dec 2000 | 408 | 1.7 |
| Atmos. Cal. | 10.5 | 4.9 | 11 Dec 2000 | 96 | 1.5 |
The spectra of TW Hya and of the atmospheric calibrator were extracted by fitting Gaussians in the spatial direction to the flux at every spectral pixel. The uncertainty in the flux at every wavelength was estimated from the noise in the sky on either spatial side of the long slit image. The location of the Telluric O3 line at 9.6µm was measured in the sky spectra associated with both TW Hya and the standard, from which it was determined that small unrepeatabilities in the grating locator mechanism introduced a small shift in the central wavelength between the two. Before division of the TW Hya spectrum by the standard spectrum, the standard spectrum was shifted in wavelength by 2.5 pixels to match that of TW Hya. After division, the resultant spectrum was multiplied by a blackbody at the temperature of the standard star (3100 K) in order to recover the intrinsic flux distribution. The location of the Telluric ozone line was measured from a cross correlation with atmospheric data from the National Solar Observatory sunspot atlas (Wallace, Livingston & Bernath, 1994) and used for wavelength calibration.
3 Results
3.1 Reflected Light
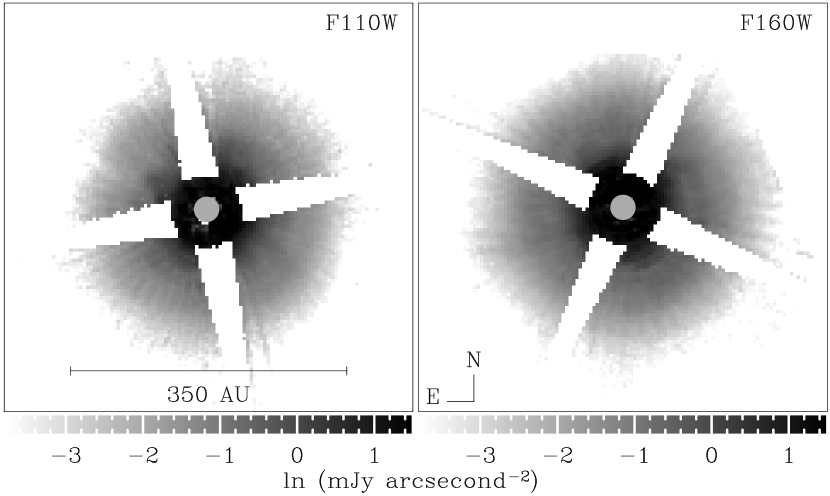
The NICMOS PSF subtracted images of TW Hya at F110W (1.1µm) and F160W (1.6µm) are shown on a natural logarithmic stretch in Figure 2. The disk becomes visible just outside the coronagraph and continues out to a radius of 4′′ (230 AU). The noise computed in the background of the images is 21.1 and 21.2 mag arcsec-2 at F160W and F110W respectively. In the disk, the noise is dominated by subtraction residuals. The spatial resolution of these images is 0.′′15 at F160W and 0.′′12 at F110W.
The diffraction spikes from the stellar cores are particularly sensitive to time-dependent instrument and telescope variations and never subtract out perfectly. Where possible, the pixels corrupted by the spikes in images from one telescope orientation were replaced by uncorrupted pixels from the other orientation. This results in the tapered appearance of the spikes in the final images. The spikes were not masked in the central 0.′′9, because even though they are quite noisy, the very bright inner disk of TW Hya can still be significantly detected above them in the region from 0.′′38 (just outside the edge of the coronagraphic hole) to 0.′′9.
The total disk flux densities were measured in an annulus between radii of 0.′′38 and 4′′ (22228 AU) to be 17.41.8 mJy (12.5 0.1 mag) at F110W and 21.6 2.2 mJy (11.7 0.1 mag) at F160W. At both wavelengths, the pixels masked by the diffraction spikes were replaced by the average value of the flux density at their radii and included in the photometry reported above. The quoted uncertainties are not dominated by photon counting statistics but rather by the systematic uncertainty in how to scale the PSF stars to TW Hya. The measured ratios of scattered to stellar light are 0.024 and 0.021 at F110W and F160W respectively. The surface brightness peaks at a radius of 0.′′5 (29 AU) at 4.51.2 mJy arcsec-2 at F110W and 5.71.4 mJy arcsec-2 at F160W and declines smoothly with radius.
To measure any ellipticity in the disk, the radii of seven independent isophotal contours were calculated as a function of azimuthal angle in the F160W image. For a more significant result, the contours were normalized to a radius of one and averaged in sixteen azimuthal bins. The average isophote was fit with an ellipse using eccentricity (i.e. inclination) and position angle as two free parameters. The resulting best fit had e=0.025 0.014. If this ellipticity is interpreted as due to the inclination of an intrinsically circular disk, the measured inclination is of marginal significance, but a robust 3 upper limit to the inclination is 4∘ from face-on.
The azimuthally averaged disk surface brightnesses at both wavelengths are shown in Figure 3. Between radii of 40 AU and 150 AU, the disk at both wavelengths is well fit by a single power law, r-2.6±0.1 (the solid lines in Figure 3). However, also seen at F160W is a “wiggle” in the surface brightness centered at 1.′′5 (85 AU). Beyond 150 AU, the disk falls off more sharply. Within 40 AU, it appears to flatten.
To obtain the color of the disk, the images at F110W and F160W were ratioed. Since the images in the two filters were taken at quite different telescope orientations, the diffraction spikes corrupt 50% of the ratioed image. There are no significant gradients in the color as a function of radius. The F110W - F160W color averaged over the pixels free from diffraction spike contamination is 0.77 0.10 mag.
Since TW Hya was never observed with the NICMOS F110W and F160W filters without the coronagraph, the color of the star at these two NICMOS bands was estimated based on a stellar photosphere model by Kurucz (1993). The F171M magnitude of the star was measured from the acquisition images to be 7.39 0.04 mag from both the August and November 1998 data. The UBVRI variability of TW Hya, which amounts to 0.5 mag at V and decreases toward the red, has been examined in detail and shown to have an overall period of 1–2 days with much shorter episodes of rapid change (Rucinski & Krautter, 1983; Mekkaden, 1998; Herbst & Koret, 1988). The star becomes bluer by up to 20% as it brightens. The near-infrared variability has not been thoroughly studied, but its level is expected to be low if the underlying cause of the variation is from hot-spots. The high level of consistency in the photometry of our acquisition images from the two dates implies that the star did not vary at 1.7 m between August and November. We assume the star was similarly stable at 1.1 and 1.6µm.
A Kurucz stellar atmosphere model with Teff=3925 K, log(g)=4, and log(Z)=0 was used to extrapolate the F171M magnitude to F110W and F160W giving 8.47 and 7.55 mag respectively. The same model gives H=7.53 and J=8.35 mag (in the CIT system) which are 10% brighter than the values given by Rucinski & Krautter (1983), which had an uncertainty of 5–10%. The inferred J-H color, 0.82, is identical to that obtained by Rucinski & Krautter (1983), so we believe the model extrapolation to the NICMOS filters to be accurate. The F110WF160W stellar color is thus 0.92 mag, while the color of the disk is 0.770.10 mag, so the disk color appears to be marginally (1.3) blue.
Using HST/WFPC2, Krist et al. (2000), also found a slightly blue color for the disk at visual wavelengths (0.6 and 0.8 m) in images made when the star was as bright as it has ever been recorded. The best estimate of color should come from the largest wavelength range, i.e. 0.6–1.6 µm. Over the disk region between 0.5 and 3′′, F606WF160W=2.6 0.2. For TW Hya, F606WF160W=2.5, so the disk appears to scatter neutrally over this 1 µm wavelength baseline.
3.2 Thermal Emission
The radial profiles of TW Hya in thermal emission at 11.7 and 17.9 m are shown in Figure 4 compared with images of the PSF star. TW Hya appears to be the same size as the PSF, i.e. unresolved, at both wavelengths. Integrated flux densities were measured in a synthetic aperture of radius 2.′′4, and were 0.72 0.04 Jy at 11.7µm and 1.45 0.08 Jy at 17.9µm. The measurement uncertainties reflect both statistical and photometric calibration contributions. These flux densities agree very well with those given in the IRAS Faint Source Catalog (1990) at 12 and 25 µm interpolated to our wavelengths of observation. Thus, all of the mid-infrared flux in the IRAS beam arises from quite close to the star. Using a Kurucz model of a K7 photosphere (see Figure 5) to predict the L-band flux and then assuming Rayleigh-Jeans fall-off from 3.5 to 18 µm, we determine the stellar flux density at 11.7 and 18.9 µm as 31 and 13 mJy, respectively. The mid-infrared color temperature of the disk is 214 K from our measurements.
The 8–13m spectrum of TW Hya is shown in Figure 6. The 11.7µm flux density, above, was used to normalize the spectrum, since the full width of that filter is contained in the spectral range. There is a broad hump in this region that, similarly to Sitko, Russell, & Lynch (2000), we attribute to emission by a combination of amorphous and crystalline silicates.
3.3 Detection Limits for Companions
Multiplicity in the TW Hya association as a whole is 50%, including stellar and substellar objects (Zuckerman et al., 2001), although TW Hya itself has no known companion. At the young age of TW Hya any substellar companions would be quite bright in the infrared, so our NICMOS images provide a sensitive way to search for such objects.
We subtracted the two orientations of our F160W data. While the stellar PSF, the instrumental scattering function, and detector artifacts rotate with the aperture, any real features in the unocculted area of the detector are unaffected by a change in the telescope/camera orientation. Subtraction of the these two images has been shown to significantly reduce residual PSF background light (Schneider et al., 1998). Furthermore, since the TW Hya disk is almost face-on, it nulls out nearly perfectly in the roll-subtraction, leaving higher noise but no excess flux. In our data, the roll was only 7°, so point sources in the roll subtraction are separated by more than their FWHM for radii greater than 1.2″. For smaller radii, the roll-subtraction was not useful for point source detection and we used the PSF subtracted images discussed already. In both regions, we assessed the observability of point sources by planting Tiny Tim PSFs and measuring the magnitude that could be recovered at 3 significance. No point sources were found within 3.4″ of TW Hya. The F160W detection limits are shown in Figure 7.
4 Discussion
4.1 Disk Morphology
Given the large fraction (0.25) of the stellar luminosity re-radiated in the mid and far-infrared, the disk must be optically thick. For single scattering by a geometrically flat and optically thick disk, the flux density per square arcsec would be proportional to r-3 (Whitney & Hartmann, 1992). This is somewhat steeper than the r-2.6 we fit in the 40–150 AU annular region and suggests that the disk is instead flared. Perhaps the strongest argument in favor of disk flaring is that the reflected light surface brightness throughout this annulus is much larger than predicted by a flat disk model.
A warm optically thick disk composed of well mixed dust and gas will naturally flare as a consequence of vertical hydrostatic equilibrium (Kenyon & Hartmann, 1987). If dust and gas are well mixed and in interstellar proportions, then the height at which stellar photons are scattered is roughly proportional to the vertical pressure scale height. In this case, the scattering height scales as , where – (Chiang & Goldreich, 1997; D’Alessio et al., 1998; Chiang et al., 2001). Such a well-mixed, flared disk has a scattering brightness profile that scales approximately as (Whitney & Hartmann, 1992), significantly shallower than the average TW Hya profile at disk radii greater than 40 AU. The discrepancy could reflect vertical settling of dust with respect to the gas such that the actual scattering height at these radii is characterized by .
The F160W surface brightness profile between 80 and 130 AU scales like r-2. This annulus corresponds to the “zone 3” defined by Krist et al. (2000) (Figure 8), where the visual scattered light also flattens out in their images. The appearance of the same feature in data from two different instruments lends credibility to the idea that this feature is real. Such a variation in the slope of the surface brightness profile might reflect an undulation or ripple in the height of the disk surface; at 40 AU r 80 AU, the disk surface might be concave down, while at 80 AU r 130 AU, the disk might be concave up. Distortions of the disk may be caused by instabilities afflicting passively heated disks (Chiang, 2000; Dullemond, 2000) or by dynamical effects created by a massive body orbiting in the disk. The detection limit on a massive body at 100 AU from the star is 3MJup. Beyond 150 AU, the surface brightness profile is significantly steeper than r-3. The outer disk is probably completely shadowed.
The face-on geometry of the disk and the average NICMOS data power law for the disk surface brightness are consistent with the WFPC2 data of Krist et al. (2000). Their average power law in the same 40 – 150 AU region (see Figure 8) is -2.4 at F606W (0.6 µm) and -2.6 at F814W (0.8 µm). In addition, the geometry of the disk seen in both HST data sets is consistent with the general morphology reported by Trilling et al. (2001) from ground-based observations. However, there are notable differences between the NICMOS and Trilling et al. data. At their innermost detectable radius of 0.′′94, they report a peak surface brightness at H-band of 6.81.1 mJy arcsec-2. At this same radius, which is well outside our coronagraph, and using the F160W filter which is very similar to H-band, we measure 2.5 0.4 mJy arcsec-2. In addition, they measured a total disk flux density in the 0.′′94–4′′ region of 21.6 3.5 mJy, whereas we measure 12.0 1.2 mJy in that same region. The Trilling et al. surface brightness power law index, -3.3 0.3, is discrepant by 2.5 with the NICMOS index of -2.6 0.1. Systematic uncertainties in their ground-based PSF subtraction under conditions of 0.′′8 seeing may be responsible for the discrepancies.
The large optical depth of the disk makes it difficult to use the scattered light to estimate the density of grains. At any given position in the disk, visible and near-infrared stellar radiation penetrates to an optical depth of one. In contrast, the disk is presumably optically thin at millimeter wavelengths, so millimeter images of the dust emission trace the true surface density.
4.2 Composition
To elucidate the dust composition, we combine information from the spectral energy distribution, mid-infrared imaging, and mid-infrared spectroscopy.
4.2.1 SED Fitting compared to Mid-infrared Imaging
A simple model of the disk using grains that absorb and emit like blackbodies in thermal equilibrium with a star of luminosity 0.3 L⊙ predicts a temperature of 214 K, the 11.7 to 17.9 µm color temperature, at a distance of only 0.9 AU (0.′′04). If the entire disk could be described by such grains, it would therefore not be surprising that it appears point-like. In more sophisticated models of passive circumstellar disks, Chiang & Goldreich (1997) and Chiang et al. (2001) predict the mid-infrared flux emitted by a disk as a function of radius. In their two-layer disk models, the hotter disk surface layer is heated by direct exposure to starlight, while the cooler disk interior is heated by radiation from the surface. To compare predictions of their models with our mid-infrared images, we modeled TW Hya after the prescription of Chiang et al. (2001) which accounts explicitly for grain size distributions and laboratory-based silicate and water ice opacities. Our procedure was first to select disk parameters so as to reproduce the observed SED only. In fitting the disk parameters, no regard is given to any imaging data. Only after a disk model is chosen that provides a satisfactory fit to the SED do we derive surface brightness profiles at 11.7 µm and 17.9 µm based on our fitted model disk. These profiles are convolved with our respective PSFs and compared to our images of TW Hya.
Figure 5 displays the observed and fitted SEDs of TW Hya. Model input parameters are given in Table 3. For additional details of the model, see Chiang et al. (2001). The SED model predicts that 99.8% of the 12 m flux density and 94.6% of the 18 m flux density arise within a radius of 9 AU (2 pixels) of the star. As is shown in Figure 4, at the resolution of the Keck Telescope, no extended emission is predicted by the model. This is consistent with the observations in which no extension is observed.
| Parameter | Value |
|---|---|
| maximum grain radius in surface | 1 m |
| maximum grain radius in interior | 6000 m |
| grain core size distribution () | |
| in disk interior | |
| in disk surface | |
| dust surface mass density | 10 (r/AU)-1 g cm-2 |
| inner disk radius | 0.05 AU |
| outer disk radius | 200 AU |
Outside 0.2 (2) AU, silicate cores are mantled by water ice in the disk interior (surface). The remarkably large grains in the disk interior, consisting of millimeter–centimeter sized cores, and the large total condensable mass in the disk of 0.0014 M⊙ = 470 M⊕, were necessary to fit the millimeter-wave SED measured by Weintraub et al. (1989) and Wilner et al. (2000). The measurement at the particularly long wavelength of 7 mm constrains the grain size distribution in the disk interior to be significantly flatter than the standard interstellar law of , and to possess an upper size cut-off of 6 mm. Had we employed a grain size distribution that was much steeper than and that had an upper size cut-off smaller than 6 mm, the model fluxes between and 7 mm would have been too low compared to the measurements. Our fitted grain size distributions in the disk interior are subject to the well-known degeneracy between grain size and disk surface density (see, e.g., Chiang et al. (2001)); reducing the grain sizes or steepening the size distribution increases the fitted dust surface mass density. However, increasing the fitted dust surface density would threaten to make the disk gravitationally unstable, if gas and dust are present in interstellar proportions in TW Hya. We draw the model-dependent conclusion that grain growth has indeed occurred in the TW Hya disk.
For the particular grain mixture of millimeter to centimeter-sized olivine spheres mantled with water ice employed by our model, and . A somewhat lower dust mass of 130 was derived by Wilner et al. (2000) and Trilling et al. (2001) using the same observational data. The difference arises largely because their assumed dust opacities were 3 times greater than ours (we have multiplied their opacities by 100 to isolate the dust component). Their values were based on the Hildebrand (1983) measurement of = 10 cm2 g-1 in the dark molecular cloud NGC 7023 and extrapolated to longer wavelengths with , where is taken to be 1.0 by Wilner et al. and 0.9 by Trilling et al. The assumed similarity between dust in NGC 7023 and dust in TW Hya has no direct observational evidence.
Pollack et al. (1994) showed that a single power law description of the opacity is inaccurate for real dust materials. They computed opacities for a variety of grain species, including water ice, silicates, organics, iron, and troilite. For their “Composite (50%)” grains, extrapolated values of range between 0.03 and 0.06 cm2 g-1, assuming that the values of that they compute between 650 m and 2.3 mm can be extended to 7 mm. These opacities are a factor of 3 smaller than the ones employed in our disk model fit, and a factor of 5–10 smaller than the ones adopted by Wilner et al. (2000) and Trilling et al. (2001).
Krist et al. (2000) model only 33 of ISM-like dust to reproduce their observed surface brightness profiles in scattered light at = 0.6 and 0.8 m. The profiles depend more strongly on the distribution of dust at high altitude above the midplane than on the distribution of dust in the midplane where most of the mass probably resides. Krist et al. assume a Gaussian vertical density profile for micron-sized dust. However, substantially more dust could reside at the midplane of their disk model without detracting from the goodness of their surface brightness fits. Thus, their 33 could easily represent a lower limit on the actual dust mass.
We conclude that the TW Hya disk probably contains several hundred Earth masses of condensed silicates and ices. This dust mass is several times larger than the typical dust masses estimated for T Tauri star disks in the Taurus and Ophiuchus star forming regions on the basis of 1.3 mm dust continuum observations (Osterloh & Beckwith, 1995; Andre & Montmerle, 1994). Large, centimeter sized, grains were necessary to fit the slope of the millimeter-wave SED. A grain size distribution with smaller grains is characterized by a significantly steeper slope, , and is difficult to reconcile with the observations. The presence of these very large particles is good evidence for grain growth within the disk.
Total mass estimates for TW Hya’s disk in the literature vary by another two orders of magnitude depending on the assumed gas:dust ratio. The standard interstellar gas:dust mass ratio of 100:1 may be incorrect for an older disk like that around TW Hya. Kastner et al. (1997) find only 11 M⊕ in H2 gas based on 13CO observations and a standard interstellar H2/CO ratio. The low mass accretion rate estimated by Muzerolle et al. (2000), an order of magnitude less than for typical T Tauri stars, also suggests that the gas in this system has been depleted. The gas-to-dust mass ratio does not formally enter into our model SED-fitted disk; only enough gas and/or vertical circulation of gas is assumed to lift dust grains 3–5 vertical scale heights above the midplane to comprise the flared, superheated disk atmosphere. If we assume the primordial TW Hya disk had the canonical 100:1 gas to dust ratio, then it once contained 0.14 M⊙. This early disk with 25% of the star’s mass would have been marginally gravitationally stable.
4.2.2 Mid-infrared spectrum
The broad silicate emission feature cannot be explained by amorphous silicates alone since they have a pronounced peak at 9.6µm and fall off rapidly to longer wavelengths. Our spectrum agrees very well with the published result of Sitko, Russell, & Lynch (2000), who note the near absence of a peak at 11.2 m, within the uncertainties of their data. Our spectrum hints at a peak at 11.2 m; furthermore, to create the full width of the feature requires substantial flux longward of 10µm. Crystalline species are probably responsible. Data of this spectral resolution are inadequate to constrain the exact crystalline structure, however. Magnesium and iron-rich species all have peaks in the 10 – 11.3µm region (Jger et al., 1998). Silicate emission features become less prominent as the grains get larger, so that by a size of 5µm their mid-infrared spectrum is nearly flat (Skinner, Barlow & Justtanont, 1992). The TW Hya spectrum suggests that its emitting grains must therefore be 5m in size.
5 Conclusions
TW Hya is surrounded by a optically thick dust disk which must be flared to account for the large apparent size of the disk seen in scattered light and for its thermal SED. A ripple in the surface brightness at 85 AU and the steep decline in surface brightness beyond 150 AU could be due to thermal instabilities or dynamical effects. However, no companion to TW Hya is detected down to a mass of 10 MJup at distances greater than 50 AU from the star.
Although TW Hya looks like a classical T Tauri star in terms of its H emission, its disk shows signs of evolution. To fit the large submillimeter and millimeter flux densities measured from TW Hya, our SED models require a grain size distribution in the disk interior dominated by large, millimeter-centimeter sized, icy grains. Large grains, which dominate the mass of the disk, presumably grew from coagulation of smaller grains in the disk. The initial mass of TW Hya’s disk in gas and dust may be several times the typical T Tauri star disk mass, which may help account for its long, 8 Myr, lifetime. The thermal emission remains spatially unresolved at the resolution of the Keck Telescope, in accord with theoretical expectations.
References
- Adams, Lada, & Shu (1987) Adams, F. C., Lada, C. J., & Shu, F. H. 1987, ApJ, 312, 788
- Andre & Montmerle (1994) Andre, P. & Montmerle, T. 1994, ApJ, 420, 837
- Beckwith & Sargent (1996) Beckwith, S. V. W. & Sargent, A. I. 1996, Nature, 383, 139
- Burrows et al. (1997) Burrows, A., Marley, M., Hubbard, W. B., Lunine, J. I., Guillot, T., Saumon, D., Freedman, R., Sudarsky, D., & Sharp, C. 1997, ApJ, 491, 856
- Burrows et al. (1996) Burrows, C. J. et al. 1996, ApJ, 473, 437
- Chiang & Goldreich (1997) Chiang, E. I. & Goldreich, P. 1997, ApJ, 490, 368
- Chiang (2000) Chiang, E. I. 2000, Ph.D. Thesis, California Institute of Technology
- Chiang et al. (2001) Chiang, E. I., Joung, M. K., Creech-Eakman, M. J., Qi, C., Kessler, J. E., Blake, G. A., & van Dishoeck, E. F. 2001, ApJ, 547, 1077
- D’Alessio et al. (1998) D’Alessio, P., Canto, J., Calvet, N., & Lizano, S. 1998, ApJ, 500, 411
- de la Reza et al. (1989) de la Reza, R., Torres, C.A.O., Quast, G., Castilho, B.V., & Vieira, G.L. 1989, ApJ343, L61
- Dullemond (2000) Dullemond, C. P. 2000, A&A, 361, L17
- Henize (1976) Henize, K. G. 1976, ApJS, 30, 491
- Herbst & Koret (1988) Herbst, W. & Koret, D. L. 1988, AJ, 96, 1949
- Hildebrand (1983) Hildebrand, R. H. 1983, QJRAS, 24, 267
- Jger et al. (1998) Jger, C., Molster, F. J., Dorschner, J., Henning, T., Mutschke, H., & Waters, L. B. F. M. 1998, A&A, 339, 904
- Jones & Puetter (1993) Jones, B., & Puetter, R. 1993, in Proc. SPIE vol. 1946, 610
- Kastner et al. (1997) Kastner, J. H., Zuckerman, B., Weintraub, D. A., & Forveille, T. 1997, Science, 277, 67
- Kenyon & Hartmann (1987) Kenyon, S. J. & Hartmann, L. 1987, ApJ, 323, 714
- Koresko (1998) Koresko, C. D. 1998, ApJ, 507, 145
- Krist & Hook (1997) Krist, J. E. & Hook, R., N. 1997, in The 1997 HST Calibration Workshop with a New Generation of Instruments, p. 192
- Krist et al. (1998) Krist, J. E., Golimbowski, D. A., Schroeder, G., & Henry, T. J. 1998, PASP, 110, 1046
- Krist et al. (2000) Krist, J. E., Stapelfeldt, K. R., Ménard, F. Padgett, D. L. & Burrows, C. J. 2000, ApJ, 538, 793
- Kulkarni et al. (2000) Kulkarni, V.P., Hill, J.M., Schneider, G., Weymann, R.J., Storrie-Lombardi, L.J., Rieke, M.J., Thompson, R.I., & Januzzi, B. 2000, ApJ, 536, 36
- Kurucz (1993) Kurucz, R. 1993, CD-ROM No. 13, GSFC
- Lytle et al. (1999) Lytle, D., Stobie, E., Ferro, A., & Barg, I. 1999, in ASP Conf. Ser. 172, Astronomical Data Analysis Software and Systems 8, ed. D. M. Mehringer, R. L. Plante, & R. A. Roberts (San Francisco: ASP), 445
- MacLeod (1997) MacLeod, B., A. 1997, HST Calibration Workshop Proceedings, ed. S. Casertano
- Mekkaden (1998) Mekkaden, M. V. 1998, A&A, 340, 135
- IRAS Faint Source Catalog (1990) IRAS Faint Source Catalog Ver. 2.0. 1990, ed. Moshir, M. et al.
- Muzerolle et al. (2000) Muzerolle, J., Calvet, N., Briceño, C., Hartmann, L., & Hillenbrand, L. 2000, ApJ, 535, L47
- Osterloh & Beckwith (1995) Osterloh, M. & Beckwith, S. V. W. 1995, ApJ, 439, 288
- Padgett et al. (1999) Padgett, D. L., Brandner, W., Stapelfeldt, K. R., Strom, S. E., Terebey, S., & Koerner, D. 1999, AJ, 117, 1490
- Pollack et al. (1994) Pollack, J. B., Hollenbach, D., Beckwith, S., Simonelli, D. P., Roush, T., & Fong, W. 1994, ApJ, 421, 615
- Roddier et al. (1996) Roddier, C., Roddier, F., Northcott, M. J., Graves, J. E., & Jim, K. 1996, ApJ, 463, 326
- Rucinski & Krautter (1983) Rucinski, S.M. & Krautter, J. 1983, A&A, 323, L49
- Rucinski (1985) Rucinski, S.M. 1985, AJ, 90, 2321
- Schneider et al. (1998) Schneider, G., Thompson, R.I., Smith, B.A. and Terrile, R.J, 1998, Space Telescopes and Instrumentation V., at Astronomical Telescopes and Instrumentation, (SPIE Proceedings Series), 3356, 222.
- Schneider et al. (2001) Schneider, G., Becklin, E. E., Smith, B. A., Weinberger, A. J., Silverstone, M. & Hines, D. C. 2001, AJ, 121, 525
- Skinner, Barlow & Justtanont (1992) Skinner, C. J., Barlow, M. J. & Justtanont, K. 1992, MNRAS, 255, 31P
- Smith & Terrile (1984) Smith, B. A. and Terrile, R. J., 1984, Science, 226, 1421
- Sitko, Russell, & Lynch (2000) Sitko, M., Russell, & Lynch. 2000, AJ, 120, 2609
- Sterzik et al. (1999) Sterzik, M. F., Alcala, J. M., Covino, E., & Petr, M. G. 1999, A&A, 346, L41
- Trilling et al. (2001) Trilling, D.E., Koerner, D. W., Barnes, J.W., Ftaclas, C., & Brown, R. H. 2001, ApJ, 552, L151
- Wallace, Livingston & Bernath (1994) Wallace, L., Livingston W., & Bernath., P. 1994, N.S.O. Technical Report #1994-01 (available at ftp://argo.tuc.noao.edu/pub/atlas/spot2atl/)
- Webb et al. (1999) Webb, R. A., Zuckerman, B., Platais, I., Patience, J., White, R. J., Schwartz, M. J., McCarthy, C. 1999, ApJ, 512, L63
- Weidenschilling & Cuzzi (1993) Weidenschilling, S. J. & Cuzzi, J. N. 1983, Protostars and Planets III, ed., E.H. Levy & J. I. Lunine (U. AZ Press), 1031
- Weintraub et al. (1989) Weintraub D. A., Sandell G., & Duncan W. D. 1989, ApJ, 340, 69
- Whitney & Hartmann (1992) Whitney, B. A. & Hartmann, L. 1992, ApJ, 395, 529
- Wichmann et al. (1998) Wichmann, R., Bastian, U., Krautter, J., Jankovics, I., & Rucinski, S.M. 1998, MNRAS301, 39
- Wilner et al. (2000) Wilner, D. J., Ho, P. T. P., Kastner, J. H. & Rodríguez, L. F. 2000, ApJ, 534, L101
- Zuckerman, Forveille, & Kastner (1995) Zuckerman, B., Forveille, T., & Kastner, J. H. 1995, Nature, 373, 494
- Zuckerman et al. (2001) Zuckerman, B., Webb, R. A., Schwartz, M., & Becklin, E. E. 2001, ApJ, 549, L233

.