Evolution of the Ionizing Radiation Background and Star Formation in the Aftermath of Cosmological Reionization
Abstract
The temporal evolution of the ionizing UV background radiation field at high redshift provides a probe of the evolution of the early star formation rate. By comparing the observed levels of absorption in the highest redshift quasar spectra to the predictions of a hydrodynamic simulation, we determine the evolution of the photoionization rate () for neutral hydrogen in the intergalactic medium, over the redshift range . After accounting for sampling variance, we infer a sharp increase in from to , probably implying reionization at this redshift. We find a decrease in from to , at significance. This feature is a generic signature in the aftermath of reionization, entirely consistent with the cosmological reionization process being completed at .
This generic feature is a result of a significant change in the star formation rate subsequent to the cosmological reionization. There is an abrupt rise of the temperature of the intergalactic medium due to photo-heating, when it is reionized. This translates to a correspondingly sudden jump in the Jeans mass and a dramatic suppression of gas accretion onto the most abundant (sub-galactic) halos at the epochs of interest. The star formation rate suffers a temporary setback in the aftermath of reionization, resulting in a temporary decrease in the amplitude of the ionizing radiation field.
1 Introduction
The conventional wisdom based on the standard theory of structure formation says that the universe was reionized sometime in the redshift range (Barkana & Loeb 2001). The relatively large uncertain range in redshift reflects our imperfect knowledge of the density fluctuations on small scales, star formation processes (e.g., efficiency, IMF, etc.) and feedback processes at high redshift. The latest observations of high redshift quasars (e.g., Fan et al. 2001) are beginning to probe the lower bound of that window and suggestions have been made that we may be witnessing the end phase of the cosmological reionization process at , based solely on the appearance of a precipitous drop of transmitted flux at the rest-frame Ly wavelength near in a single quasar spectrum (Becker et al. 2001, hereafter B01; Barkana 2001).
In this Letter we present an analysis of the ionizing background radiation field in the redshift range , using the absorption measurements in B01. Combining with previous data at lower redshift, we find that, coming from high redshift, the ionizing radiation intensity displays a sharp rise at peaking at , a significant downturn from to by a factor of , and subsequently a consistent ascent from to by a factor of . All these three features are consistent with a picture that the cosmological reionization was near completion at .
The first feature (i.e., the initial sharp rise) has been predicted by several authors previously (Cen & Ostriker 1993; Gnedin 2000a; Miralda-Escudé, Haehnelt, & Rees 2001). At present, the primary uncertainty for its determination observationally is the possibility that the high level of absorption in the single observed quasar at is some kind of anomaly (we show that it cannot be a simple statistical fluctuation in the absorption level). Additional observed quasars at will be critical in this regard. Here we focus our attention on the relatively more robust measurements of the ionizing radiation field at and show that the observed pause in the rise of the amplitude of the ionizing radiation field from to could be due to suppression of star formation following reionization at .
2 Reionization and the Evolution of the Ionizing Background
Assuming the model in which the IGM is almost completely ionized and the radiation background is uniform, we infer the evolution of the H I ionization rate by requiring that the mean flux decrement in simulated spectra matches the observed values in the upper panel of Figure 2 of B01. This method was pioneered by Rauch et al. (1997) and extended in McDonald et al. (2000,2001) and McDonald & Miralda-Escudé (2001). We apply the standard procedure using a hydrodynamic simulation of a flat universe dominated by a cosmological constant and cold dark matter (CDM), with CDM density , Hubble parameter (), baryon density , power spectrum normalization , and large-scale primordial power spectrum slope . The simulation is Eulerian, with box size divided into cells (see Cen et al. 2001 for a more complete description). We use outputs from the simulation at and , interpolating linearly between them when necessary. We start by assuming the model in the simulation correctly represents the universe, and then consider whether or not our results are self-consistent.
Figure 1 shows the results for the evolution of , the hydrogen ionization rate in units of .
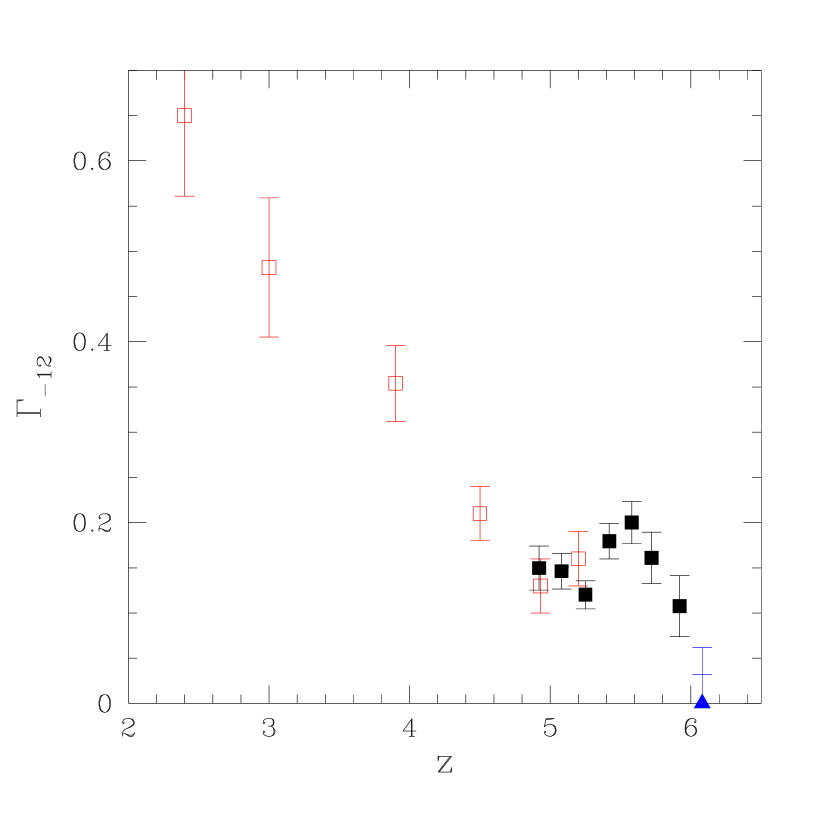
The open squares are the old results from McDonald & Miralda-Escudé (2001). The filled squares are the new results, leaving out the highest redshift point, which we analyze differently than the others because the detected transmission is not significant and the detector noise needs to be taken into account carefully (this last point is represented by the triangle with 1 and 2 upper limit bars). The equally spaced bins in redshift are chosen to coincide with the majority of the points in Figure 2 of B01. As discussed below, the results have been rescaled to apply for the value of the baryon density favored by big bang nucleosynthesis, (Burles & Tytler 1998), instead of the value in the simulation, .
In detail, we determine a value of and its error for each B01 point using the simulation as follows: First, we construct the optical depth field, (i.e., the spectrum is ) along a large number of lines of sight through the simulation cube ( for each face), normalized using an arbitrary value of (i.e., for low density gas in ionization equilibrium). We then randomly choose many sets of five -long segments of spectrum, so that each set forms a combined spectrum of the length of our redshift bins, (note that this length depends slightly on cosmology and redshift, i.e., the spectra should be shorter by 26% at in our model, corresponding to a 13% increase in the estimated error bars, which we account for in the plot). For each chunk, we determine the value of that produces the observed value of the mean transmitted flux fraction, [ in the notation of B01]. The mean of the values for all the chunks is the inferred value of for this observed data point, and the dispersion is the estimated error. Most redshift bins in B01 have several measured values of in them, so we combine the inferred values of within the bin using an error weighted average which takes into account fractional overlap when necessary (because of the overlapping points, our error bars are correlated, in the sense that point-to-point differences are more significant than the error bars seem to indicate).
To test that the treatment of segments as independent does not underestimate the error by ignoring correlation along the lines of sight on larger scales, we repeat this procedure using segments, and find almost identical error bars.
We now turn to the highest redshift point in B01. The given value and error are ; however, B01 state that the sky subtraction has an uncertainty of order 1, so we use when interpreting this point. B01 also give the measured transmitted flux fraction in the region of the spectrum corresponding to Ly absorption by gas at this redshift, , and point out that the implied constraint on the Ly optical depth is actually stronger than the direct one. We assume the same sky subtraction error for this point as for the Ly region.
We start by analyzing the Ly region. We use the method described above to create chunks of spectra of the appropriate length. For each value of we compute for many different chunks, and compute the mean likelihood of producing given the error . The relative likelihood function peaks at , but does not decrease significantly for arbitrarily small . The likelihood has dropped by factors of 0.61 and 0.14 at and 0.135, respectively, so we call these the 1 and 2 upper limits.
We analyze the Ly region in two ways. First we repeat the above procedure assuming a constant factor 0.13 suppression of the continuum by Ly absorption corresponding to gas at (see the lowest redshift point in B01). The inferred 1 and 2 upper limits on are 0.032 and 0.056. These constraints are stronger than the ones from the Ly region; however, they are not as realistic as possible because they ignore fluctuations in the Ly absorption in the Ly region, which might either weaken the constraints, by completely obscuring substantial portions of the Ly region, or strengthen the constraints, by providing regions of significantly less than average absorption where residual transmission through the Ly forest could be observed. We simulate this effect by creating Ly absorption spectra to serve as the continua for the Ly region, using the simulation output and our inferred value of from the lowest redshift B01 point. This procedure results in essentially identical constraints to the assumption of a flat continuum: and 0.062 at 1 and 2, respectively.
It may be possible to obtain even stronger constraints by using Ly, as suggested by B01 (X. Fan, private communication), or by considering the limits imposed by individual pixel values (D. Weinberg, private communication). However, if reionization is on-going or just completed at , the detailed constraints on obtained from any kind of analysis based on a simulation in which reionization happened much earlier probably are not very meaningful ( is not well defined if the radiation background is inhomogeneous). Our formal constraints on near should be taken simply as an indication that something dramatic is happening at this redshift and we think it likely indicates the end of the cosmological reionization process.
The overall amplitude of our results (but not the evolution over a short redshift interval) is sensitive to the cosmological model and gas temperature-density relation in the simulation, as one can see from the equation for optical depth at a point in real space (i.e., ignoring peculiar velocities and thermal broadening) with baryon overdensity and gas temperature :
| (1) |
where is the Hubble parameter at redshift [ at high in a CDM universe]. Sensitivity of the inferred value of to the power spectrum of density perturbations enters through the term, as well as the peculiar velocities, and additional sensitivity to temperature can arise from the thermal broadening. The effect of changing or on the inferred value of is easy to correct for, but the effect of changing the temperature-density relation or the input power spectrum generally must be investigated by running additional simulations. We do this using approximate Hydro-PM simulations (hereafter HPM, Gnedin & Hui 1998), after checking that they give similar results to our fully hydrodynamic simulation (to % in ) when performed using the same model and initial conditions. First, we analyze HPM simulations with a variety of different temperature-density relations and find that the thermal broadening is not very important to the derivation of , so the dependence is accurate (to in the power law index), as long as the temperature is specified at the most relevant density for the transmission features that determine , which we find to be . The temperature in our hydrodynamic simulation at this density is K, but in the aftermath of reionization the temperature of the gas would be higher than this (e.g., Miralda-Escudé & Rees 1994), requiring a correction. The amplitude of the initial density fluctuations in our hydrodynamic simulation is higher by a factor on the scale of the Ly forest than the measurement of McDonald et al. (2000), which was independently confirmed by Croft et al. (2001). By varying the amplitude, , in HPM simulations, we determine that (roughly). The required ionizing background decreases when increases because the voids where transmission is observed become deeper (i.e., becomes smaller). In the end, the corrections for power spectrum amplitude and temperature may roughly cancel (if we use K), so the points in Figure 1 should be reasonably accurate; however, we emphasize that the temperature at this redshift is unknown, so significant uncertainty in remains.
The reader may be wondering at this point “could the inferred decrease in from to possibly be real”? It appears to be a 3 effect and we think it could be real. The same trend is clearly visible to the eye in the bottom panel of Figure 2 of B01, once we consider that the value of their is generally expected to increase with time. The signal is almost equally strong in the spectra of two different quasars. These two are at almost identical redshift so a continuum-related effect might be the same in both; however, the observed % increase in transmission fraction between and would require an increase in the quasar continuum. Finally, we have every reason to believe that our statistical error calculation is correct. The scatter in the inferred values of for different B01 points in each redshift bin is in perfect agreement with our estimated error bars (e.g., for 10 degrees of freedom when we treat the three average values of for the bins in the range as fitting parameters to be estimated from the individual points with error bars). Note that, while it may look small to the eye, the fractional error on the point is actually larger than the fractional errors on the following two points. Purely adiabatic temperature evolution , which constitutes the steepest possible evolution in temperature (by ignoring the subsequent photo-heating), instead of the essentially constant temperature in the simulation, would only cause a 7.5% relative change in the values of the s.
We think that the sharp rise of the radiation intensity at may be a fairly strong case for the completion of cosmological reionization at that epoch. However, note that a value of is not inconsistent in principle with a fully ionized IGM, since the neutral fraction near the mean density is still only . One is hampered by the high optical depth of an IGM that is still mostly ionized. It will be extremely valuable to look for additional signatures of cosmological reionization in its aftermath, where more flux is transmitted. We will therefore focus our discussion on the radiation field at .
3 Discussion
In the standard hierarchical structure formation theory smaller structures began to form earlier than larger structures, simply because the amplitude of density fluctuations is a decreasing function of scale and in linear theory density fluctuations on all scales grow at the same rate. Under this general picture the universe is conventionally thought to be reionized mostly by photons from stellar systems more massive than , where atomic line cooling provides an efficient energy sink for gas that is collected and heated during gravitational collapse of halos (Haiman, Rees & Loeb 1997; Gnedin & Ostriker 1997). Less massive systems, after having produced an insufficient amount of stars (Pop III) to reionize the universe at an earlier epoch, can no longer form stars due to lack of cooling processes (Haiman, Thoul, & Loeb 1996; Haiman, Rees & Loeb 1997; Tegmark et al. 1997).
After reionization, the temperature of the intergalactic gas is raised to K (Cen & Ostriker 1993; Miralda-Escudé & Rees 1994; Gnedin & Ostriker 1997). The subsequent effect of suppression of gas accretion onto small halos has been noted by many authors (Efstathiou 1992; Thoul & Weinberg 1996; Quinn, Katz, & Efstathiou 1996; Kepner, Babul, & Spergel 1997; Navarro & Steinmetz 1997; Kitayama & Ikeuchi 2000; Gnedin 2000b). The extent of this effect somewhat varies among the studies and it is clear that our current treatment of the reionization process is far from ideal. Obviously, a sufficiently adequate study would require simulations that include an accurate treatment of three-dimensional radiative transfer process and have high enough spatial and mass resolution. We do not have simulations of this caliber at present and attempt to only make a semi-quantitative calculation to illustrate a consequence of reionization on star formation and the background radiation field, which we believe captures a primary feature of this process in a simple and intuitive fashion.
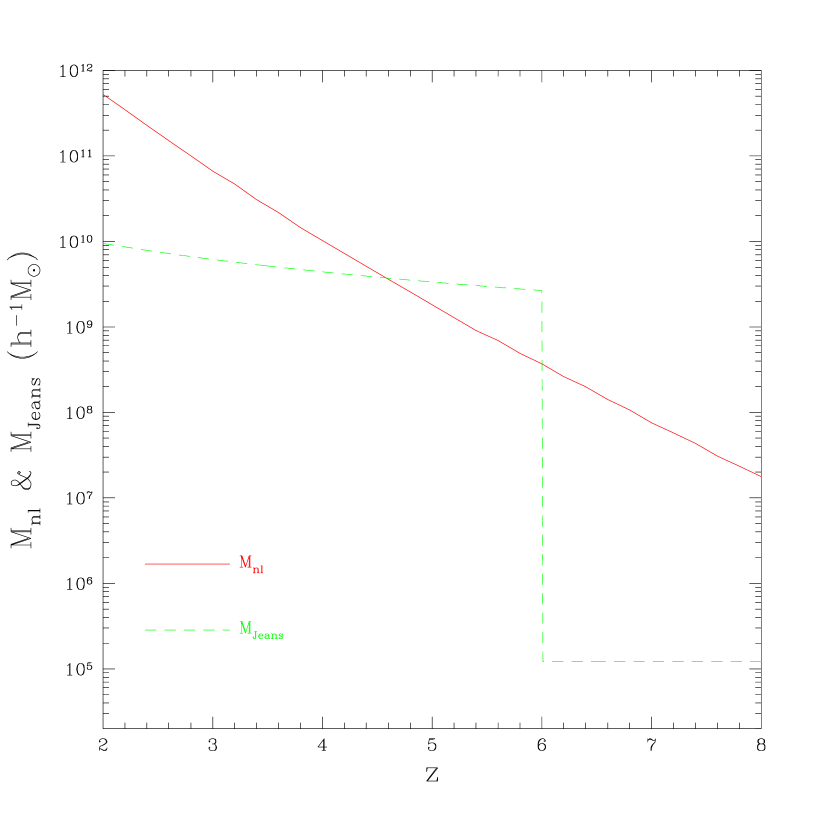
Figure 2 shows the nonlinear mass and linear Jeans mass as a function of redshift. The nonlinear mass is the mass within a top-hat window at which the linear rms density fluctuation is unity, and (Peebles 1993), where is the gas temperature and is the present matter density parameter. The assumption of instantaneous reionization is just for the sake of plotting convenience and is not required to make our point. In a real universe the reionization phase is complicated and is thought to progress on a time scale of a Hubble time, during which the mean (volume weighted) radiation field builds up slowly up to a value of approximately erg/cm2/hz/sec/sr at Lyman limit, followed by a brief phase, when the majority of the baryons are ionized and a sudden jump in the amplitude of the mean radiation field intensity at Lyman limit to erg/cm2/hz/sec/sr occurs within a redshift interval of a fraction of unity (Miralda-Escudé et al. 2000; Gnedin 2000a). We simply call this epoch of a sudden rise in radiation field the reionization epoch, marking the completion of the reionization process.
We see, in Figure 2, that gas is able to accrete onto halos with mass greater than the Jeans mass prior to . Stars formed inside halos with are presumably primarily responsible for producing most of the ionizing photons immediately prior to , where atomic line cooling provides an efficient cooling process. Right after reionization, there is a dramatic inversion of the situation from to , where Jeans mass surpasses the nonlinear mass. Such a switch has some interesting consequences: gas accretion onto the most abundant halos (about the nonlinear mass) is suddenly suppressed, simply because the ambient gas has a temperature that is higher than the virial temperature of the typical halos and is incapable of cooling to a lower temperature. Gas accretion and thus star formation may be brought to a halt in typical halos (larger halos with higher virial temperature may still be able to form stars with a somewhat reduced rate due to the same effect). Below , nonlinear mass again becomes larger than the Jeans mass and gas is once again capable of accreting onto typical halos with mass , and star formation rate bounces back. We note that the cosmological model adopted may not be correct in fine details and is used only to illustrate the process. Therefore, the exact crossing redshift of the two curves at should not be taken at its face value, but rather as a generic feature.
Let us now relate the star formation rate to the ionizing background radiation field. Our treatment is intended to be simple but we think it contains the essence of the relevant physical processes. For gas immersed in a meta-galactic ionizing radiation background, locally hydrogen photoionization is balanced by hydrogen recombination (to levels or higher):
| (2) |
where is the photoionization rate (see Figure 1), , and are the neutral hydrogen, ionized hydrogen, and electron number densities, respectively, and is the hydrogen recombination rate. Averaging spatially both sides of equation (1) gives
| (3) |
where is the clumping factor of all gas participating in receiving ionizing photons (i.e., excluding gas in optically shielded regions). For simplicity we have assumed that the gas is composed entirely of hydrogen. Since the neutral hydrogen fraction is much less than unity, we have simply replaced both the ionized hydrogen and electron number densities by the total hydrogen number density . The mean free path of an ionizing photon in comoving length units is then
| (4) |
where is the hydrogen photoionization cross-section. Using , sec-1 (see Figure 1) and cm2 we obtain in comoving megaparsecs:
| (5) |
Evidently, at , the mean free path of an ionizing photon is much smaller than the Hubble radius and radiative processes may be treated “locally”, by ignoring cosmological effects. But the mean free path is much greater than the typical separation between ionizing sources (comoving Mpc). In this case we may relate the mean comoving specific emissivity of ionizing radiation (in units of erg/sec/hz/comoving cm3) to the mean ionizing radiation intensity (in units of erg/sec/hz/sr/cm2) by
| (6) | |||||
The evolution of is complicated and currently undetermined without detailed simulations that ionized the universe at . However, simple estimates may be made to gauge the range of variation. In the linear regime we have and in the extreme nonlinear regime ; the actual situation is likely to be between these two limiting cases, parameterized as with . Inserting into equation (5) yields
| (7) |
with . Clearly, in order for to increase with redshift, as indicated by observations in the redshift range as shown in Figure 1, the comoving specific emissivity or comoving star formation rate has to increase with redshift. Taking the values shown in Figure 1 in the range , we obtain . (This fit used the 3rd through 5th filled squares in Figure 1. We obtain a flatter slope, , with an acceptable , if we add the 2nd point, at .) This requires a decrease in star formation rate from to as . Our analysis is in qualitative agreement with Barkana & Loeb (2000), who pointed out that the decrease in star formation subsequent to cosmological reionization may be detectable in the evolution of number counts of faint galaxies by NGST. It may be that we have detected this signature in the evolution or .
4 Conclusions
In hierarchical structure formation theory the evolution of the meta-galactic ionizing radiation background may be characterized by five distinct phases: 1) from to (which marks the end of reionization) the radiation field builds up slowly before individual ionizing HII regions overlap (“pre-overlap period”; Gnedin 2000a) 2) in a brief period up to the majority of baryons are ionized in a short time scale and the radiation field jumps up by about two to three orders of magnitude, completing the reionization process (“reionization epoch”); 3) from to the radiation field pulls back significantly due to a decrease in star formation rate as a result of reionization (we call this “aftermath of reionization”); 4) to the radiation field rises steadily with contributions from both stars in larger galaxies and quasars; 5) to the radiation field drops off sharply due to the combined effect of decreasing star/quasar formation rate and cosmological effects. Consistent with theoretical calculations, observations have confirmed phases (4) (e.g., McDonald & Miralda-Escudé 2001; shown in Figure 1 of this paper) and (5) (e.g., Shull et al. 1999).
In this paper we have interpreted the absorption in the spectra of the latest high redshift quasars in the redshift range , searching for salient features pertaining to the “reionization epoch” (phase 2) and the “aftermath of reionization” (phase 3). Quite intriguingly, we appear to be seeing the “aftermath of reionization” and the end of the “reionization epoch” in these spectra, both of which seem to point to a cosmological reionization redshift of . Specifically, a predicted decrease of star formation rate in the aftermath of the reionization is indicated by the observations. While a few more high redshift quasars are required to check that the complete absorption at is not some kind of anomaly (e.g., a rare leftover neutral patch in an almost completely ionized universe), it appears that our conclusion with regard to the “aftermath of reionization” is more secure due to its independence of any single spectrum. It is still very urgent to enlarge the observational data sets to greatly firm up the conclusion and sharpen up the rate of evolution. If confirmed by future observations, this may be indication that our current understanding of galaxy formation may be approximately valid up to redshift . Furthermore, as suggested by Barkana & Loeb (2000), it will be important to independently detect this “aftermath of reionization” signature in the evolution of number counts of faint galaxies by NGST.
Since we appear to be observing the period directly after reionization, it becomes more important to perform dedicated simulations that achieve reionization at the appropriate redshift . This paper should be understood as an attempt to guide that effort by making some preliminary comparisons between data and an existing simulation in which reionization occurred somewhat earlier. Such future simulations are quite demanding, because not only high resolutions are required but also an accurate treatment of three-dimensional radiative transfer must be implemented.
References
- (1) Barkana, R., & Loeb, A. 2000, ApJ, 539, 20
- (2) Barkana, R., & Loeb, A. 2001, Phys. Rep., 349, 125
- (3) Barkana, R., 2001, astro-ph/0108431
- (4) Becker, R.H., et al. 2001, astro-ph/0108097
- (5) Burles, S. & Tytler, D. 1998, ApJ, 507, 732
- (6) Cen, R., & Ostriker, J.P. 1993, ApJ, 417, 404
- (7) Cen, R., Ostriker, J.P., Prochaska, J.X., Wolfe, A.M. 2001, in preparation
- (8) Croft, R. A. C., Weinberg, D. H., Bolte, M., Burles, S., Hernquist, L., Katz, N., Kirkman, D., & Tytler, D. 2001, ApJ, submitted (astro-ph/0012324)
- (9) Djorgovski, S.G., Castro, S.M., Stern, D., & Mahabal, A.A. 2001, astro-ph/0108069
- (10) Efstathiou, G. 1992, MNRAS, 256, 43
- (11) Fan, X., et al. 2001, astro-ph/0108063
- (12) Gnedin, N.Y. 2000a, ApJ, 535, 530
- (13) Gnedin, N.Y. 2000b, ApJ, 542, 535
- (14) Gnedin, N. Y. & Hui, L. 1998, MNRAS, 296, 44
- (15) Gnedin, N.Y., & Ostriker, J.P. 1997, ApJ, 486, 581
- (16) Haiman, Z., Thoul, A.A., & Loeb, A. 1996, ApJ, 464, 523
- (17) Haiman, Z., Rees, M.J., & Loeb, A. 1997, ApJ, 476, 458
- (18) Kepner, J.V., Babul, A., & Spergel, D.N. 1997, ApJ, 487, 61
- (19) McDonald, P. & Miralda-Escudé, J. 2001, ApJ, 549, L11
- (20) McDonald, P., Miralda-Escudé, J., Rauch, M., Sargent, W. L. W., Barlow, T. A., Cen, R., & Ostriker, J. P. 2000, ApJ, 543, 1
- (21) McDonald, P., Miralda-Escudé, J., Rauch, M., Sargent, W. L. W., Barlow, T. A., & Cen, R. 2001, ApJ, in press (astro-ph/0005553)
- (22) Miralda-Escudé, J., Haehnelt, M., & Rees, M.J. 2000, ApJ, 530, 1
- (23) Miralda-Escudé, J. & Rees, M. J. 1994, MNRAS, 266, 343
- (24) Kitayama, T., & Ikeuchi, S. 2000, ApJ, 529, 615
- (25) Navarro, J.F., & Steinmetz, M. 1997, ApJ, 478, 13
- (26) Rauch, M., Miralda-Escudé, J., Sargent, W. L. W., Barlow, T. A., Weinberg, D. H., Hernquist, L., Katz, N., Cen, R., & Ostriker, J. P. 1997, ApJ, 489, 7
- (27) Tegmark, M., Silk, J., Rees, M.J., Blanchard, A., Abel, T., & Palla, F. 1997, ApJ, 474, 1
- (28) Peebles, P.J.E. 1993, Principles of Physical Cosmology (Princeton: Princeton University Press)
- (29) Shull, J.M., et al. 1999, AJ, 118, 1450
- (30) Thoul, A.A., & Weinberg, D.H. 1996, ApJ, 465, 608
- (31) Quinn, T., Katz, N., & Efstathiou, G. 1996, MNRAS, 278, L49