Radio–Optically Selected Clusters of Galaxies
We present a sample of candidate groups and clusters of galaxies at intermediate redshift over an area of sq. degrees at the South Galactic Pole, selected by using optically identified radio sources from the NRAO VLA Sky Survey as tracers of dense environments. Out of these candidates, have a counterpart in the literature while of them are previously unknown clusters. This paper presents the cluster selection technique, based on the search of excesses in the optical surface density of galaxies near identified radiogalaxies, and the first spectroscopic results aimed to confirm the presence of a cluster. Spectroscopy for candidates led to the detection of clusters at redshift in the range , with estimated velocity dispersions ranging from values typical of clusters to those of galaxy groups. These results show that this technique represents a powerful tool for the selection of homogeneous samples of intermediate redshift clusters over a wide range of richness.
Key Words.:
catalogs – radio continuum: galaxies – galaxies: clusters: general – cosmology: observations1 Introduction
Groups and clusters of galaxies are the largest gravitationally bound, observable structures, and much can be understood about the global cosmological properties of the universe by studying their properties – such as their dynamical status and evolution, their morphological content and interactions with the environment. To this aim, it is of fundamental importance to gather cluster samples representative of different dynamical structures – from groups to rich clusters – in a wide range of redshift and covering large areas of the sky.
Existing wide-area cluster samples based on visual inspection of optical plates (Abell et al. Abell (1989)) or obtained through objective algorithms (EDCC, Lumsden et al. Lumsden (1992); APM, Dalton et al. Dalton94 (1994)) are limited to redshift less than , and suffer from the possibility of misclassification due to projection effects along the line of sight. Even more difficult is the detection of groups of galaxies, due to their low density contrast with respect to field galaxy distribution. In the optical band, cluster samples at higher have been built over selected areas of few square degrees (Postman et al. Postman (1996); Scodeggio et al. Scodeggio (1999)). Alternatively, the X-ray emission of the hot intracluster medium has been widely used to build distant cluster samples, but this technique suffers from the limited sensitivity of wide-area X-ray surveys and from the possibility of evolutionary effects (Gioia et al. Gioia (1990); Henry et al. Henry (1992); RDCS, Rosati et al. Rosati (1998)).
A different approach – complementary to purely optical or X-ray cluster selection methods – is the use of radiogalaxies as suitable tracers of dense environments. Faranoff–Riley I and II radio sources have been shown to inhabit different environments at different epochs and proved to be efficient tracers of galaxy groups and clusters (Prestage & Peacock Prestage (1988); Hill & Lilly Hill (1991); Allington–Smith et al. Allington–Smith (1993); Zirbel Zirbel97 (1997)). FRI sources are found on average in rich groups or clusters at any redshift, and are associated with elliptical galaxies, with the most powerful FRI often hosted by a cD or double nucleus galaxy. FRII radio sources are typically associated with disturbed ellipticals and they avoid rich clusters at low (Zirbel Zirbel96 (1996)).
Since there is no significant correlation between the radio properties of galaxies within a cluster with the cluster X-ray luminosity (Feigelson et al. Feigelson (1982); Burns et al. Burns (1994)), or richness (Zhao et al. Zhao (1989); Ledlow & Owen Ledlow (1996)), as well as between the properties of group members and the radio characteristics of the radiogalaxies (Zirbel Zirbel97 (1997)), radio selection should not impact on the X-ray or optical properties of the clusters found in this way.
Radiogalaxies can thus be used to study the global properties of galaxy groups and clusters, such as their morphological content, dynamical status and number density, as well as the effect of the environment on the radio emission phenomena.
We used the NRAO VLA Sky Survey (NVSS, Condon et al. Condon (1998)) publicly available data to build a sample of radio-optically selected clusters through optical identifications of radio sources and search of excesses in the surface density of galaxies around these radiogalaxies. The NVSS survey offers indeed an unprecedented possibility to study a wide-area, homogeneous sample of radio sources down to relatively low flux levels, together with a positional accuracy suitable for optical identifications.
In a previous paper (Zanichelli et al. Zanichelli (2001), hereafter Paper I) we described how we extracted a radio source catalogue from the NVSS maps and the optical identification procedure that led to the compilation of a radiogalaxy sample. In this paper we discuss the cluster finding method used for the compilation of a new sample of candidate groups and clusters of galaxies, and present the first observational results that spectroscopically confirmed the presence of a group or cluster for out of the successfully observed candidates.
This paper is structured as follows: in Sect. 2 we give a summary of the properties of the radio and optical data samples used for the cluster search. In Sect. 3 we describe the cluster finding method. The new sample of candidate clusters is presented in Sect. 4. Spectroscopic observations of a subsample of candidate clusters, aimed to obtain an observational confirmation of the presence of a cluster are presented and discussed in Sects. 5 and 6.
2 The data
In the following two Sects. we recall the properties of the radiogalaxy sample and of the optical galaxy catalogue that have been used during this search. For more details on the radio source catalogue and the definition of the radiogalaxy sample, refer to Paper I.
2.1 The radiogalaxy sample
The radio source catalogue has been extracted from maps of the GHz NRAO VLA Sky Survey (Condon et al. Condon (1998)) and consists of pointlike and double radio sources down to a flux limit of mJy beam-1 over an area of sq. degrees at the South Galactic Pole.
Optical identifications of NVSS radio sources have been made with galaxies brighter than in the EDSGC catalogue (Nichol et al. Nichol (2000)) using a search radius of , i.e. positional accuracy for the faintest sources. The initial sample of optical counterparts consists of radiogalaxies, of them having a pointlike radio morphology at the NVSS resolution of .
As shown in Table 2 of Paper I, the contamination level due to spurious identifications varies according to the radio morphological classification, ranging from about for the lists of optical counterparts of pointlike radio sources and “close” radio pairs (separation between components ), to about for the list of optical counterparts of “wide” radio doubles ().
In order to obtain a more reliable sample, the radiogalaxy data set used in the search of candidate clusters has been selected among these optical identifications on the basis of radio-optical distance and galaxy magnitude. The uncertainty in the optical identification sample is indeed the only source of contamination that can be limited when selecting cluster candidates by looking for excesses in surface galaxy density near the identified radiogalaxies. Other contamination terms – like the probability of detecting a candidate by chance coincidence of the radiogalaxy position with an optical density excess, or the possibility that the optical excess itself is intrinsically spurious, i.e. due to chance superpositions of galaxies along the line of sight – cannot in fact be reduced unless one knows the redshift distribution of the galaxies.
From the initial sample of optical counterparts we thus selected those radiogalaxies having . This constraint introduces a selection effect against faint sources in the radio sample, whose positional uncertainty is typically .
Furthermore, as our aim is to select candidate clusters at intermediate redshifts, we discarded those radiogalaxies brighter than magnitude . In fact, considering the magnitude – redshift relation typical of radiogalaxies obtained in the R band by Grueff & Vigotti (Grueff (1977)), and using color indexes for elliptical galaxies given in Frei & Gunn (Frei (1994)), this cut in magnitude corresponds to a redshift lower limit of .
With these constraints, the final radiogalaxy sample that has been taken into account for the search of candidate clusters consists of radiogalaxies, and the mean, expected contamination level due to spurious optical identifications has been lowered to about .
2.2 The galaxy catalogue
The Edinburgh–Durham Southern Galaxy Catalogue (EDSGC, Nichol et al. Nichol (2000)) lists galaxies over a contiguous area of sq. degrees at the South Galactic Pole. About one half of this area is currently covered by our radiogalaxy sample and has been considered for the search of cluster candidates.
The EDSGC has been obtained from COSMOS scans of IIIa–J ESO/SERC plates at high galactic latitude (). The automated star-galaxy separation algorithm used for the EDSGC guarantees a completeness and a stellar contamination down to magnitudes .
Magnitudes have been calibrated via CCD sequences, providing a plate-to-plate accuracy of and an rms plate zero-point offset of magnitudes.
The EDSGC incompleteness starts to exceed the only above (Collins et al. Collins92 (1992)). When looking for candidate clusters we thus decided to make optical galaxy counts down to the magnitude limit : as the radiogalaxy sample reaches , this choice makes it possible to point out also those regions of high galaxy surface density associated to the optically faintest radio sources in our sample.
3 Joint radio–optical cluster selection
The cluster finding method we adopted is based on optical counts of galaxies in cells, followed by a smoothing of these counts with a Gaussian function and by the definition of a detection threshold for the selection of significative excesses in the surface galaxy density. The density peaks that are found near an optically identified NVSS radio source are included in the cluster sample.
Both to keep in evidence any possible inhomogeneities in optical counts and to make the data handling easier, we divided the EDSGC galaxies brighter than in adjacent sky maps corresponding to the central regions of the UKST plates that cover the radio source catalogue area.
The detection threshold is built in terms of the mode and rms of galaxy counts over each of these sky regions. Despite the possibility of small intra-plate variations in the photometric accuracy of the optical data, we considered the choice of a “local” threshold for each plate preferable to a “global” one, over the whole sky region, as the latter choice would introduce in the cluster sample incompleteness effects that depend on the cluster location in the sky.
The optical count matrix for each sky region has been built by defining a regular grid of cells and by counting galaxies in these cells. The size of each cell has been chosen to be , to optimize the statistics of galaxy counts as well as to point out the presence of structure in the spatial distribution of galaxies.
Since radiogalaxies tend to reside in different environments – from groups of galaxies to rich clusters – depending on their Faranoff–Riley morphological classification (Zirbel Zirbel97 (1997)), a careful choice of the size for the smoothing function is needed to avoid selection effects in favour of a particular environment. Too large a size could translate into a lack of detections of distant clusters, whose angular sizes are small. A small size could resolve a nearby cluster in many substructures thus leading to the spurious detection of many candidates relative to the actual cluster, or, if the optical surface density excess in each substructure is less than the selected threshold (see below), could lead to a lack of detections. This last case is the most likely for clusters at moderate having irregular morphologies, like the Abell I types (Abell Abell58 (1958)), where subclumps in the galaxy distribution are seen. Given the redshift range we expect to cover with our cluster sample, we decided to adopt, for the smoothing of the optical counts, a circular Gaussian function of FWHM, which is about half an Abell radius at .
We then looked for significative excesses in the optical surface galaxy density: for each smoothed matrix, we determined the mode and rms of the optical surface density.
The threshold we adopted for the detection of density excesses is defined on each smoothed plate in terms of and as , that is we consider significative only those peaks where the galaxy surface density exceeds by at least the value of the mode determined over the whole plate. This choice can introduce selection effects in favour of “core-dominated”, regular clusters, and against irregular ones, where galaxies are less concentrated in the cluster core itself.
Finally, from this list of significant peaks we selected only those for which a radiogalaxy belonging to the considered smoothed matrix is found at a maximum distance of from the density peak position. To determine the list of density peaks, no constraint has been set on the number of connected cells above the threshold. Radiogalaxies themselves are not required to belong to pixels whose optical surface density is above . Given the definition of the Abell radius, , this search distance corresponds to the Abell radius of a cluster at .
In the case of nearer clusters, this choice will favour the selection of those candidates where the radiogalaxy is located in the central region of the cluster. A larger value of the search distance would however increase the probability of detecting spurious associations between density peaks and radiogalaxies.
In Fig. 1 we show as an example the smoothed matrix relative to the UKST plate 412: regions with higher surface galaxy density are represented by increasing grey levels; the superimposed contours are given as above . The radiogalaxies having and present in this sky region are shown as well, marked with diamonds, except for the two associated with a known candidate cluster (see Sect. 4), that are marked with an asterisk. The radio–optically selected cluster candidates are marked as small circles around the position of the associated radiogalaxy. For clarity, only the ACO/Abell and EDCC clusters found in this sky region are plotted in Fig. 1: they are marked with big circles, whose radius is equal to the cluster Abell radius. The fact that the clusters A2878, 2904 and E536 do not seem very conspicuous in this galaxy density map can be explained in terms of the different optical data set and the different scale used by Abell et al. (Abell (1989)) and Lumsden et al. (Lumsden (1992)) to look for overdensities in the galaxy distribution.
4 The candidate cluster sample
By applying the cluster finding method described in the previous Section, we obtained a sample of candidate clusters associated to NVSS radio sources identified with with EDSGC galaxies of magnitude . Among these candidates, are associated to NVSS pointlike sources, to NVSS “close” double sources, and to NVSS “wide” doubles. The sample covers an area of sq. degrees at the South Galactic Pole and the uncertainty on the candidate cluster position is .
As a further step in the compilation of the cluster sample we looked for candidates in common with other cluster catalogues, considering a candidate as already “known” if the radiogalaxy and the optical centroid are found inside an Abell radius from the cluster centre.
Out of candidates, were found to be associated with a known cluster according to the above definition. In six cases two candidates are associated with the same known cluster. We detected Abell poor clusters with measured redshift, out of the ACO/Abell (Abell et al. Abell (1989)) rich clusters present in this sky region ( of them being listed in the EDCC as well), EDCC (Lumsden et al. Lumsden (1992)) clusters, clusters from the APM catalogue (Dalton et al. Dalton94 (1994), Dalton97 (1997)), groups selected from the ESO Slice Project survey (Ramella et al. Ramella (1999)). Finally, in one case the candidate corresponds to a cluster identified with an X-ray source in the Einstein Medium Sensitivity Survey (Stocke et al. Stocke (1991)).
To evaluate , we used the measured cluster redshift when available; otherwise, we used the estimated redshift or, in the case of EDCC clusters, values of estimated by the catalogue authors. In thirty-six cases the association with previously known clusters has been made on the basis of a measured redshift in the literature, while for the other only an estimated redshift is available.
The detection of these known clusters can be interpreted as a further indication that this radio-optical selection method is powerful in the search of cluster candidates.
Among the known clusters, host a pointlike NVSS radio source, while and are respectively associated to “close” and “wide” double radio sources.
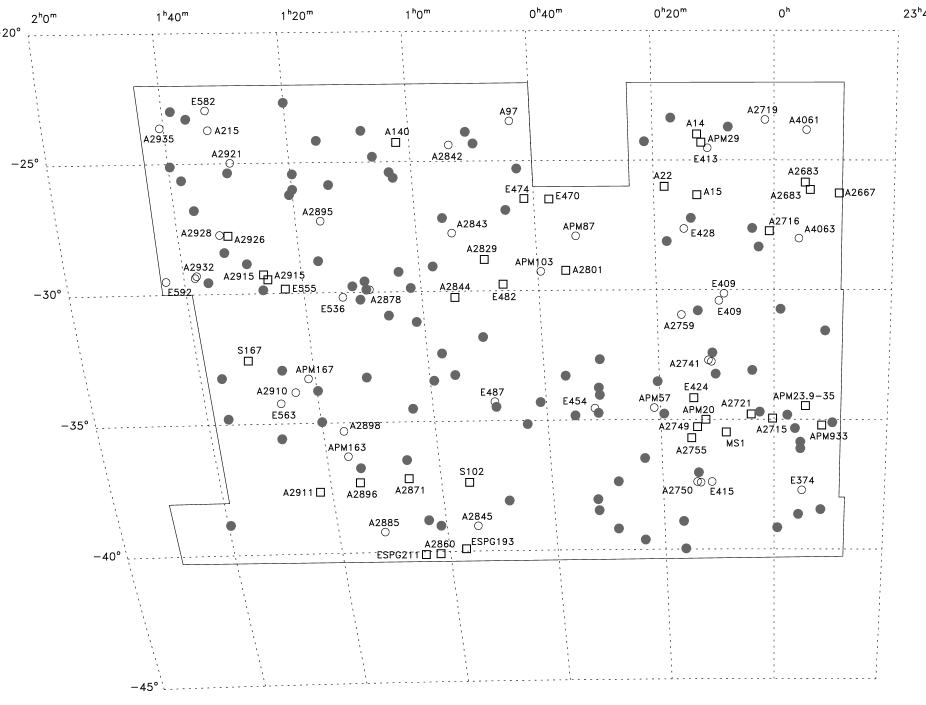
In Fig. 2 the sky distribution of the known candidates (empty symbols marked with the cluster name) and of those candidates without a counterpart in the literature (filled symbols) is shown.
The use of this bivariate radio–optical selection method, based on the condition that an optical excess is considered as a reliable candidate cluster only if it is associated with a radiogalaxy, makes it possible to detect cluster candidates whose reliability, in terms of their optical surface density alone, would be in many cases too low to be included in catalogs based on pure optical selection methods.
The total contamination present in the cluster sample, due to the probability of chance coincidence between a radiogalaxy and an excess in the optical surface galaxy density, has been estimated as follows: we repeated the search of cluster candidates coupling the smoothed matrix relative to each UKST plate with the radiogalaxies belonging to another plate. By applying the same cluster finding criteria described above, we found a contamination percentage of in our sample of candidate clusters at intermediate redshifts. As the actual radiogalaxy sample instead of a random-generated one has been used, this is an estimate of the effective contamination, that is also the contamination term due to the presence of spurious radio-optical associations among the radiogalaxies is taken into account.
An assessment of the reliability of the method is provided by the association with known clusters and measurements on new candidates. Therefore, in the next two Sects. we briefly report on those candidates hosting a radiogalaxy whose redshift is known from previous surveys. This search has been made using the NASA Extragalactic Database 111The NASA/IPAC Extragalactic Database (NED) is operated by the Jet Propulsion Laboratory, California Institute of Technology, under contract with the National Aeronautics and Space Administration.. In Sect. 5 and 6 the results obtained from a spectroscopic observative run for a first set of new cluster candidates are presented. The whole candidate cluster sample will be presented in a following paper.
4.1 Previously known clusters
The naming convention for cluster candidates in our sample is as follows: first digits identify the number of the UKST plate on which the candidate has been found; letters are used to distinguish among the various radio morphologies (pointlike or double sources) and to identify candidates associated to more than one radiogalaxy. Last digits in the name are the sequential number of the radio source on that UKST plate.
295BN07: this candidate is found to correspond to A2860, whose measured redshifts is (Struble & Rood, Struble (1999)). The radiogalaxy lies at (Vettolani et al. Vettolani98 (1998)) so that 295BN07 is considered actually coincident with a known cluster.
295D24: the candidate is found inside one Abell radius from the ESP Group 193 (Ramella et al., Ramella (1999)). The radiogalaxy has been detected at in the ESP survey (Vettolani et al. Vettolani98 (1998)). ESP group 193 lies at redshift so that the association is considered real.
352N25: the candidate has been found to be associated with the ACO cluster A2871. In A2871 the presence of galaxy systems at different redshifts has been detected (Katgert et al., Katgert96 (1996)) respectively at ( galaxies) and ( galaxies). The radiogalaxy has measured redshift from the ENACS survey (Katgert et al. Katgert98 (1998)) so 352N25 seems to be associated with one of these two substructures.
411N35: the radiogalaxy in this candidate lies inside an Abell radius from the center of the EDCC cluster E482, whose measured redshift is . The radiogalaxy has (Collins et al. Collins95 (1995)); 411N35 is thus not actually coincident with E482. However, measured velocities in the E482 field include a set of galaxies with , indicating the possible presence of a superimposed structure at about the same redshift as the radio source.
4.2 New cluster candidates
From the publicly available data of the Las Campanas Redshift Survey (Shectman et al. Shectman (1996)) we obtained the redshift of two radiogalaxies associated with the new candidate clusters 297BN04 () and 293D22 (). At from the radiogalaxy in 297BN04 we found a galaxy with measured velocity . Finally, a further redshift has been found in the ESP survey for the radiogalaxy associated to the candidate 294N04: (Vettolani et al. Vettolani98 (1998)). No redshift data for other galaxies near these radiogalaxies are available, so these velocity measurements cannot be used to confirm or not the presence of a cluster.
5 Optical observations
A first set of visually good candidate clusters associated with pointlike NVSS radio sources have been observed with the m ESO telescope at La Silla, with the EFOSC1 spectrograph in multislit mode. Moreover, photometry of each field in the r-Gunn filter has been acquired during the first night of observation to achieve magnitude – corresponding to roughly – with a photometric accuracy better than mag.
The targets for spectroscopic observations were chosen on the basis of these photometric observations. For candidate clusters the spectra of the radiogalaxy and about companions were acquired. Observations were made with the grism, characterized by a wavelength range , central wavelength and dispersion . The slit width was chosen to be while the slit length varied in order to optimize the number of acquired spectra. The resolution on the spectra was about .
Exposures of He-Ar lamps for wavelength calibration have been acquired through the same masks used in the scientific exposures. Spectroscopic dome flats proved not to be useful during the data reduction phase: due to the low quality of the slit profiles achieved with the mask Punching Machine, the flatfielding process did not significantly help in the extraction of spectra. As we did not apply flat field correction, the obtained spectra are not flux calibrated.
5.1 Data reduction
Multislit spectroscopic data reduction has been made interactively by means of the IRAF package. Reduction steps involved bias subtraction, spectra extraction, spectra wavelength calibration. We found no need to correct for dark current. This procedure has been applied both to astronomical and to calibration lamps exposures.
We acquired a total number of galaxy spectra, plus stars, for successfully observed candidates, and determined the velocity of galaxies from absorption and, in a few cases, emission lines by means of the RVSAO package. None of the radiogalaxies we observed show emission lines in their spectra. Templates for the cross-correlation consist of galaxy and star spectra known from previous observative programs: the galaxies were observed during the Edinburgh–Milano Cluster Survey (Collins et al. Collins95 (1995)) with EFOSC1 and with the same spectral resolution as our observations. The stars come from ESO Slice Project (Vettolani et al. Vettolani97 (1997)) observations with the fiber spectrograph OPTOPUS.
To allow for cleaning of cosmic rays, multiple exposures were taken for each field, for a total exposure time varying from to min. In Fig. 3 the direct imaging exposures of these candidates are shown, together with the targets we selected for spectroscopy.
In Table 1 the r-Gunn magnitudes, the measured velocities and their associated errors are given for each galaxy we observed in the selected candidate clusters. As can be seen from Table 1, for out of the observed galaxies the S/N was not good enough to measure the redshift. The typical magnitude for galaxies with measured redshift is . Stars are marked with an asterisk. The high errors associated to some velocity measurements are mainly due to the low spectral S/N.
| NAME | N | Notes | |||
|---|---|---|---|---|---|
| 294N15 | 1 | 19.69 | 89125 | 86 | |
| 2 | 19.09 | 92061 | 60 | ||
| 3 | 17.67 | 19572 | 300 | E | |
| 4 | 17.42 | 90363 | 41 | R | |
| 5 | 19.78 | 85666 | 122 | ||
| 6 | 20.10 | - | - | ||
| 7 | 18.55 | 89065 | 50 | ||
| 8 | 20.05 | 89540 | 46 | ||
| 9 | 15.62 | 21186 | 48 | ||
| 10 | 20.53 | 61998 | 100 | ||
| 11 | 20.13 | - | - | ||
| 12 | 20.33 | 90960 | 259 | ||
| 295N35 | 1 | 20.90 | - | - | |
| 2 | 19.50 | 23511 | 130 | ||
| 3 | 19.68 | 31000 | 300 | ||
| 4 | 19.08 | 79401 | 309 | ||
| 5 | 19.53 | 97000 | 300 | ||
| 6 | 20.10 | 78568 | 107 | ||
| 7 | 17.84 | 79110 | 379 | R | |
| 8 | 21.29 | 14800 | - | E | |
| 9 | - | - | - | ||
| 10 | 20.51 | 98925 | 114 | ||
| 11 | 18.38 | 79863 | 198 | ||
| 349N02 | 1 | 19.59 | 34237 | 300 | |
| 2 | 18.80 | 29093 | 130 | ||
| 3 | 18.81 | 63333 | 85 | ||
| 4 | - | - | - | ||
| 5 | 18.42 | - | - | ||
| 6 | 16.03 | 33698 | 49 | R | |
| 7 | 18.83 | - | - | ||
| 8 | 19.69 | 123966 | 300 | E | |
| 9 | 20.84 | 146819 | 300 | E | |
| 10 | 21.45 | - | - | ||
| 350N71 | 1 | 16.97 | 42919 | 74 | |
| 2 | 17.16 | 42586 | 86 | ||
| 3 | 20.62 | 80696 | 112 | ||
| 4 | 17.73 | 69681 | 169 | ||
| 5 | 16.23 | 56290 | 80 | ||
| 6 | 18.79 | 56099 | 280 | ||
| 7 | 17.80 | 69904 | 109 | ||
| 8 | 17.91 | 70484 | 82 | R | |
| 9 | 18.44 | 70824 | 119 | ||
| 10 | 18.36 | 70060 | 121 | ||
| 352N47 | 1 | 19.77 | 51980 | 137 | |
| 2 | 16.68 | 51988 | 114 | R | |
| 3 | 19.60 | 81249 | 258 | ||
| 4 | 18.06 | 51233 | 150 | ||
| 5 | 20.85 | - | - | ||
| 6 | 18.70 | 52499 | 150 | ||
| 7 | 20.02 | 86464 | 300 | ||
| 8 | 19.63 | 63814 | 220 | ||
| 9 | 19.90 | 97518 | 172 | ||
| 10 | 19.81 | - | - |
| NAME | N | Notes | |||
|---|---|---|---|---|---|
| 352N63 | 1 | 18.23 | 54587 | 71 | |
| 2 | 19.01 | 55881 | 189 | ||
| 3 | 21.28 | - | - | ||
| 4 | 20.07 | - | - | ||
| 5 | 16.73 | 54698 | 118 | ||
| 6 | 18.38 | 54699 | 76 | R | |
| 7 | 18.29 | 53486 | 84 | ||
| 8 | 18.74 | 55275 | 78 | ||
| 9 | 20.60 | - | - | ||
| 10 | 20.32 | - | - | ||
| 11 | 19.85 | - | - | ||
| 352N75 | 1 | 19.57 | - | - | |
| 2 | 18.91 | 40809 | 144 | ||
| 3 | 18.41 | 40764 | 62 | ||
| 4 | 18.59 | 54726 | 131 | ||
| 5 | 19.18 | 55821 | 271 | ||
| 6 | 16.15 | 55316 | 123 | ||
| 7 | 16.59 | 40492 | 63 | R | |
| 8 | 18.63 | 41140 | 68 | ||
| 9 | 20.11 | - | - | ||
| 10 | 18.04 | - | - | ||
| 11 | 18.16 | - | - | ||
| 12 | 18.43 | 37199 | 151 | ||
| 13 | 17.60 | 40377 | 54 | ||
| 14 | 20.33 | - | - | ||
| 409N03 | 1 | 18.15 | 64532 | 127 | |
| 2 | 17.44 | 47583 | 429 | ||
| 3 | 16.38 | 41309 | 50 | R | |
| 4 | 20.01 | - | - | ||
| 5 | 20.15 | 46345 | 145 | ||
| 6 | 17.65 | 46765 | 61 | ||
| 7 | 15.89 | 47150 | 55 | ||
| 8 | 18.30 | 46879 | 57 | ||
| 9 | 20.31 | - | - | ||
| 10 | 19.46 | 47460 | 247 | ||
| 11 | 19.83 | 46630 | 457 | ||
| 12 | 19.62 | - | - | ||
| 409N15 | 1 | 20.06 | 97958 | 75 | |
| 2 | 17.44 | 45837 | 39 | ||
| 3 | 18.74 | 45687 | 42 | ||
| 4 | 18.54 | 45682 | 46 | ||
| 5 | 16.62 | 45280 | 31 | R | |
| 6 | 20.43 | 85363 | 98 | E | |
| 7 | 19.00 | 45343 | 58 | ||
| 8 | 20.53 | 38136 | 79 | ||
| 9 | 20.67 | 43891 | 100 | E | |
| 10 | 19.98 | 78625 | 65 | ||
| 11 | 19.59 | 79383 | 165 | ||
| 409N44 | 1 | 19.80 | 98238 | 172 | |
| 2 | 20.02 | 69000 | 200 | ||
| 3 | 19.91 | 41416 | 158 | ||
| 4 | 17.62 | 40147 | 61 | R | |
| 5 | 19.69 | 41300 | 300 | ||
| 6 | 18.07 | 58828 | 73 | ||
| 7 | 17.71 | 40332 | 74 | ||
| 8 | 18.18 | 39350 | 42 |
| NAME | N | Notes | |||
|---|---|---|---|---|---|
| 9 | 18.26 | 58805 | 195 | ||
| 412N23 | 1 | 20.40 | 29350 | 300 | |
| 2 | 19.81 | 49474 | 110 | ||
| 3 | 17.69 | 77698 | 144 | R | |
| 4 | 17.13 | 48980 | 80 | ||
| 5 | 19.14 | 32075 | 200 | ||
| 6 | 16.88 | 30590 | 300 | ||
| 7 | 18.78 | 76139 | 98 | ||
| 8 | 20.83 | - | - | ||
| 9 | 19.84 | 47521 | 78 | E | |
| 10 | 19.07 | 29934 | 57 | ||
| 11 | 19.52 | 60417 | 300 | ||
| 475N50 | 1 | 18.99 | 61683 | 84 | |
| 2 | 19.86 | 64065 | 300 | ||
| 3 | 18.24 | 62720 | 300 | ||
| 4 | 18.59 | 63050 | 300 | ||
| 5 | 17.98 | 61318 | 94 | ||
| 6 | 17.34 | 63758 | 130 | ||
| 7 | 17.98 | 64280 | 173 | ||
| 8 | 17.49 | 63160 | 108 | R | |
| 9 | 20.79 | - | - | ||
| 10 | 19.62 | 63421 | 124 | ||
| 11 | 19.47 | - | - | ||
| 12 | 19.33 | 64246 | 118 |
6 Results
On the basis of the measured galaxy velocities for each candidate cluster, we verified in which cases the spectroscopic data confirm the presence of a cluster associated to a NVSS radiogalaxy. As can be noticed from Table 1, for the candidate 349N02 the few available spectroscopic data are not useful for a statistical analysis aimed to assess the presence of a cluster around the radio source.
Among the fields for which we have sufficient data, in two cases (409N03 and 412N23) the radiogalaxy velocity is significantly different from all the other measured values and we conclude that the radiogalaxy is not associated to a cluster. In both cases the data suggest the presence of a group or cluster, but at a redshift different from that of the radiogalaxy.
For the remaining candidates, we confirm the presence of a cluster around the radiogalaxy: this corresponds to a positive detection rate of . For these clusters we determined the mean velocity and velocity dispersion by means of the ROSTAT package (Robust Statistics, Beers et al. Beers (1990)), which allows robust estimates of central location and scale in data samples affected by the presence of “outliers”. When dealing with small data sets () as in our case, the best estimators are the biweight (Tukey Tukey (1958)) for the central location and the classical standard deviation for the scale (Beers et al. Beers (1990)). The estimator is evaluated iteratively, by minimizing a function of the deviations of each observation from the estimate of the central location. It thus requires an additional estimate of this last quantity, which is generally given as the absolute value of the median of the differences between the data and the sample median.
The uncertainties associated to central location and scale have been estimated by the bootstrap method. This technique consists in the generation of a large number of samples, not independent from the original data set, and in the evaluation of the statistical parameters for each of these “bootstrapped” samples.
In Fig. 4 we show the distributions of measured velocities for the cluster candidates involved in this statistical analysis: the shadowed regions represent the data sets used as input for the ROSTAT package.
The results of the statistical analysis are shown in Table 2: mean cluster velocities vary from to , corresponding to the redshift range .
Despite the small number of available redshifts for each cluster, which reflects into rather large errors for both the central location and velocity dispersion, an interesting result arises from the velocity dispersions: they range from to , that is from values typical of poor clusters or groups of galaxies to those typical of moderately rich clusters.

Following the criteria in Abell (Abell58 (1958)), we used the EDSGC catalog to get an estimate of the cluster richness for the confirmed clusters: the background–subtracted galaxy counts in the magnitude range within an Abell radius from the cluster centre range from a minimum of to a maximum of . These galaxy counts are similar to those found for many of the ACO poor clusters (Abell et al. Abell (1989)), and suggest that our radio–optically selected clusters are poorer than Abell richness class . We stress however that these richness estimates must be viewed with caution: first, the values of often fall near or below , where the EDSGC completeness drops significantly, thus seriously biasing the galaxy counts. Second, at our typical the number density of galaxies in the EDSGC is high, about galaxies per square degree, thus the probability of selecting as the third member of the cluster a galaxy which is actually a background or foreground object seen in projection is not negligible, and this again can alter the richness estimate.
As shown in Fig. 5, there is no evident correlation between measured velocity dispersion and cluster redshift. The use of radio emission properties of galaxies seems thus a very efficient method to select new candidate clusters samples in a wide range of richness at any redshift.
| CLUSTER | Right Ascension (B1950) | Declination (B1950) | n | |||||||||
|---|---|---|---|---|---|---|---|---|---|---|---|---|
| 294N15 | 00 23 41.0 | -39 37 15.0 | 6 | 90122 | 906 | |||||||
| 295N35 | 01 03 11.0 | -38 47 15.0 | 4 | 79241 | 429 | |||||||
| 350N71 | 00 35 04.0 | -34 49 15.0 | 5 | 70180 | 373 | |||||||
| 352N47 | 01 14 13.0 | -36 44 45.0 | 4 | 51969 | 444 | |||||||
| 352N63 | 01 19 50.0 | -33 45 15.0 | 6 | 54844 | 674 | |||||||
| 352N75 | 01 21 11.0 | -33 17 15.0 | 5 | 40712 | 263 | |||||||
| 409N15 | 00 02 36.0 | -28 20 15.0 | 5 | 45573 | 210 | |||||||
| 409N44 | 23 51 13.0 | -31 34 15.0 | 5 | 40514 | 757 | |||||||
| 475N50 | 01 15 13.0 | -24 09 45.0 | 10 | 63266 | 847 |
If confirmed by future spectroscopic follow-up, this result could be of great interest as our sample would offer the possibility to investigate differences in cluster dynamical properties in a homogeneously selected sample of clusters which spans a wide range in richness, and to improve our knowledge of their number counts, as well as to study the radio emission properties of galaxies residing in different environments.
7 Conclusions
To study the status and the evolution of clusters of galaxies at intermediate redshifts we built a sample of candidate clusters using radiogalaxies in the NRAO VLA Sky Survey as tracers of dense environments.
From the NVSS maps we extracted a catalogue of radio sources over an area of square degrees, and made optical identifications with galaxies brighter than in the EDSGC Catalogue, resulting in a sample of radiogalaxies (Zanichelli et al. Zanichelli (2001), Paper I).
In this paper we have presented the detection technique we applied to select candidate groups and clusters associated to NVSS radio sources. The method is based on the search of excesses in optical surface galaxy density nearby NVSS radiogalaxies. To keep low the probability of spurious radio-optical identifications, as well as to preferentially select clusters at redshifts , we restricted the cluster search to the radiogalaxies having radio-optical distance and magnitude .
The search of regions having high optical galaxy density has been made using the EDSGC galaxy catalogue, building matrices of galaxy counts down to magnitude . This choice allows to find density excesses surrounding the faintest radiogalaxies (identified down to ) without introducing significant incompleteness effects in the optical data. Smoothing of galaxy counts has been done using a gaussian filter with FWHM. The mode and standard deviation of smoothed galaxy counts have been used to define a detection threshold for the surface density excesses: we selected as cluster candidates those density excesses whose centroid is within from a radiogalaxy. This search radius for candidate clusters associated to NVSS radio sources corresponds to an Abell radius of a cluster at .
By applying this cluster detection strategy to radiogalaxies over sq. degrees at the South Galactic Pole, we obtained a sample of cluster candidates. The estimated contamination level is about .

Out of these candidates, correspond to already known clusters, while cluster candidates in our list do not have any known counterpart in the literature and have been the subject of subsequent spectroscopic follow-up. The full sample of radio-optically selected cluster candidates will be presented in a following paper. Multi Object Spectroscopy aimed to confirm the detection of clusters has been successfully acquired at the 3.6 m ESO telescope for a subset of candidates. In cases the radiogalaxy does not lie at the same redshift as any other observed target, while candidates have been confirmed as clusters of galaxies in the redshift range , thus confirming that this joint radio-optical cluster selection technique can be used as a powerful tool for the detection of cluster candidates at intermediate redshifts. For one additional candidate, the very low number of measured redshifts does not allow any conclusion on the presence of a cluster surrounding the radiogalaxy, and further observations are needed. Velocity dispersions of the spectroscopically confirmed clusters vary from values typical of moderately rich clusters to those typical of groups or poor clusters, thus strengthening the assumption that this technique is equally efficient in selecting structures over a wide range of richness at different redshifts. If confirmed by future spectroscopic follow up, this last result could be of great interest as this technique would offer the possibility to study the properties of different environments, such as groups or rich clusters, in a homogeneously selected cluster sample.
Acknowledgements.
The authors acknowledge Marco Mignoli for his valuable help during the observative run.References
- (1) Abell G.O, 1958, ApJS 3, 211
- (2) Abell G.O, Corwin H.G., Olowin R.P., 1989, ApJS 70, 1
- (3) Allington–Smith J.R., Ellis R.S., Zirbel E.L., Oemler A., 1993, ApJ 404, 521
- (4) Beers T.C., Flynn K., Gebhardt K., 1990, AJ 100, 32
- (5) Burns J.O., Rhee G., Owen F.N., Pinkney J., 1994, ApJ 423, 94
- (6) Butcher H.R., Oemler A., 1984, ApJ 285,426
- (7) Collins C.A., Nichol R.C., Lumsden S.L., 1992, MNRAS 254, 295
- (8) Collins C.A., Guzzo L., Nichol R.C., Lumsden S.L., 1995, MNRAS 274, 1071
- (9) Condon J.J., Cotton W.D., Greisen E.W., et al., 1998, AJ 115, 1693
- (10) Dalton G.B., Efstathiou G., Maddox S.J., Sutherland W.I., 1994, MNRAS 269, 151
- (11) Dalton G.B., Maddox S.J., Sutherland W.I., Efstathiou G., 1997, MNRAS 289, 263
- (12) Feigelson E.D., Maccacaro T., Zamorani G., 1982, ApJ 255, 392
- (13) Frei Z., Gunn J.E., 1994, AJ 108, 147
- (14) Gioia I.M., Henry J.P., Maccacaro T., et al., 1990, ApJ 356, L35
- (15) Grueff G., Vigotti M., 1977, A&A 54, 475
- (16) Henry J.P., Gioia I.M., Maccacaro T., Morris S.L., Stocke J.T., 1992, ApJ 386, 408
- (17) Hill G.J., Lilly S.J., 1991, ApJ 367, 1
- (18) Katgert P., Mazure A., Perea J., et al., 1996, A&A 310, 8
- (19) Katgert P., Mazure A., den Hartog R., et al., 1998, A&AS 129, 399
- (20) Ledlow M.J., Owen F.N., 1996, AJ 112, 9
- (21) Lumsden S.L., Nichol R.C., Collins C.A., Guzzo L., 1992, MNRAS 258, 1
- (22) Nichol R.C., Collins C.A., Lumsden S.L., 2000, submitted to ApJS
- (23) Postman M., Lubin L.M., Gunn J.E., et al., 1996, AJ 111, 615
- (24) Prestage R.M., Peacock J.A., 1988, MNRAS 230, 131
- (25) Ramella M., Zamorani G., Zucca E., et al., 1999, A&A 342, 1
- (26) Rosati P., della Ceca R., Norman C., Giacconi R., 1998, ApJ 492, L21
- (27) Scodeggio M., Olsen L.F., da Costa L., et al., 1999, A&A 137, 83
- (28) Shectman S.A., Landy S.D., Oemler A., et al., 1996, ApJ 470, 172
- (29) Stocke J.T., Morris S.L., Gioia I.M., et al., 1991, ApJS 76, 813
- (30) Struble M.F., Rood H.J., 1999, ApJS 125, 35
- (31) Tukey J.W., 1958, Ann. Math. Stat. 29, 614
- (32) Vettolani G., Zucca E., Zamorani G. et al., 1997, A&A 325, 954
- (33) Vettolani G., Zucca E., Merighi R., et al., 1998, A&AS 130, 323
- (34) Zanichelli A., Vigotti M., Scaramella R., et al., 2001, A&A in press, Paper I
- (35) Zhao J.H., Burns J.O., Owen F.N., 1989, AJ 98, 64
- (36) Zirbel E.L., 1996, ApJ 473, 713
- (37) Zirbel E.L, 1997, ApJ 476, 489