GLOBAL VLBI OBSERVATIONS OF THE HIGH VELOCITY
H I
ABSORPTION TOWARD NGC 1275
Abstract
We present global VLBI observations of the 8100 km s-1 H I absorption feature detected toward the strong radio nucleus 3C 84 of NGC 1275 in the Perseus cluster (5200 km s-1). The observations were obtained using the Very Long Baseline Array (VLBA), the phased Very Large Array (VLA), and three stations of the European VLBI Network (EVN). Our results provide the first high dynamic range image of this feature at high spectral and spatial resolutions. We detect six distinct absorption peaks with optical depths ranging from 0.1 to 0.45, and multiple weak features with 0.1. The compactness of the background radio source 3C 84, which has a linear extent of only about 16 pc, limits the conclusions that can be drawn as to the nature of the intervening object, which must be falling toward the center of the Perseus cluster at 3000 km s-1. However, the detected absorption peaks indicate the existence of several H I clouds with velocity differences and widths similar to those seen in Galactic neutral hydrogen absorption and similar to some of the H I absorption seen in the Large Magellanic Cloud. The most prominent H I clouds extend from 12 to 30 mas (milliarcseconds) on the plane of the sky. The derived H I column densities, assuming K, range over cm-2, and the implied volume densities range between 1.4 and 11 cm-3.
1 INTRODUCTION
NGC 1275 is a giant cD elliptical galaxy located near the center of the Perseus cluster, with a systemic velocity of 5200 km s-1. The galaxy has an active nucleus whose presence is revealed by the powerful compact radio source 3C 84. Lying in front of NGC 1275 is another velocity system at 8200 km s-1. This system is visible in H emission (Caulet et al., 1992) as well as in 21 cm H I absorption (De Young, Roberts, & Saslaw, 1973). The nature of the foreground system is unclear. It may be a late-type Sc or Sd galaxy whose H II regions account for the H emission. However, no nucleus or other systematic morphological structure is apparent (Unger et al., 1990). Also, it is not known if the foreground system is in a chance alignment with NGC 1275 (Rubin et al., 1977, 1978) or if it is strongly interacting with the elliptical galaxy (Unger et al., 1990).
The H I absorption near 8116 km s-1 consists of several relatively narrow components (1.5–5 km s-1), similar in nature to Galactic H I absorption lines. (All velocities in this paper are heliocentric, using the optical convention for redshift.) The presence of such lines offers the opportunity to study spatial structure of the absorbing H I in the high-velocity system. However, radio continuum observations reported by Sijbring (1993) indicate that 76% of the 1395 MHz continuum flux arises in a milliarcsecond-scale core. Therefore, very long baseline interferometry (VLBI) techniques are essential. The first VLBI observations on this feature were performed by Romney (1978), who reported one strong absorption peak at 8114 km s-1 located between two wide absorption shoulders, with some indication of weaker absorption features. Only the strong peak was subject to detailed study, due to the limitations of the three element VLBI array and the equipment then available.
The completion of the Very Long Baseline Array (VLBA) in the early 1990s provided a new opportunity to study this H I absorption system. An early observation of this feature with the ten stations of the VLBA was performed in 1995 as part of a wider project, which also included the Galactic and the low-velocity H I absorption toward 3C 84 (J. E. Conway, J. D. Romney, M. Rupen, & A. J. Beasley, unpublished). Analysis of the high-velocity H I absorption feature by EM and JDR produced interesting preliminary results. The poor quality of the original data, and the limited observing time, led us to propose new observations to study this absorption feature with a more sensitive VLBI array.
In this paper, we report a detailed study of the high-velocity H I absorption feature with a global VLBI array. Our results show the existence of several neutral hydrogen clouds in the intervening object, which is falling toward NGC 1275 at 3000 km s-1. We adopt a distance of 104 Mpc for the Perseus cluster, assuming km s-1 Mpc-1. At this distance 1 mas corresponds to 0.49 pc.
2 OBSERVATIONS AND DATA REDUCTION
The observations were carried out at 1383 MHz on Feb. 19, 2000 using the VLBA111The National Radio Astronomy Observatory is a facility of the National Science Foundation operated under cooperative agreement by Associated Universities, Inc., the VLA as a phased array, and four stations of the European VLBI Network, namely Effelsberg, Jodrell Bank (Lovell), Medicina and the Westerbork phased array. Two different baseband channel widths were observed, wide (8 MHz) and narrow (0.5 MHz), both with right and left-hand circular polarizations. Both bands were centered at the frequency of the neutral hydrogen 21 cm line, at a heliocentric velocity of km s-1, and recorded using 2-bit sampling. The total observing time was 25 hours, with the first 11 hours being observed only by the EVN stations. The wide and the narrow-band data were correlated in separate passes at the VLBA correlator in Socorro, NM with 4 seconds correlator integration time, to produce 16 and 256 spectral channels, respectively. Table 1 summarizes the parameters of these observations.
Along with 3C 84, the radio sources J0303+4716 and J0313+4120 were observed at the same frequencies for calibration purposes. Due to the lower flux densities of these two nearby calibrators compared to 3C 84, which is one of the strongest sources in the radio sky, calibration measurements were also obtained by shifting the narrow-band frequency of 3C 84 occasionally, to an offset frequency 500 kHz (one bandwidth) higher, away from the H I absorption line. Both wide and narrow-band data were reduced and processed using the AIPS (Astronomical Image Processing System) package of NRAO.
Initial examination of the data showed the existence of interference in a wide frequency range at the EVN station Medicina at all times. All data from this station had to be abandoned. After many iterations, we found that amplitude self-calibration was essential in achieving high dynamic range images, and thus we also had to abandon the observations while the remaining three EVN stations were observing alone.
Wide-band channels were included in the observations to provide a high dynamic range continuum image for the background source 3C 84. After applying a priori flagging, and manually excising integrations affected by interference, we performed amplitude calibration using the measurements of the antenna gain and the system temperature () of each station. Bandpass calibration was performed, and the spectral channels were averaged, self-calibrated, and imaged. The resulting continuum image has a dynamic range of 17,000.
The 256 spectral channels of the narrow-band data set were used to study the high-velocity H I absorption feature at high spectral resolution, with a channel separation of 0.43 km s-1 (1.95 kHz). This data set was reduced twice. Each reduction implemented a different amplitude calibration method for the purposes of comparison, and to obtain the best possible results from our observations. In the first reduction, as for the wide band, the amplitude calibration was based on the measured antenna gains and values. In the second reduction, the “template” spectrum method was utilized, obtaining amplitude solutions by fitting a long-term averaged total-power spectrum of a specific antenna to short-term (20 min) intervals on the other stations, and applying the solutions to the cross-power spectra. This method was originally developed for the calibration of VLBI spectral line observations using poorly calibrated antennas. The offset-frequency 3C 84 observations were used to correct the bandpass variations of the cross-power spectra in both data reduction methods. The source J0303+4716 was used for bandpass calibration of the total-power template spectrum.
The results reported in this paper are based on the narrow-band data reduction that utilized the measured antenna gains and values for amplitude calibration. Consistent results were obtained for the template spectrum method, but it also introduced spectrally-dependent image artifacts which could not be corrected by the self-calibration process. The template method may provide superior results, however, when applied on stronger absorption or emission-line features.
The phase and amplitude corrections from the self-calibration of the wide band were applied on the narrow-band data sets. H I data cubes were constructed by subtracting the continuum in the UV-plane using the AIPS task ‘UVLSF’. Optical depth cubes were calculated from the continuum image and the inner 140 channels of each line cube as .
3 RESULTS
3.1 THE CONTINUUM
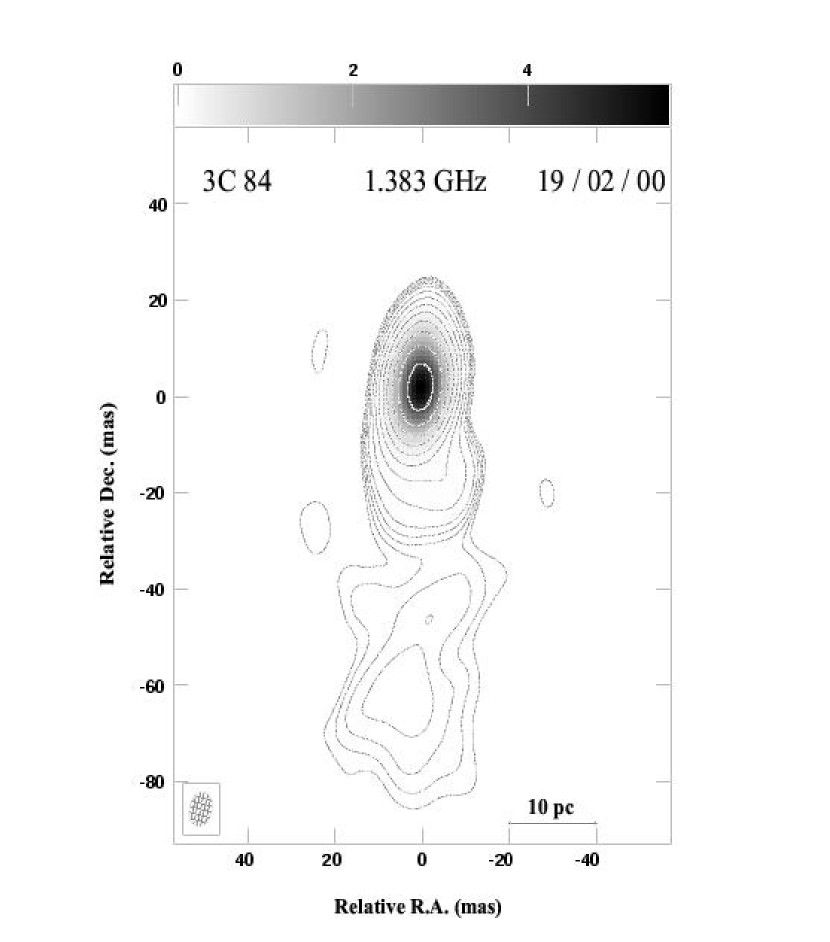
Figure 1 is our continuum image of 3C 84 at 1383 MHz. The image was reconstructed with a grid weighting intermediate between natural and uniform ( in AIPS task ‘IMAGR’).
The source consists of a compact core and a jet extending to the south. An image of 3C 84 convolved to a larger beam size revealed the northern counterjet, which was first discovered at 8.4 GHz (Walker, Romney, & Benson, 1994) and 22 GHz (Vermeulen, Readhead, & Backer, 1994), simultaneously. This northern feature was not detected at 1.7 GHz in a high dynamic range image by Biretta, Bartel, & Dang (1991); however, Silver, Taylor, & Vermeulen (1998) detected it at 1414 MHz. The extent and the flux density of the northern counterjet in our observations are consistent with the results of Silver, Taylor, & Vermeulen (1998).
The total flux density of 3C 84 in our observations is 18 Jy, almost 4 Jy less than the total flux density reported by Taylor & Vermeulen (1996) at 1347 MHz and Silver, Taylor, & Vermeulen (1998) at 1414 MHz. Both these VLBA observations were carried out in 1995. A similar proportional decline in the flux density of this source is reported in the single dish monitoring observations between 1995 and 2000 at higher frequencies (H. D. Aller, M. F. Aller, G. E. Latimer, & P. A. Hughes, in preparation). The decline of the flux density of 3C 84 at the frequencies monitored has been continuous since 1982–1984.
3.2 THE H I ABSORPTION
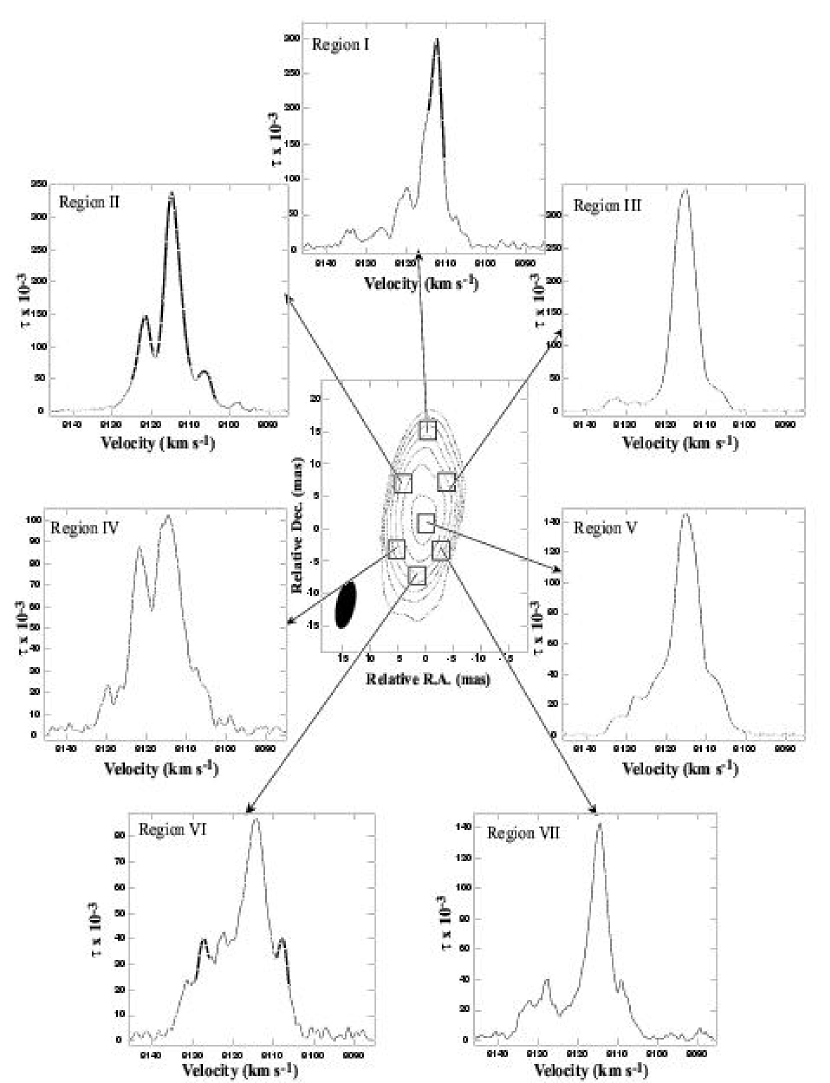
Our study reveals the existence of several H I absorption peaks in the high-velocity system associated with NGC 1275. Figure 2 shows a continuum image of 3C 84 and Hanning smoothed spectra of H I optical depth at various locations against the continuum image. Six main absorption peaks can be distinguished in the spectra of Figure 2, with velocity widths of 1.5–5 km s-1 at half maximum. Weaker H I components are also evident in the velocity range 8128.77–8136.17 km s-1 .
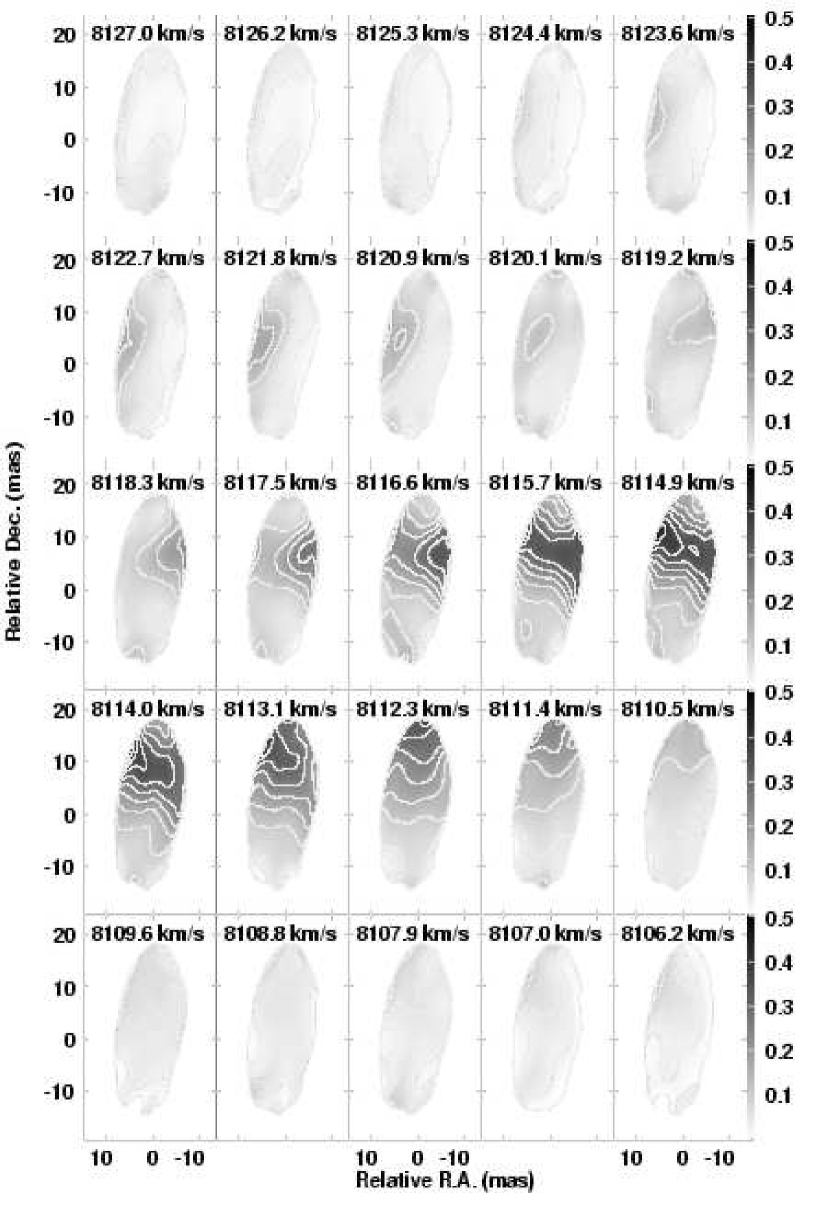
Figure 3 presents optical-depth images covering the velocity range 8127.0–8106.2 km s-1, in every other spectral channel. Because the signal-to-noise ratio in the optical-depth images is poor where the continuum is weak, these images are blanked in areas where the flux density in the background continuum image is below 1.2% of the peak value, i.e., less than 64 mJy beam-1. These images explicitly show the variation of the H I distribution in the small section of the foreground galaxy which is seen against the bright compact background source. The shift in the neutral hydrogen opacity from west to east is apparent in the images that cover the velocity range 8119.2–8113.1 km s-1. This range represents the velocity spanned by the strongest H I peak, which is centered at 8114 km s-1.
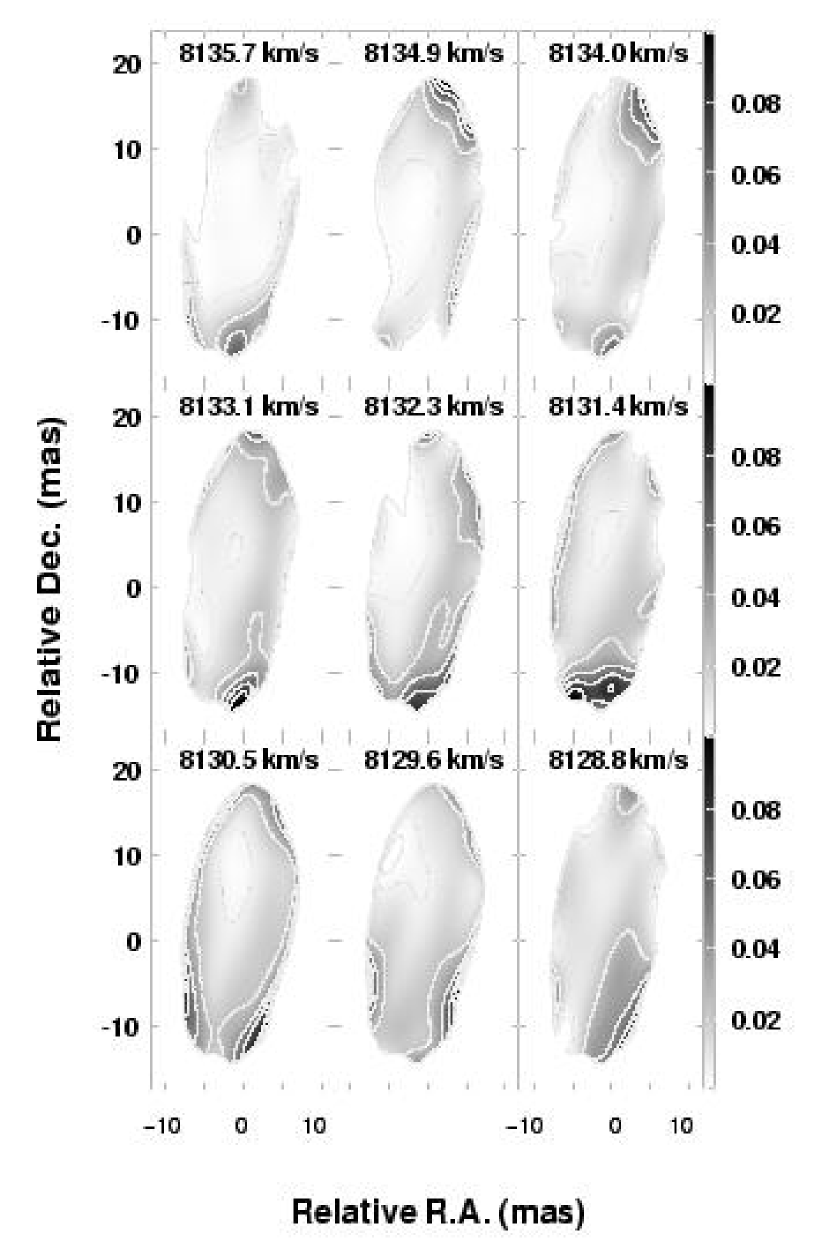
Figure 4 shows optical-depth images similar to Figure 3, but with modified gray-scale and contour levels for the weakest H I components seen in the velocity range 8135.7–8128.8 km s-1 of the spectra in Figure 2. These features are mainly seen against the weakest parts of the background continuum, with little optical depth toward the stronger regions.
Our study shows no evidence for absorption against the southern jet or the weaker northern counterjet of 3C 84, where the flux density is less than 40 and 7 mJy beam-1, respectively.
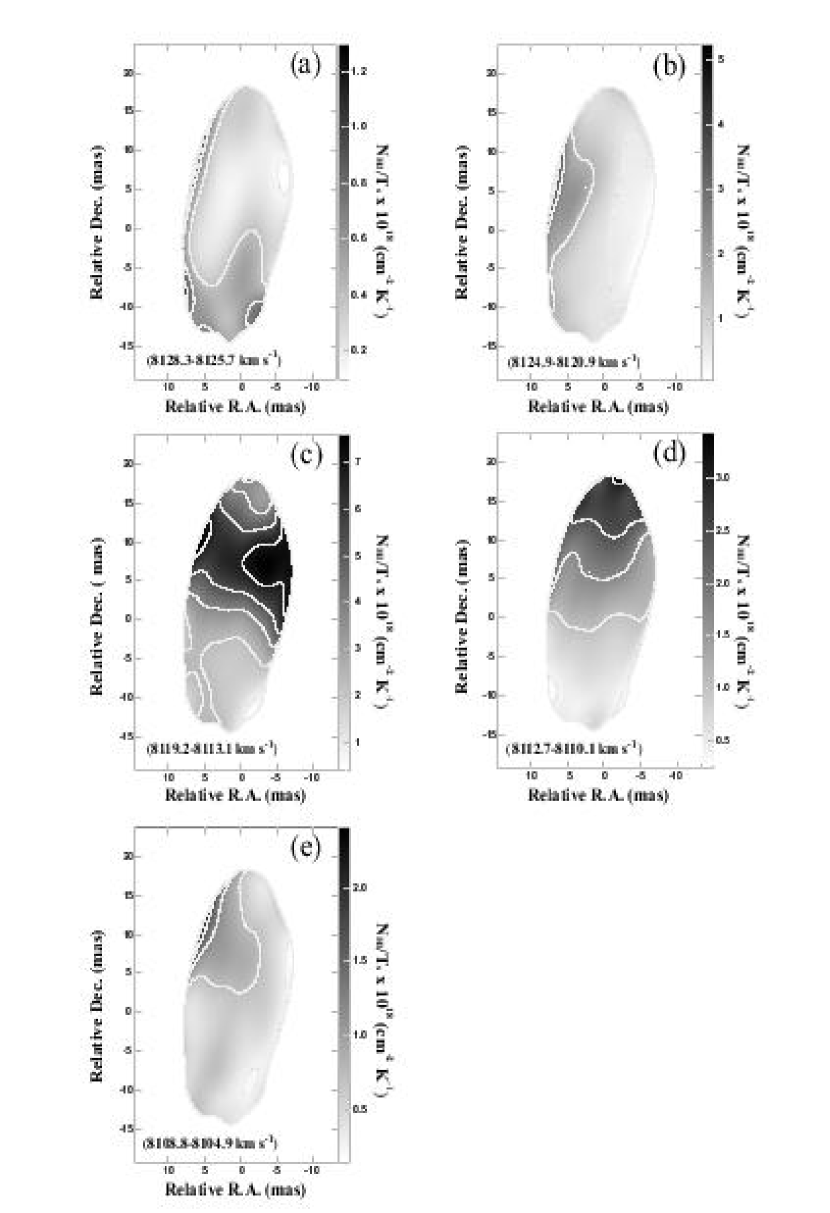
Figures 5a-e show images of , for the velocity ranges 8128.3–8125.7, 8124.9–8120.1, 8119.2–8113.1, 8112.7–8110.1, and 8108.8–8104.9 km s-1, respectively. These ranges of velocity correspond to the six strongest H I absorption features, which are marked with heavy solid lines in the spectra for regions I, II and VI of Figure 2, although they can also be seen in some of the other regions. The images are calculated by integrating over the optical-depth values in each velocity range, as .
The velocity ranges in Figures 5c and 5d are limited so that the effect of the blending between the strongest peaks in regions I and II of Figure 2 is minimized. The velocity range of Figure 5e covers two H I absorption peaks that arise at different locations, one in the east and one in the south (regions II and VI in Figure 2).
Table 2 summarizes the physical characteristics of the six strongest H I absorption features observed against 3C 84. The velocities (Column 1) refer to peaks of these features seen in the optical-depth spectra of Figure 2. The widths of these lines (Column 2) are the approximate full widths at half maximum optical depth. of each peak (Column 5) is obtained from the images in Figure 5. The volume densities (Column 7) are deduced assuming spherically symmetric clouds with diameters equal to their observed transverse linear extents, and K.
4 DISCUSSION
The strong background radio source covers an area of about 7 by 16 pc on the plane of the sky. This area represents a very small section of the high-velocity foreground galaxy, which has an extent of at least 25 kpc (Rubin et al., 1977, 1978; Unger et al., 1990; van den Bergh, 1977). However, even in this very compact region, we were able to identify several H I absorption features.
The nature of the foreground galaxy remains unclear. Rubin et al. (1977, 1978) report an east-west velocity gradient of about 300 km s-1 in the foreground galaxy, suggesting an edge-on rotating spiral with km s-1, which is not necessarily in collision with NGC 1275. However, the observations of Unger et al. (1990) show a velocity gradient in the north-south direction too, by about 100 km s-1, and no evidence for spiral structure or a single well-defined nucleus. This means that the foreground galaxy is either an irregular galaxy, as was suggested by Oort (1976), or a late-type spiral galaxy, disturbed either by its passage through the intergalactic medium in the core of the cluster, or by its collision with NGC 1275 (Unger et al., 1990). The absence of continuum light from a nucleus or a disk (van den Bergh, 1977) makes it difficult to determine the exact nature of this foreground galaxy.
Considering these possibilities for the structure of the intervening galaxy, we can conduct a comparison of our detected H I lines with the H I absorption in the Galaxy, as a well studied spiral, and with H I absorption in the Large Magellanic Cloud (LMC), as the closest and well known irregular galaxy.
For Galactic H I absorption lines detected against various background sources, we consider observations obtained with the Parkes single dish and Parkes two-element interferometer (Radhakrishnan et al., 1972; Goss et al., 1972), and with the VLA and the Arecibo-Los Caños interferometer (Garwood & Dickey, 1989). The velocity widths of the Galactic H I absorption lines range over 1–17 km s-1, the optical depths from 0.11–5.3 and the derived column densities (0.3–34) cm-2. In all three papers, most velocity widths fall in a narrower range, 1–9 km s-1.
In this comparison, we have excluded the VLBA observations of Galactic H I absorption toward background radio sources (Faison et al., 1998; Faison & Goss, 2001), where the linear extent of the H I clouds, between 3 and 100 AU, is much smaller than the extent of the H I structures in our observations.
The H I absorption lines in the LMC were observed with the Australia Telescope Compact Array (ATCA) (Dickey et al., 1994; Marx-Zimmer et al., 2000). Most of the H I absorption lines have velocity widths less than 1 km s-1, and very few exceed 1.2 km s-1. The optical-depth values range between 0.12 and 2.05.
In both galaxies, the Milky Way and the LMC, multi-component H I absorption features are detected against individual background sources. The optical depths measured in our extragalactic H I lines fall in the lower end of the optical depth ranges for both the Galaxy and LMC. While the velocity widths of the Galactic H I absorption features are close to the values seen in our observations, which range between 1.5 and 5 km s-1, the features in the LMC tend to have narrower H I components, with most having widths less than 1 km s-1.
5 CONCLUSIONS
We report the discovery of multiple H I clouds in the high-velocity (8200 km s-1) system associated with NGC 1275 = Perseus A, the dominant member of the Perseus cluster (5200 km s-1).
The background galaxy NGC 1275 is an early-type giant cD elliptical. Its compact core, known as 3C 84, has a total flux density of 18 Jy, and a linear extent of 16 pc on the plane of the sky at 1.38 GHz. Our observations show a decline of 4 Jy in the total flux density of 3C 84 since 1995.
The nature of the foreground object remains uncertain. However, all studies suggest that it is a gas-rich galaxy. The detected H I lines appear to arise in “interstellar” type H I clouds within the foreground galaxy, and lie along our line of sight to the high-brightness source 3C 84.
The superposition of the foreground galaxy, which lacks a strong radio nucleus, with the bright core of NGC 1275, provides an unusual opportunity to probe the properties and physical conditions of extragalactic neutral hydrogen clouds in a late-type galaxy. The results show close similarities between these extragalactic H I clouds, and clouds in both the Galaxy and LMC, detected against various background radio sources.
References
- Biretta, Bartel, & Dang (1991) Biretta, J. A., Bartel, N., Deng, J. 1991, in IAU Colloq. 131, Radio Interferometry: Theory, Techniques, and applications, ed. T. J. Cornwell & R. A. Perley (ASP Conf. ser. 19; San Fransisco:ASP), 334
- Caulet et al. (1992) Caulet, A., Woodgate, B. E., Brown, L.W., Gull, T. R., Hintzen, P., Lowenthal, J. D., Oliversen, R. J., & Ziegler, M. M. (1992), ApJ, 388, 301
- De Young, Roberts, & Saslaw (1973) De Young, D. S., Roberts, M. S., & Saslaw W. C. 1973, ApJ, 185, 809
- Dickey et al. (1994) Dickey, J. M., Mebold, U., Marx, M., Amy, S., Haynes, R. F., & Wilson, W. 1994, A&A, 289, 357
- Faison et al. (1998) Faison, M. D., Goss, W. M., Diamond, P. J., & Taylor G. B. 1998, AJ, 116, 2916
- Faison & Goss (2001) Faison, M. D., & Goss, W. M. 2001, AJ, 121, 2706
- Garwood & Dickey (1989) Garwood, R. W., & Dickey, J. M. 1989, ApJ, 338, 841
- Goss et al. (1972) Goss, W. M., Radhakrishnan, V., Brooks, J. W., & Murray, J. D. 1972, ApJS, 24, 123
- Marx-Zimmer et al. (2000) Marx-Zimmer, M., Herbstmeier, U., Dickey, J. M., Zimmer, F., Staveley-Smith, L., & Mebold, U. 2000, A&A, 354, 787
- Oort (1976) Oort, J. H. 1976, PASP, 88, 591
- Radhakrishnan et al. (1972) Radhakrishnan, V., Goss, W. M., Murray, J. D., & Brooks, J. W. 1972, ApJS, 24, 49
- Romney (1978) Romney, J. D. 1978, Ph.D. thesis, California Institute of Technology
- Rubin et al. (1978) Rubin, V. C., Ford, W. K. Jr., Peterson, C. J., & Lynds, C. R. 1978, ApJS, 37, 235
- Rubin et al. (1977) Rubin, V. C., Ford, W. K. Jr., Peterson, C. J., & Oort, J. H. 1977, ApJ, 211, 693
- Sijbring (1993) Sijbring, D. 1993, Ph.D. thesis, Rijksuniversiteit Groningen
- Silver, Taylor, & Vermeulen (1998) Silver, C. S., Taylor, G. B., & Vermeulen, R. C. 1998, ApJ, 502, 229
- Taylor & Vermeulen (1996) Taylor, G. B., & Vermeulen, R. C. 1996, ApJ, 457, L69
- Unger et al. (1990) Unger, S. W., Taylor, K., Pedlar, A., Ghataure, H. S., Penston, M. V., & Robinson, A. 1990, MNRAS, 242, 33P
- van den Bergh (1977) van den Bergh, S. 1977, Astron. Nachr., 298, 285
- Vermeulen, Readhead, & Backer (1994) Vermeulen, R. C., Readhead, A. C. S., & Backer, D. C. 1994, ApJ, 429, L41
- Walker, Romney, & Benson (1994) Walker, R. C., Romney, J. D., & Benson J. M. 1994, ApJ, 430, L45
6 ACKNOWLEDGMENTS
The authors thank A. P. Sarma and C. L. Brogan for their help in the data reduction. We thank A. J. Kemball for helpful discussions on the template spectrum method in data reduction, and G. B. Taylor for guidance on high dynamic range imaging of 3C 84. We also thank many other members of the scientific staff of NRAO at Socorro, NM for the helpful ideas while reducing these global VLBI observations. The European VLBI Network is a joint facility of European and Chinese radio astronomy institutes funded by their national research councils. This research has made use of data from the University of Michigan Radio Astronomy Observatory which is supported by funds from the University of Michigan. EM is grateful for support from NRAO through the Pre-doctoral Fellowship Program.
| Parameters | Values | ||
|---|---|---|---|
| Observing Date | 2000 Feb. 19 | ||
| R.A. (J2000) | 03 19 48.160 | ||
| Dec. (J2000) | + 41 30 42.105 | ||
| Total observing time (hr) | 25 | ||
| Frequency (MHz) | 1383 | ||
| Continuum data bandwidth (MHz) | 8 | ||
| Continuum image rms (Jy beam-1) | 330 | ||
| Line data bandwidth (MHz) | 0.5 | ||
| Line data velocity coverage (km s-1) | 8058–8169 | ||
| Line velocity resolution (km s-1) | 0.43 | ||
| Line image rms (mJy beam-1) | 1.5 | ||
| Optical depth image cutoff (mJy beam-1)…… | 64 |
Note. — Units of right ascension are hours, minutes, and seconds, and units of declination are degrees, arcminutes, and arcseconds.
| VelocityaaHeliocentric velocity of the H I absorption feature at . | bbFull width at half optical depth. | Linear Size | ccBased on . | ddAssumes spherically symmetric clouds and . | ||||
|---|---|---|---|---|---|---|---|---|
| (km s-1) | (km s-1) | (pc) | (cm-2 K-1) | (cm-2) | (cm-3) | |||
| (1) | (2) | (3) | (4) | (5) | (6) | (7) | ||
| 8126.2 | 1.5 | 0.14 | 15 | 1.3 | 6.5 | 1.4 | ||
| 8121.8 | 3.5 | 0.30 | 13 | 5.2 | 2.6 | 6.5 | ||
| 8114.0 | 5.0 | 0.45 | 10 | 7.6 | 3.8 | 11.2 | ||
| 8112.2 | 3.5 | 0.38 | 9 | 3.4 | 1.7 | 6.1 | ||
| 8108.3 | 1.5 | 0.10 | 5 | 0.7 | 3.5 | 2.3 | ||
| 8106.6 | 3.5 | 0.15 | 6 | 2.4 | 1.2 | 6.5 |