New X-ray Clusters in the Einstein Extended Medium Sensitivity Survey II: Optical Properties
Abstract
We present optical images for 9 new clusters of galaxies we have found in a reanalysis of the Einstein IPC images comprising the Extended Medium Sensitivity Survey (EMSS). Based on the presence of a red sequence of galaxies in a color-magnitude (CM) diagram, a redshift is estimated for each cluster. Galaxy overdensities (cluster richnesses) are measured in each field using the Bgc statistic which allows their plausible identification with the X-ray emission. The nature of our X-ray detection algorithm suggests that most of these clusters have low X-ray surface brightness (LSB) compared to the previously known EMSS clusters. We compare the optical and X-ray observations of these clusters with the well-studied Canadian Network for Observational Cosmology (CNOC) subsample of the EMSS, and conclude that the new clusters exhibit a similar range of optical richnesses, X-ray luminosities, and, somewhat surprisingly, galaxy populations as the predominantly rich, relaxed EMSS/CNOC clusters.
Received 2001 June 1; accepted 2001 October 4 \journalinfoThe Astrophysical Journal
1 Introduction
X-ray selected samples of clusters of galaxies are one of the most effective tools used to constrain cosmological models, complementing studies of the cosmic microwave background, and Type 1a suernovae (Bahcall et al., 1999). The cluster X-ray luminosity function is the most accessible observable obtained from a large, flux-limited, X-ray cluster catalog (e.g., Vikhlinin et al., 1998; Nichol et al., 1999; Reichart et al., 1999; Gioia et al., 2001), and several techniques have been used to constrain cosmological parameters such as , and (e.g., Donahue & Voit, 1999; Bahcall & Fan, 1998; Henry, 2000; Voit, 2000). The Einstein Extended Medium Sensitivity Survey (EMSS) sample of X-ray clusters is of special cosmological interest due its very large sky coverage and moderate depth and sensitivity, which allow it to probe the very bright end of the X-ray luminosity function (XLF), at ergs s-1 ( keV), with detections of clusters at , where the leverage for constraining a given cosmology is greater (Donahue et al., 1998; Donahue & Voit, 1999; Reichart et al., 1999; Gioia et al., 2001).
X-ray-selected samples of clusters have been preferred to optically-selected samples due to the significantly lower confusion and projection effects in the former method (see Gladders & Yee 2000 and Donahue et al. 2001 for excellent discussions of optical vs. X-ray cluster selection) and because X-ray selection provides a simple sample definition using flux limits. However, in the first paper in this series Lewis et al. (2001, Paper 1 hereafter), we have shown that the original EMSS sample exhibited a modest selection bias against very extended sources, and is complete at the level because it is actually surface brightness limited, not flux-limited. We have described our re-analysis of the IPC imaging data from which the EMSS sample was drawn in Paper 1. In a combined effort of database and literature searches, as well as optical imaging, at least 17 clusters were found to be missing from the EMSS, with an additional 8 clusters statistically predicted to be found in a complete optical search. All of the new clusters are expected to be of a more diffuse nature, i.e., although they had sufficient total flux to be included in the EMSS, their X-ray emission was not centrally concentrated enough to be detected by the original EMSS detection algorithm. Only through the use of larger detection apertures do these new clusters obtain S/N . The addition of these new clusters has reduced the previously reported “negative” evolution at high redshift () and high luminosity ( ergs s-1) in the XLF to only (Paper 1). Within the EMSS, these objects therefore represent an important class of new clusters, which are possibly low X-ray surface brightness (LSB) clusters.
The existence of LSB clusters could have an important impact on our understanding of cluster properties. The original EMSS cluster sample is apparently dominated by virialized, rich systems with well defined correlations (e.g., Mushotzky & Scharf, 1997; Lewis et al., 1999). Such clusters are more regular and more massive than optically selected clusters such as those found by other groups (e.g., MORPHS, Dressler et al. 1999; Smail et al. 1997; PDCS, Postman et al. 1996; Zaritsky et al. 1997). The EMSS preferentially selected clusters with a high central surface brightness, which results in the exclusion of some systems that may be in a disturbed or unrelaxed dynamical state. If LSB clusters have been preferentially missed by X-ray surveys, we may not have observed the full range of properties in X-ray luminous clusters. For example, a low X-ray surface brightness likely indicates a non-centrally concentrated gravitational potential for the cluster, which could be the result of a merger in progress, or an otherwise disturbed or non-virialized system resulting in a lower intra-cluster medium (ICM) density, lower temperature and thus lower X-ray luminosity compared to more relaxed systems which define the relationship (Mushotzky & Scharf, 1997). Such clusters would exhibit a wider range of , , and values at the same masses, providing additional clues to the formation and evolution of clusters of galaxies. All current X-ray surveys are surface-brightness limited at some level (even those surveys designed to detect X-ray extent; see Adami et al., 2000), and we must understand their selection functions to properly interpret cosmological constraints derived therein. We therefore present the new clusters we have found missing from the EMSS as potential LSB clusters, and interesting objects for optical and X-ray study and comparison with already known X-ray clusters.
In Paper 1, we introduced the X-ray detection algorithm and source catalog, and described the effect the discovery of additional clusters in the EMSS sample had on the cluster X-ray luminosity function. In this paper we present the detailed results of our optical imaging campaign, which resulted in the identification of nine of the 17 new clusters of galaxies. In §2 we present the new clusters, describe the methodology used to identify clusters of galaxies in the sample, and estimate their redshift and X-ray luminosity. In §3 we discuss the cluster properties, comparing them with other well-studied clusters. We present a summary in §4. We have assumed H km s-1 Mpc-1, , and in our calculations, but our conclusions are not unique to these choices.
2 The Optical Imaging Campaign
The new clusters presented in this paper are the optical counterparts to very extended X-ray sources in our catalog. The creation and investigation of the catalog of new IPC detections are described in detail in Paper 1. In that work, we describe literature and database searches which reveal previous identifications for some of the 772 catalog sources at various wavelengths; however, the vast majority of fields had no definitive identification beyond not being clusters of galaxies. To search for clusters among the unidentified sources, we created 3 subsamples (one random, and two designed specifically to pre-select clusters; see Paper 1 for details of the X-ray selection criteria) for which we obtained deep multi-color images of 62 fields at the KPNO 2.1m telescope. In this section we discuss the clusters of galaxies we have discovered thus far.
Our campaign was designed to detect any grouping of elliptical galaxies following a linear sequence in color and magnitude, defined as the cluster red sequence (CRS), taken to be the optimum signature of a cluster of galaxies in the optical. This method is very similar to that described in detail by Gladders & Yee (2000). Using the T1KA and T2KA direct imaging cameras at the 2.1m telescope, we initially imaged each field in Gunn or Kron-Cousins to identify any galaxy over-density. The field of view was and for the T1KA and T2KA chips, respectively. Both cameras obtain a pixel scale of . We encountered a wide range of seeing from . In order to detect distant clusters to redshifts similar to the highest redshift EMSS clusters (), we required limiting magnitudes in or (which corresponds to M∗+2 at ). Thus each field was observed for approximately 1800 seconds in or . While examining the red image for galaxies, each field was observed for 600 seconds in Johnson to detect any bright blue objects which might be QSOs contributing to the X-ray emission. If there was a galaxy overdensity present, we further imaged the field in Gunn or Johnson , and/or in Gunn or Kron-Cousins . Typical limiting magnitudes (the magnitude at which a star would be detected at S/N ) of and were obtained. Photometric standard stars were observed 3–5 times per night in each filter, at a range of airmasses, resulting in a photometric accuracy of mag.
The imaging campaign was conducted over three semesters, in December 1997 (T1KA, 4 nights, poor weather), December 1998 (T1KA, 6 nights, good weather), and May 2000 (T2KA, 6 nights, good weather). We imaged a total of 27 randomly selected sources, and 35 pre-selected sources (see Paper 1, Tables 6, 8, & 10 for the complete list of observed sources). Table 1 lists details of the observations of the nine clusters we identified in our observations. It lists by column: (1) catalog number of the source; (2) & (3) right ascension and declination of the source, epoch J2000; (3) filter; (4) exposure time in seconds; (5) the 5- magnitude limit reached in the observation; (6) date of the observation; (7) comments on the observation. The full source catalog is available from the first author upon request.
2.1 Data Reduction and Analysis
After standard image reduction with IRAF, the identification and classification of all objects in each field and the calculation of an instrumental magnitude for each object were performed using the Picture Processing Package (PPP) software developed by Yee (1991). This photometry package produces galaxy “total” magnitudes (see Yee 1991 for justification), corrected for overlapping with neighboring objects, which simulations have found to be accurate to within 2–3% systematic error. Random uncertainties for individual galaxies near the completeness limit are 0.05-0.1 mag. The completeness limit is the magnitude limit above which we expect to detect of the high surface brightness galaxies present in the field; it is approximately mag fainter than the point source limiting magnitude (see Yee, 1991). We do detect lower surface brightness galaxies as faint as -band mag arcsec-2, but we do not expect to be complete for such objects. Star-galaxy separation was performed using an analysis of object radial profiles. Bright, non-saturated stars were used to measure the PSF, and subsequently all objects in the field detected at S/N were classified by extent as stars or galaxies. After a correction for Galactic extinction assuming , scaling to the neutral hydrogen column given by W3nH111Neutral hydrogen data is from Dickey & Lockman (1990). W3nH is a Web version of the nH FTOOL. nH was developed by Lorella Angelini at the HEASARC. It is a service of the Laboratory for High Energy Astrophysics (LHEA) at NASA/GSFC and the High Energy Astrophysics Division of the Smithsonian Astrophysical Observatory (SAO). , photometric calibration from the standard stars was used to calculate apparent magnitudes and colors, and we then used a color-magnitude (CM) diagram to detect a CRS. A CRS approximately following the slope and zeropoint of empirical galaxy color models (Kodama & Arimoto, 1997; Kodama et al., 1998), provides a redshift estimate accurate to (Gladders & Yee, 2000). We then calculated the apparent over-density of galaxies relative to the field at that redshift using the Bgc statistic. Employing alternative cosmologies (e.g., the currently favored H km s-1 Mpc-1, , and cosmology) does not change our photometric redshift estimates by more than .
The galaxy-cluster spatial covariance function (Longair & Seldner, 1979), quantified by the Bgc parameter, is described in detail in Yee & López-Cruz (1999). Briefly, it is a quantification of the richness of the clustering environment around a given object. Given a cosmological model, an assumed galaxy luminosity function and its evolution, and measured mean background galaxy counts, this parameter reflects the galaxy overdensity around a given object, correcting for the expected spatial and luminosity distributions of field galaxies and of the associated cluster galaxies at the redshift of the object. All galaxies within 500 kpc of a central object (generally the brightest cluster galaxy (BCG) identified from the CM diagram) brighter than a specific magnitude are counted. Then the expected number of background galaxies in that area down to the same magnitude is subtracted. The number of excess galaxies is normalized to an evolved galaxy luminosity function at the redshift of the object and then converted to Bgc assuming a form for the spatial distribution of galaxies.
The specific magnitude limit for galaxy counting is determined for each field individually and is taken to be the brighter of the completeness magnitude or M + 2.5. Background galaxy counts are those of Yee, Green, & Stockman (1986) and Yee et al. (1996). The evolving galaxy luminosity function used to normalize the excess galaxies is that of Ellingson et al. (1991), which includes moderate galaxy evolution of M∗() (see also Lin et al., 1999). Finally, the distribution of the excess galaxies is assumed to be the standard cluster galaxy power law, where (Seldner & Peebles, 1978). The total uncertainty in Bgc is given by BB (Yee & López-Cruz, 1999) where is the expected number of background galaxy counts and is the number of excess galaxy counts. The factor of 1.3 is an empirical value that accounts for the clustering of the background galaxies, which causes the error in the background galaxy counts to deviate from a Poisson error. This factor is discussed in detail in Yee et al. (1986). For those more familiar with the cluster richness classification of Abell (1958): Bgc values of 600 200, 1000 200, 1400 200, 1800 200, 2200 200, and Mpc1.77 are comparable to Abell richness classes (ARC) 0, 1, 2, 3, 4, and 5 respectively (Yee & López-Cruz, 1999).
Our overall strategy for identifying clusters is similar to that described by Gladders & Yee (2000). Our criteria for a cluster candidate was the detection of a CRS, combined with at least a modest spatial concentration of the red galaxies. The Bgc value was then calculated at the redshift of the CRS and the location of the BCG for the candidate cluster. To identify a field as a cluster of galaxies, we required an identifiable CRS combined with a Bgc value Mpc1.77, and consistency with the available X-ray data. The range of Bgc values quoted in this paper for a given cluster are found by calculating Bgc at the highest and lowest redshifts estimated for the CRS in the CM diagram. The Bgc value can be used to estimate an expected X-ray luminosity (and hence, expected flux) via the observed correlation with (Yee & Ellingson, 2001), which we compare to our observed X-ray fluxes in the four Einstein IPC apertures used to generate the catalog. The IPC apertures are circular, with diameters 2.5, 4.7, 8.4, & 12.2′; we refer to them as apertures 1, 2, 3, & 4, respectively (see Paper 1, as well as the individual discussion of sources below). We caution, however, that there is significant scatter in the B relation (Yee & Ellingson, 2001), so that the values estimated by this process are indicative, not definitive. Unless otherwise stated, all X-ray fluxes are in the keV energy band, unabsorbed, (corrected for absorption assuming Galactic neutral hydrogen column density nH given by W3nH). Luminosities are K-corrected assuming a power-law spectrum with photon index (, following Henry et al. 1992; consistent with a cluster spectrum in this bandpass) and quoted in the keV energy band in the rest frame of the cluster.
2.2 New Clusters in the EMSS
In Table 2, we present a summary of the X-ray and optical properties of the nine clusters we have discovered optically, which includes by column: (1) catalog source number; (2) estimated redshift range from photometry; (3) measured galaxy over-density, Bgc in ( Mpc)1.77; (4) log of the X-ray luminosity in ergs s-1 in the keV IPC bandpass calculated from the third IPC aperture flux222 We have calculated the X-ray luminosity in our given cosmology to more easily compare to previously published work on EMSS clusters.; (5) the blue galaxy fraction (see § 3); (6) ratio of detected X-ray flux in IPC aperture 3 to aperture 1, indicating extent (see § 3); (7) notes on the nature or identification for the cluster. For columns (2), (3), and (4), the best-fit value from the range is given in square brackets following the range. In this section we discuss details of the individual clusters. The other 8 new clusters in our X-ray catalog were found by other groups conducting X-ray cluster surveys (see Paper 1).
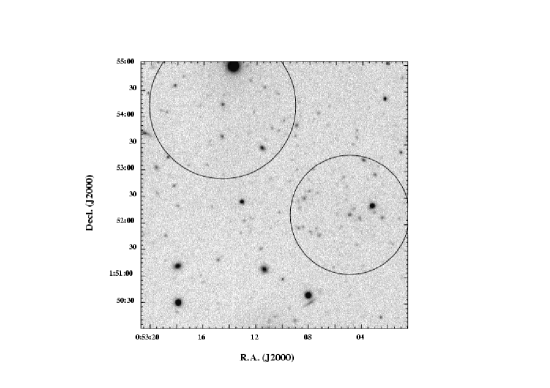
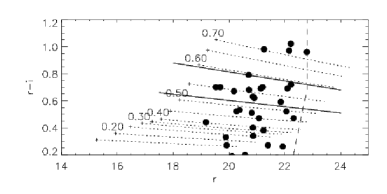
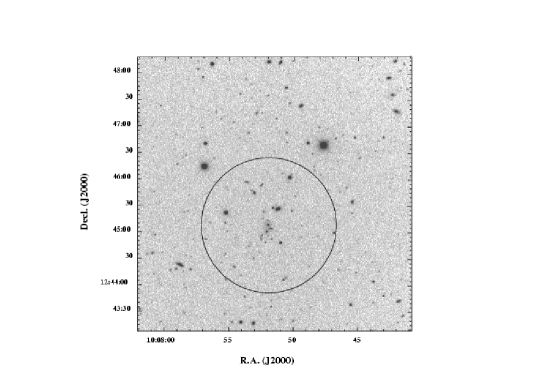
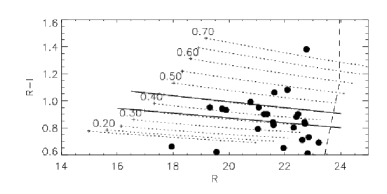
Source #161: In Fig. 1 we present the optical Gunn image of source #161 (top panel), and the vs. CM diagram (bottom panel) for galaxies detected in the field of source #161 within a radius of 500 kpc. This radius is shown in the top panel of Fig. 1 by the smaller solid circle, centered on the probable BCG. This source exhibits a high overdensity of galaxies across the field; however there appears to be more than one physical structure based on galaxy color and projected density. The second structure is indicated in Fig. 1 by the larger solid circle (also of radius 500 kpc at the lower redshift of this structure; see below). Accordingly, our over-density estimates have been corrected (to lower values) in an attempt to avoid contributions from galaxies at different redshifts. We have segregated galaxies by color to assign them to each of the two concentrations, and corrected our over-density estimates by the fraction of galaxies in each structure. We estimate that the most dominant CRS lies within the redshift range . In order to segregate possibly contaminating galaxies, we set a color limit of for this structure. Galaxies bluer than this limit were excluded from the counts used for the calculation of Bgc. At a redshift of , the new number of net galaxies lowers the measured Bgc value from 2790 ( Mpc)1.77, to ( Mpc)1.77, which indicates a cluster consistent with ARC 1–2. The estimated X-ray flux from a cluster with this overdensity (see Table 2) is higher than the actual IPC aperture fluxes observed so that this cluster is easily rich enough to produce the observed X-ray emission. The next richest CRS in the field lies in the redshift range . At a redshift of , we measure a corrected galaxy over-density of B ( Mpc)1.77, corresponding to 38% of the flux expected from the more distant cluster. Thus, the more distant structure dominates the expected X-ray flux. However, the apparent high redshift cluster is also arcsec from our X-ray centroid, which suggests additional sources or extended emission could contribute to the X-ray detection (see Paper 1). This cluster is somewhat irregular in appearance, with only mild central concentration around the probable BCG and only a modest CRS. Due to the difference in position of the apparent cluster and the X-ray centroid, the possibility of contamination by a second cluster or an AGN, and the complex nature of our galaxy segregation and over-density calculations, we identify source #161 as only a possible cluster of galaxies at . We emphasize that this source presents a complex situation, and our conservative possible identification reduces the impact this cluster has on the EMSS sample (Paper 1).
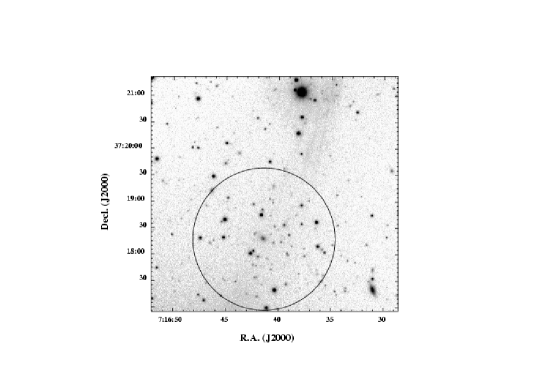
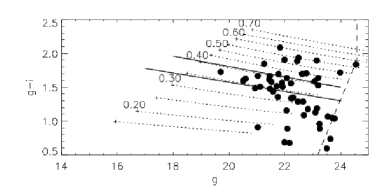
Source #1310: In Fig. 2 we present the Gunn image of source #1310 (top panel), and the vs. CM diagram (bottom panel) for galaxies detected in the field of source #1310 within a radius of 500 kpc, shown by a solid circle centered on the BCG. The CM diagram for this field indicates a CRS with estimated redshift of . At , we measure B ( Mpc)1.77 (equivalent to ARC 1–2). The X-ray flux measured with the IPC is consistent with a cluster of this richness and redshift. This cluster has a moderate central concentration, with a clear BCG near the field center.
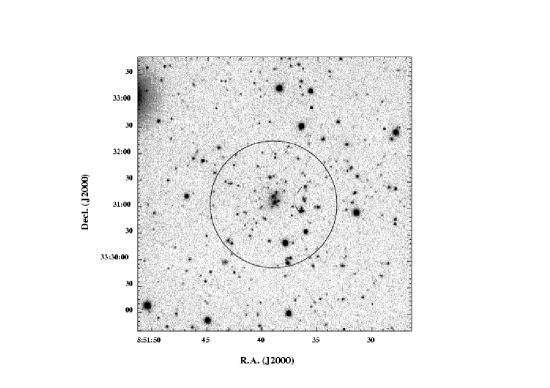
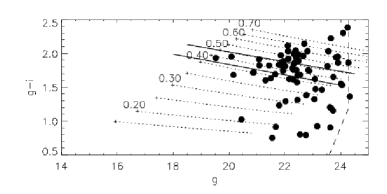
Source #1492: In Fig. 3 we present the Gunn image of source #1492 (top panel), and the vs. CM diagram (bottom panel) for galaxies detected in the field of source #1492 within a radius of 500 kpc, shown by a solid circle centered on the southern galaxy in the pair of BCGs. This cluster has a dense core and large overdensity of galaxies. Note the faint blue arc to the west of the BCGs, whose color is mags bluer than the BCGs. The blue arc is clear evidence for a deep gravitational potential well, consistent with this source being a rich cluster of galaxies. From the CRS, we estimate a redshift of for this cluster. At , we measure B ( Mpc)1.77 (equivalent to ARC 4), the highest galaxy richness in our sample.
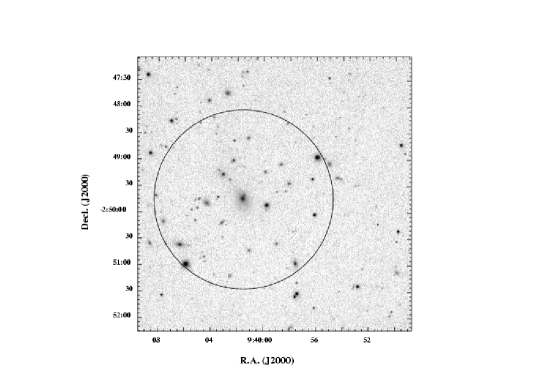
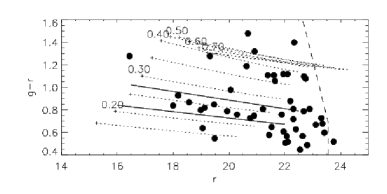
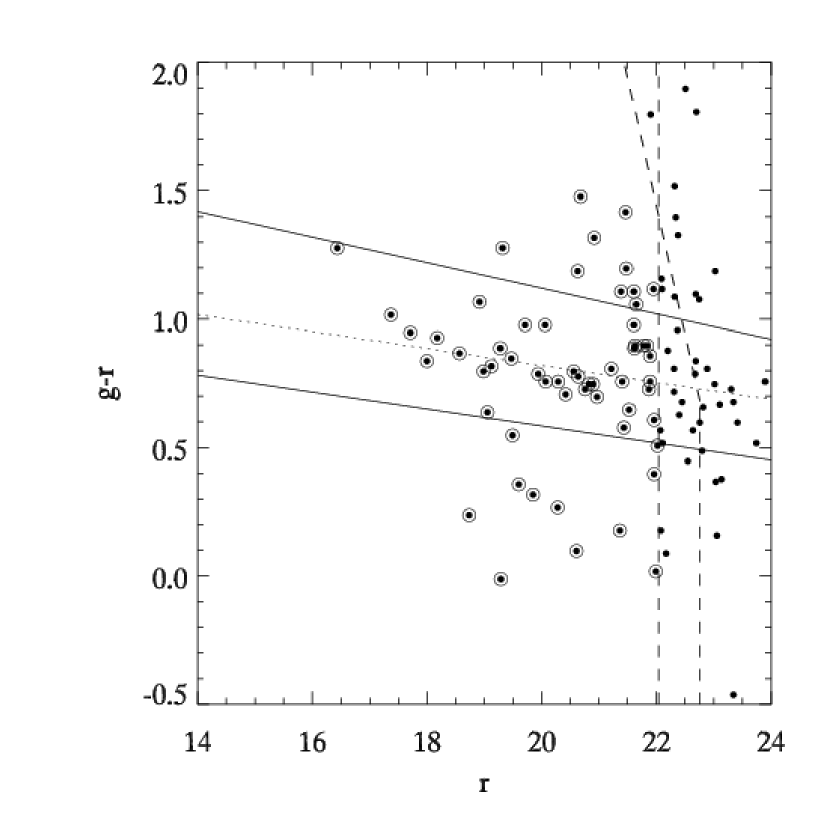
Source #1605: In Fig. 4 we present the Gunn image of source #1605 (top panel), and the vs. CM diagram (bottom panel) for galaxies detected in the field of source #1605 within a radius of 500 kpc, shown by a solid circle centered on the BCG. This cluster has an estimated redshift of . At a redshift of , we measure B ( Mpc)1.77 (ARC 0–1). The inferred from the IPC flux is significantly lower than expected from a cluster of this richness. The galaxies in this cluster are distributed widely (across in diameter), and it has a dominant cD-type galaxy with an extended stellar envelope. The BCG has a star projected onto it which affects both its magnitude and color in the CM diagram.
Source #1681: In Fig. 5 we present the Kron-Cousins image of source #1681 (top panel), and the vs. CM diagram for galaxies detected in the field of source #1681 within a radius of 500 kpc, shown in the top panel by a solid circle centered on the BCG. This cluster has an estimated redshift of . At a redshift of , we measure B ( Mpc)1.77(ARC ). The flux from the IPC for this source is consistent with this cluster being the sole source of the X-rays in the field. The optical appearance is of a compact core which is confirmed by the CM diagram. There are also a large number of galaxies falling along the red sequence but distributed much farther from the core, in a shallow extended envelope.
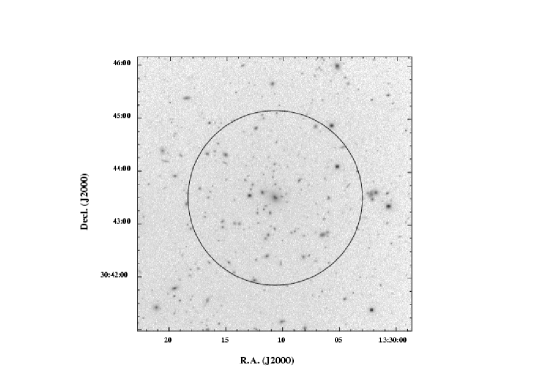
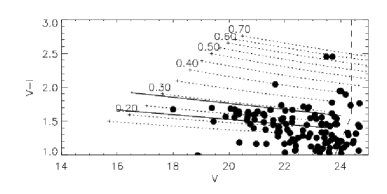
Source # 2436: In Fig. 6 we present the Kron-Cousins image of source #2436 (top panel), and the vs. CM diagram (bottom panel) for galaxies detected in the field of source #2436 within a radius of 500 kpc, shown in the top panel by a solid circle centered on the BCG. This source is coincident with a Gunn, Hoessel, & Oke (1986) cluster with an unknown redshift. Our imaging easily detects this cluster and the CM diagram indicates a CRS of redshift . At , we measure B ( Mpc)1.77(ARC 2). There is a second, weaker, CRS present in the CM diagram, centered NE of the X-ray centroid, at a similar, but slightly higher redshift of , and an overdensity of B ( Mpc)1.77. At this location and richness, it can only contribute to the 3rd or 4th IPC apertures, and even then is likely to be only a small fraction of the flux compared to the primary cluster. For this source, the smallest IPC aperture data alone is a 4.5 detection (see Paper 1), which is due solely to the cluster, and we identify this source as a rich cluster of galaxies. Based on the galaxy colors of the two structures, which differ by 0.4 mag in , it is unlikely that they are physically related.
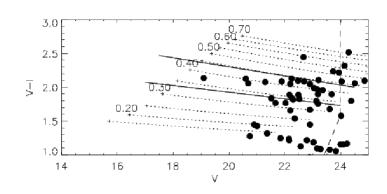
Source #2844: In Fig. 7 we present the Kron-Cousins image of source #2844 (top panel), and the vs. CM diagram (bottom panel) for galaxies detected in the field of source #2844 within a radius of 500 kpc, shown in the top panel by a solid circle centered on the BCG. This field may contain a cluster of galaxies, but our photometry for it is not self-consistent: the and data give discrepant estimates of the color of the apparent CRS at the mag level. We experienced a wide variation in seeing during these observations, which proved to be problematic for the subsequent color measurements. Our best estimate (using the optimum constraint provided by the data) is a CRS at redshift . At , we measure B ( Mpc)1.77(ARC 0–1). The expected X-ray flux is somewhat larger than the IPC aperture fluxes, indicating this cluster is easily responsible for our X-ray detection. The optical image reveals a dominant central galaxy, but otherwise very little central concentration. The CM diagram indicates a CRS, though the galaxies within it are somewhat widely spatially distributed. Due to the inconsistencies in our photometry, we identify this field as only a possible cluster of galaxies.
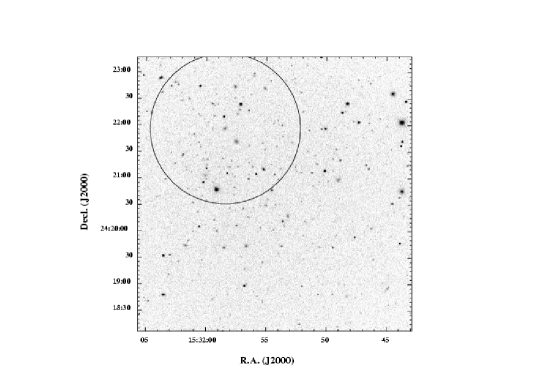
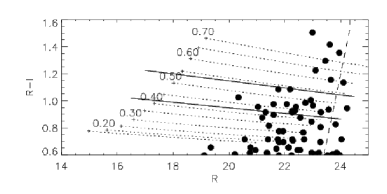
Source #2906: In Fig. 8 we present the Kron-Cousins image of source #2906 (top panel), and the vs. CM diagram (bottom panel) for galaxies detected in the field of source #2906 within a radius of 500 kpc, shown in the top panel by a solid circle centered on the BCG. This field presents a significant galaxy overdensity, and an apparent CRS in the CM, but the BCG is 2′ NE of the X-ray centroid, and there is a lack of concentration of galaxies around it. Additional scrutiny of the galaxy colors implies possible contamination from galaxies at a variety of redshifts, though there is no second CRS present (as in the case of #161). We estimate the primary CRS to be at a redshift of . At , we measure B ( Mpc)1.77(ARC 1). Due to the offset of the BCG from the X-ray centroid, and the possibility of contamination, we identify this source as only a possible cluster of galaxies. In addition, this cluster has the highest blue fraction of galaxies (defined below) in our sample, indicating either that this source is optically contaminated (and thus not as rich as the Bgc value indicates) or that it contains many late-type cluster galaxies, due to an unevolved dynamical state, indicative of a cluster still in formation.
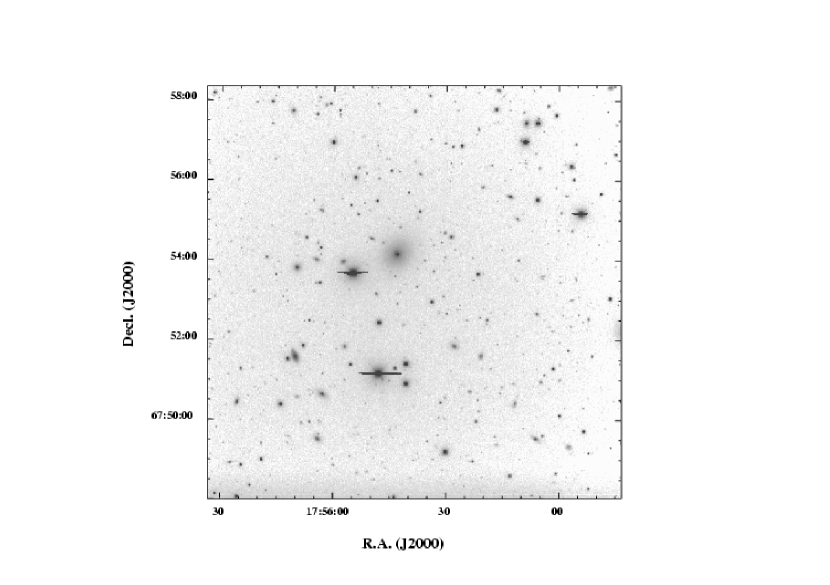
Source #3353: In Fig. 9 we present the Kron-Cousins image of source #3353. This field contains an obvious low-redshift () group or poor cluster of galaxies extending well across our field. Because our redshift estimates are not at all accurate below we have not tried to measure the redshift or galaxy overdensity of this group. The measured IPC flux in the largest aperture indicates a maximum luminosity of L ergs s-1 for ; given the magnitude of these galaxies a redshift much less than 0.1 is suggested, so that an typical of an elliptical-rich galaxy group is implied (Mulchaey & Zabludoff, 1998). There is a very large, dominant elliptical galaxy near the field center, with many smaller elliptical and S0 galaxies evident across the entire field. It is very likely to be the source of extended X-rays in this field, and therefore we identify it as a nearby group or poor cluster.
3 Discussion
We have found several bona-fide clusters of galaxies within the EMSS sky area that have gone previously undetected. As shown in Paper 1, these clusters have significantly extended X-ray emission (see Figure 3, Paper 1), but are they truly low surface brightness (LSB) clusters? The modest spatial resolution of the IPC instrument, and the low S/N of these detections does not allow us to make precise surface brightness profiles to answer this question conclusively, but we analyze the data from the four X-ray apertures in an attempt to address the issue. It is possible that these clusters are similar to other EMSS clusters, and were only missed by the original EMSS because that sample selected against asymmetric objects (e.g., Ebeling et al. 2000 discuss #420, one of the clusters also rediscovered in this work; see Paper 1) near the flux limit of any given observation, where most of these clusters are detected. Alternatively, they may represent a new class of clusters which lack any central X-ray concentration although they are massive. If these clusters are in a different dynamical state from relaxed systems, they may exhibit the following observational properties: low X-ray luminosity relative to their mass or richness, or a large fraction of blue, presumably spiral, star-forming galaxies. Either observation could be interpreted as evidence for clusters in the process of formation, which could significantly affect cosmological studies of galaxy clusters. In this section we will scrutinize the available optical and X-ray data for the sample as a preliminary investigation of their global properties.
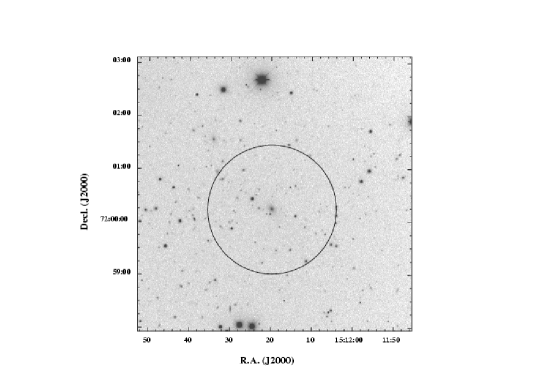
Although the available IPC data is of low S/N, we can use our multiple aperture detections to make a simple surface brightness analysis. We take the ratio of X-ray flux in the third to the first IPC apertures (8.4 and 2.5 arcmin in diameter, see Paper 1), for the new clusters and compare it with the same measurements made for the EMSS/CNOC clusters (Canadian Network for Observational Cosmology, Yee et al., 1996) detected by our algorithm. The EMSS/CNOC clusters are a subset of the EMSS cluster sample, which are primarily rich, relaxed, clusters with high X-ray luminosity (excepting MS and MS , which have complex X-ray and galaxy velocity structures; Morris et al., 1998; Lewis et al., 1999). In Figure 10 we present the ratio of third to first IPC aperture flux vs. redshift for the new, optically discovered EMSS clusters (filled circles) and the EMSS/CNOC clusters333 We note that 3 of the 16 EMSS/CNOC clusters were not detected by our IPC reanalysis because they lay outside the central region of the IPC detector (see Paper 1). Two of these clusters were detected by the IPC as extended objects, and we have used the ratio of the EMSS “Extended Counts” (see Gioia et al. 1990, Table 3, Column 9) to the EMSS detect cell counts as an approximation to the aperture ratios (open triangles in Figure 10). Comparing the two methods for the other CNOC clusters seen as extended by the IPC shows consistency with our aperture ratios to within . (open circles and open triangles), while filled triangles represent additional new clusters in the EMSS found outside our optical imaging campaign (e.g., clusters found by other groups; see Paper 1). The dotted curve represents the expected flux ratio for a cluster whose X-ray emission is characterized by a standard -model with and kpc. We can see that many of the new clusters (filled symbols) have a greater flux ratio than the CNOC clusters. A Kolmogorov-Smirnov test indicates that the probability the two sets of flux ratios are drawn from the same population is 0.8%. Several of the new clusters lie well above the dotted line, indicating their X-ray emission has less central concentration than expected (see e.g., Henry et al., 1992). This is our strongest indication that some of the new clusters have a different surface brightness distribution than the other X-ray selected clusters in the EMSS sample, and this is why they were missed by the EMSS detection algorithm. Although a definitive measure of the surface brightness distributions requires higher resolution and S/N X-ray imaging, from Figure 10 we can see that many of these clusters represent an observationally distinct class of objects.
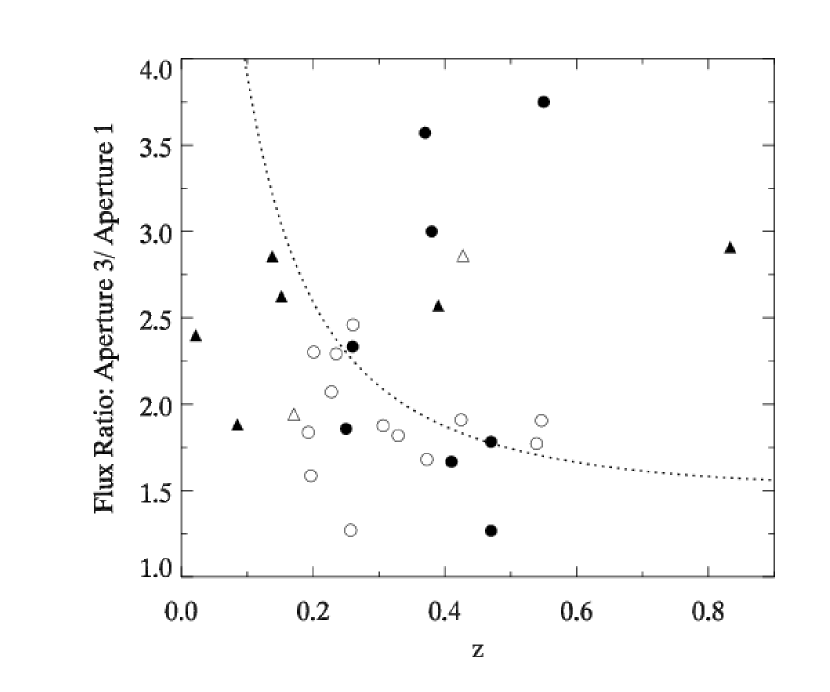
There are two possibilities which would result in the high IPC aperture flux ratios we report for these new clusters. We can illustrate these possibilities by looking at two individual clusters: (1) MS , an original EMSS cluster which is part of the CNOC sample, and (2) Cl J0152.7-1357, discovered both in this survey and in the Wide Angle ROSAT Pointed Survey (WARPS; this cluster is #420 in our new IPC catalog). In the X-rays, MS has an extremely diffuse X-ray structure, no significant central peak, and only a small fraction of the expected IPC flux is detected in a long (43 ksec) ROSAT HRI exposure, the remainder presumably not detectable above the high HRI background (Lewis et al., 1999). This cluster exhibits a large aperture flux ratio (2.9, see Figure 10, it lies at ), a relatively large blue galaxy fraction, and significant optical evidence of a recent merger (Morris et al., 1998). On the other hand, in a ROSAT PSPC exposure Cl J0152.7-1357 shows a significant central concentration, but with a double-peaked structure and some apparent asymmetry (see the detailed X-ray analysis of Ebeling et al. 2000). Examining Fig. 10, we see that Cl J0152.7-1357 (), has a flux ratio exceeding the highest value for EMSS/CNOC clusters, including MS . And yet the Ebeling et al. analysis shows that it is not truly LSB in X-rays; instead, they characterize it as moderately asymmetric, though significantly unrelaxed, and apparently merging. We also note that keV for Cl J0152.7-1357 (Della Ceca et al., 2000), while for the cluster MS is significantly higher ( keV; Jeltama et al. 2001), despite these two clusters having nearly identical ergs s-1 in the keV band, and ; i.e., Cl J0152.7-1357 may be less virialized than MS , but is nonetheless an extremely luminous addition to the EMSS cluster sample. We expect that the uninvestigated new clusters will either be truly LSB, similar to MS , or moderately asymmetric, similar to Cl J0152.7-1357.
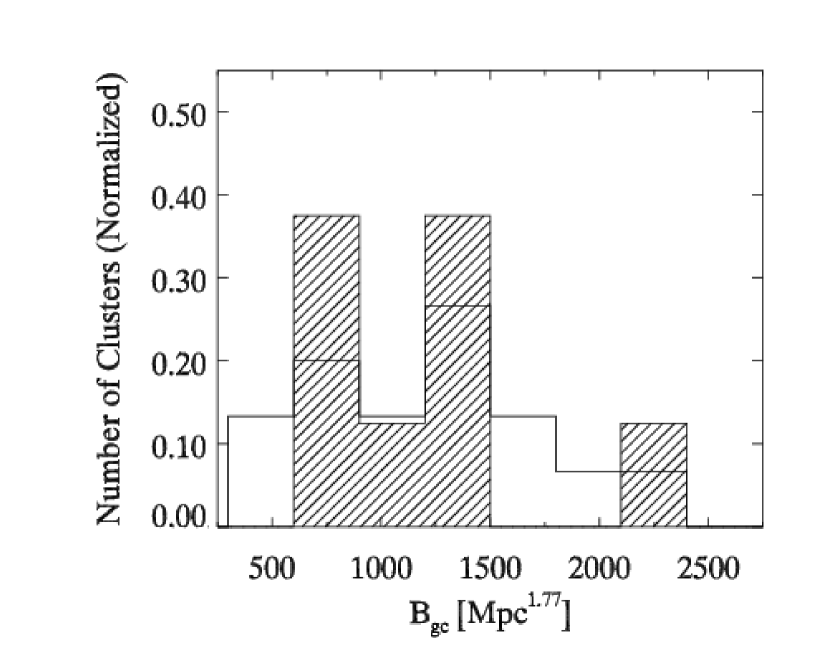
So, while these aperture flux ratios are not definitive indicators of LSB clusters, they do seem to indicate some differences in X-ray morphology. The real question remains, though, are the new clusters physically distinct in structure and galaxy populations as well? We have previously shown (Figures 4 & 5, Paper 1) that the redshifts and X-ray luminosities of the new clusters are distributed similarly to the original distant () EMSS cluster sample of Henry et al. (1992). In Figure 11 we present the galaxy over-density distribution for all new clusters in our catalog with measured Bgc values, compared to the Bgc values for clusters in the EMSS/CNOC sample (Yee & Ellingson, 2001). We note that of the nine clusters presented in this paper, only #3353 does not have an estimated redshift necessary to estimate Bgc accurately, and is not shown. We see that the newly-discovered clusters occupy a similar range of Bgc values as the rich cluster sample.
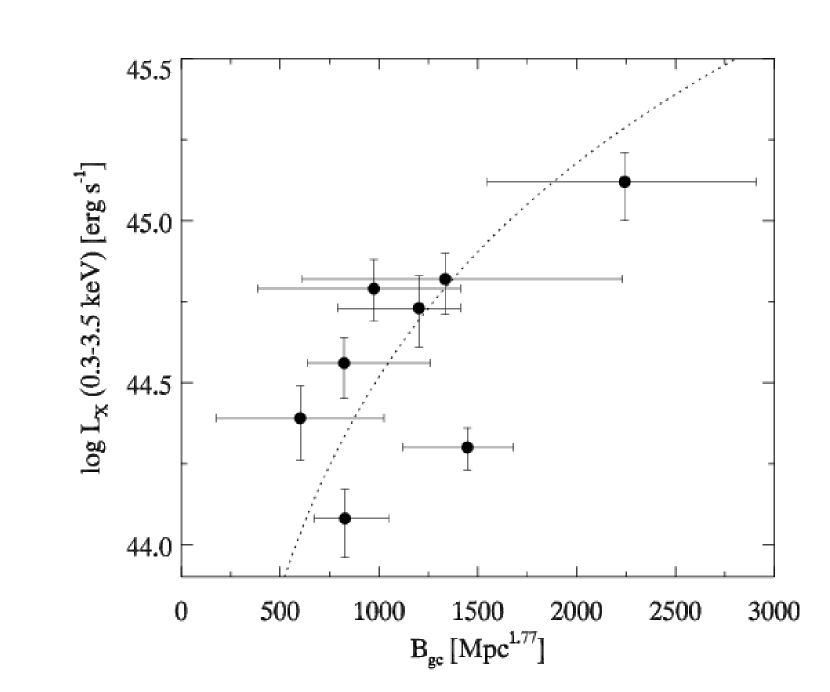
An empirical B relation has been created for the CNOC clusters (Yee & Ellingson, 2001), showing a mild correlation between the two quantities. In Fig. 12 we present Bgc vs. log for the new clusters, with the CNOC B relation shown as a dotted line. This figure shows that the new clusters exhibit a wide scatter, but generally conform to the relation, and do not appear to represent a distinct population, though we caution that so few objects are not a definitive investigation. Clusters #1605 and #2436 exhibit the most significant departure from the B relation, with apparently low X-ray luminosity relative to their richness. However, these two objects are not outliers in Figure 10 or in the other comparisons we present in this paper (see below).
A parameter used as an indicator of evolution in cluster populations is the blue galaxy fraction (). The original definition of was based on the fraction of galaxies in a cluster which are more than 0.2 mag bluer in than the early-type galaxies (Butcher & Oemler, 1978). The observation that rich clusters exhibit higher values of with increasing redshift (the Butcher-Oemler effect) is generally thought to be caused by a systematic gradient in the evolutionary state of clusters. Two physical processes are likely responsible for the effect. Either the mechanism which quenches star formation in cluster galaxies is less effective at high redshift, or the infall rate of blue galaxies into cluster potentials increases with redshift (see e.g.; Dressler & Gunn, 1983; Abadi et al., 1999; Balogh et al., 1999; Ellingson et al., 2001; Kodama & Bower, 2001). Both processes indicate that at high we are seeing cluster populations undergoing continuing evolution. An investigation of in our new clusters is therefore compelling: if we see higher than average values in the new clusters presented here, this would indicate a class of clusters in an earlier evolutionary state, although contemporaneous with the previously known systems.
Here we define the blue galaxy fraction similarly to the method of Ellingson et al. (2001), although with a few significant differences (see below). Based on the slope and zeropoint of a line in the cluster CM diagram approximating the CRS, we make two color cuts and a magnitude cut to count red and blue galaxies which may be cluster members. First, galaxies in each field outside of a 0.5 Mpc radius are excluded. Second, galaxies fainter than either the - and evolution-corrected absolute magnitude of , or the completeness limit (taken to be 0.8 mags brighter than the detection limit) for each filter are excluded. The -corrections are calculated from Coleman et al. (1980), and the evolution is assumed to be (Lin et al., 1999). Third, the slope and zeropoint of a hypothetical, more distant CRS than the the cluster is defined as the red limit for inclusion. Specifically, galaxies redder than a CRS at () are considered likely background contamination and excluded. Finally, a blue limit is defined as a line in the CM diagram having the slope of the cluster CRS, but with a zeropoint bluer by one-half the color difference between an E galaxy and an Sbc galaxy in the filter and color combination observed, where the galaxy colors are given by Fukugita et al. (1995). These cuts effectively divide the CM diagram for each cluster into three components: red background galaxies (), red galaxies assumed to be associated with the CRS (), and blue galaxies which are an indistinguishable combination of foreground contamination and blue cluster members (). In Fig. 13 we show a representative CM diagram in vs. illustrating these color cuts for the galaxies in cluster #1605.
These photometrically defined color cuts result in galaxy counts that are contaminated by field galaxies, and are thus a less robust evolutionary indicator than those derived from an unbiased spectroscopically selected sample of confirmed cluster members (such as that defined for the CNOC clusters by Ellingson et al. 2001). Nonetheless, we can improve our counts in each component by statistically subtracting the expected field galaxy contribution. We make a CM diagram in the same filter and color combination, and magnitude limits as each cluster for the CNOC field galaxy observations of patch 0223+20 (Yee et al., 2000). These observations of 1,409 square arcmin are a precisely and accurately defined set of over 18,000 field galaxies observed at CFHT in five colors, to a depth of . The CNOC field galaxy CM is then divided into precisely the same three components as the cluster CM diagram, and the resulting galaxy counts are scaled to a sky area of 0.5 Mpc radius as observed at each cluster’s redshift.
After subtracting these background counts from each component, we define
| (1) |
We note that the background subtracted red excess component, , should ideally be zero; for our sample of new clusters, has a mean value of only galaxies, indicating that we have proper photometric calibration between our observations and the CNOC data, and therefore an accurate field subtraction. We also calculated this photometric for 15 CNOC clusters to compare the two samples, and the mean value for CNOC clusters was galaxies, again indicating good calibration. In Fig. 14 we present the blue fraction () for the new clusters discovered optically (filled circles) compared to the CNOC clusters (open circles). Cluster #3353 does not have the multi-color data necessary to compute a blue fraction, and is omitted. We have also plotted field blue fractions calculated from the CNOC field galaxy data (crosses without errors), with color cuts calculated assuming the same redshifts and magnitude limits as each of the 8 new clusters. These points illustrate the values of we would expect for each of our new clusters if they had purely field galaxy populations. We see that although a few objects have high values of (notably #2906 at , one of our possible cluster identifications; see Figure 8), as a sample, the new clusters exhibit a similar range of with redshift as the CNOC clusters, suggesting that they are not in a significantly different evolutionary state, at least as far as galaxy populations are concerned. For all the clusters except #2906, the blue fractions are well below the corresponding CNOC field values, indicating that we have clearly detected an overdensity of red galaxies in each case.

To make certain that the methodology we have used to compute is reasonable, we have compared our photometric values for the CNOC clusters with previous work. Ellingson et al. (2001) and Kodama & Bower (2001) measured for several of the CNOC clusters using a spectroscopic and another photometric method, respectively. The mean of the values from the three samples is not significantly different, while individual cluster comparisons indicate only minor differences.
In summary, while these new clusters appear to have more diffuse or asymmetric X-ray emission, our optical comparisons do not indicate that they are significantly different from other EMSS clusters. The verification that these new clusters have similar properties to previously discovered EMSS clusters (excepting the possible cluster #2906) also substantiates their identification as X-ray clusters.
4 Conclusions
We have obtained deep images and multi-color photometry for several new, rich, X-ray luminous clusters of galaxies apparently missing from the EMSS sample. We have estimated the redshift of these clusters based on the detection of a red sequence of galaxies combined with a significant overdensity of galaxies relative to field galaxy counts measured by the Bgc statistic. We have presented the images and color-magnitude (CM) diagrams of these clusters, with a detailed discussion of each object, to elucidate our identification criteria. We have shown that the X-ray and optical properties of these clusters (, Bgc, and the fraction of blue galaxies, ) are consistent with those expected of massive clusters at our photometric redshift estimates. We have compared the photometric optical properties of the new clusters with the CNOC clusters, showing that as a sample, the new clusters (excepting one “possible” cluster ID: # 2906) exhibit no significant differences in either galaxy overdensity (Bgc) or galaxy populations (). Thus we have confirmed the existence and reality of these sources as clusters of galaxies and so validate the analysis of Paper 1, which adds these new clusters to the EMSS complete flux-limited cluster sample. We found in Paper 1 that when these clusters are added to the X-ray luminosity function, the evidence for “negative” evolution in X-ray luminous clusters out to 0.5 has been reduced to .
From our X-ray observations, we have presented evidence that many of these clusters are more diffuse than typical EMSS clusters at similar redshifts using flux ratios obtained through different size apertures (see §3, and Fig. 10). However, the IPC data used for this comparison is of moderate resolution and often poor S/N (see Paper 1), preventing us from analyzing surface brightness profiles for these clusters in detail. So we do not know at present whether these new clusters are examples of true LSB clusters or rather have only moderately asymmetric or “lumpy” X-ray morphologies, which prevented their detection by the original EMSS detect cell size and shape. In either case these new clusters have been selected against by the EMSS survey and perhaps could be selected against by other surveys as well (see e.g., Adami et al., 2000).
There are two possible outcomes of a detailed X-ray and dynamical investigation of these clusters:
(1) They are shown to be virialized, and only moderately asymmetrical. In this case, we expect them to have high (and thus high masses) consistent with their , and they will contribute significantly to the X-ray temperature function (see e.g., Donahue & Voit, 1999; Henry, 2000), in a way that will push current estimates of lower. Likely, they will have galaxy dynamics similar to previously well-studied EMSS/CNOC clusters (as already suggested by ), thus fitting into the current general picture of X-ray selected cluster properties.
(2) These clusters will be identified as X-ray LSB objects. To have high overall luminosities with diffuse emission, it is expected that the ICM will be of lower temperature. Such clusters cannot simultaneously follow scaling relations between mass and or , and may be significantly departed from gravitational equilibrium. This is a plausible description of a class of clusters in the process of formation. In this case, the similar galaxy populations observed suggests that galaxy evolution (i.e., Butcher-Oemler effect) occurs primarily outside of virialized environments, raising new questions about the formation of groups and clusters. We will also have increased our knowledge of the range of properties of X-ray selected clusters.
We intend to pursue high resolution and S/N X-ray imaging with Chandra or XMM-Newton, in order to detect or exclude LSB X-ray morphology, as well as determine , thus measuring the depth of the potential well for these new EMSS clusters. Extensive optical spectroscopy is planned that will provide galaxy velocity dispersions, definitive cluster membership information and galaxy spectral energy distributions. The next generation of X-ray cluster surveys are now underway with XMM-Newton and Chandra, and will yield unprecedented numbers of new clusters, and new insight into X-ray cluster properties measured with greater precision than ever before. We emphasize that our studies have detected real additions to the EMSS sample, due to details of their X-ray morphology (asymmetries and/or LSB). A failure to properly account for clusters such as these could bias the results of future studies. A detailed analysis determining the prevalence of diffuse clusters within a flux-limited, X-ray selected sample will increase the robustness of such a survey’s cosmological constraints.
References
- Abadi et al. (1999) Abadi, M. G., Moore, B., & Bower, R. G. 1999, MNRAS, 308, 947
- Abell (1958) Abell, G. O. 1958, ApJS, 3, 211
- Adami et al. (2000) Adami, C., Ulmer, M. P., Romer, A. K., Nichol, R. C., Holden, B. P., & Pildis, R. A. 2000, ApJS, 131, 391
- Bahcall & Fan (1998) Bahcall, N. A. & Fan, X. 1998, ApJ, 504, 1
- Bahcall et al. (1999) Bahcall, N. A., Ostriker, J. P., Perlmutter, S., & Steinhardt, P. J. 1999, Science, 284, 1481
- Balogh et al. (1999) Balogh, M. L., Morris, S. L., Yee, H. K. C., Carlberg, R. G., & Ellingson, E. 1999, ApJ, 527, 54
- Butcher & Oemler (1978) Butcher, H. & Oemler, A. 1978, ApJ, 219, 18
- Coleman et al. (1980) Coleman, G. D., Wu, C., & Weedman, D. W. 1980, ApJS, 43, 393
- Della Ceca et al. (2000) Della Ceca, R., Scaramella, R., Gioia, I. M., Rosati, P., Fiore, F., & Squires, G. 2000, A&A, 353, 498
- Dickey & Lockman (1990) Dickey, J. M. & Lockman, F. J. 1990, ARA&A, 28, 215
- Donahue et al. (2001) Donahue, M., Mack, J., Scharf, C., Lee, P., Postman, M., Rosati, P., Dickinson, M., Voit, G. M., & Stocke, J. T. 2001, ApJ, 552, L93
- Donahue & Voit (1999) Donahue, M. & Voit, G. M. 1999, ApJ, 523, L137
- Donahue et al. (1998) Donahue, M., Voit, G. M., Gioia, I., Lupino, G., Hughes, J. P., & Stocke, J. T. 1998, ApJ, 502, 550
- Dressler & Gunn (1983) Dressler, A. & Gunn, J. E. 1983, ApJ, 270, 7
- Dressler et al. (1999) Dressler, A., Smail, I., Poggianti, B. M., Butcher, H., Couch, W. J., Ellis, R. S., & Oemler, A. J. 1999, ApJS, 122, 51
- Ebeling et al. (2000) Ebeling, H., Jones, L. R., Perlman, E., Scharf, C., Horner, D., Wegner, G., Malkan, M., Fairley, B. W., & Mullis, C. R. 2000, ApJ, 534, 133
- Ellingson et al. (2001) Ellingson, E., Lin, H., Yee, H. K. C., & Carlberg, R. G. 2001, ApJ, 547, 609
- Ellingson et al. (1991) Ellingson, E., Yee, H. K. C., & Green, R. F. 1991, ApJ, 371, 49
- Fukugita et al. (1995) Fukugita, M., Shimasaku, K., & Ichikawa, T. 1995, PASP, 107, 945
- Gioia et al. (2001) Gioia, I. M., Henry, J. P., Mullis, C. R., Voges, W., Briel, U. G., Böhringer, H., & Huchra, J. P. 2001, ApJ, 553, L105
- Gioia et al. (1990) Gioia, I. M., Maccacaro, T., Schild, R. E., Wolter, A., Stocke, J. T., Morris, S. L., & Henry, J. P. 1990, ApJS, 72, 567
- Gladders & Yee (2000) Gladders, M. D. & Yee, H. K. C. 2000, AJ, 120, 2148
- Gunn et al. (1986) Gunn, J. E., Hoessel, J. G., & Oke, J. B. 1986, ApJ, 306, 30
- Henry (2000) Henry, J. P. 2000, ApJ, 534, 565
- Henry et al. (1992) Henry, J. P., Gioia, I. M., Maccacaro, T., Morris, S. L., Stocke, J. T., & Wolter, A. 1992, ApJ, 386, 408, (H92)
- Jeltama et al. (2001) Jeltama, T. E., Canizares, C. R., Bautz, M. W., Malm, M. R., Donahue, M., & Garmire, G. P. 2001, ApJ, submitted
- Kodama & Arimoto (1997) Kodama, T. & Arimoto, N. 1997, A&A, 320, 41
- Kodama et al. (1998) Kodama, T., Arimoto, N., Barger, A. J., & Arag’on-Salamanca, A. 1998, A&A, 334, 99
- Kodama & Bower (2001) Kodama, T. & Bower, R. G. 2001, MNRAS, 321, 18
- Levine & Monet (2000) Levine, S. E. & Monet, D. G. 2000, in American Astronomical Society Meeting, Vol. 197, 11305
- Lewis et al. (1999) Lewis, A. D., Ellingson, E., Morris, S. L., & Carlberg, R. G. 1999, ApJ, 517, 587
- Lewis et al. (2001) Lewis, A. D., Stocke, J. T., Ellingson, E., & Gaidos, E. J. 2001, ApJ, accepted (Paper 1)
- Lin et al. (1999) Lin, H., Yee, H. K. C., Carlberg, R. G., Morris, S. L., Sawicki, M., Patton, D. R., Wirth, G., & Shepherd, C. W. 1999, ApJ, 518, 533
- Longair & Seldner (1979) Longair, M. S. & Seldner, M. 1979, MNRAS, 189, 433
- Morris et al. (1998) Morris, S. L., Hutchings, J. B., Carlberg, R. G., Yee, H. K. C., Ellingson, E., Balogh, M. L., Abraham, R. G., & Smecker-Hane, T. A. 1998, ApJ, 507, 84
- Mulchaey & Zabludoff (1998) Mulchaey, J. S. & Zabludoff, A. I. 1998, ApJ, 496, 73
- Mushotzky & Scharf (1997) Mushotzky, R. F. & Scharf, C. A. 1997, ApJ, 482, L13
- Nichol et al. (1999) Nichol, R. C., Romer, A. K., Holden, B. P., Ulmer, M. P., Pildis, R. A., Adami, C., Merrelli, A. J., Burke, D. J., & Collins, C. A. 1999, ApJ, 521, L21
- Postman et al. (1996) Postman, M., Lubin, L. M., Gunn, J. E., Oke, J. B., Hoessel, J. G., Schneider, D. P., & Christensen, J. A. 1996, AJ, 111, 615
- Reichart et al. (1999) Reichart, D. E., Nichol, R. C., Castander, F. J., Burke, D. J., Romer, A. K., Holden, B. P., Collins, C. A., & Ulmer, M. P. 1999, ApJ, 518, 521
- Seldner & Peebles (1978) Seldner, M. & Peebles, P. J. E. 1978, ApJ, 225, 7
- Smail et al. (1997) Smail, I., Ellis, R. S., Dressler, A., Couch, W. J., Oemler, A. J., Sharples, R. M., & Butcher, H. 1997, ApJ, 479, 70
- Vikhlinin et al. (1998) Vikhlinin, A., McNamara, B. R., Forman, W., Jones, C., Quintana, H., & Hornstrup, A. 1998, ApJ, 498, L21
- Voit (2000) Voit, G. M. 2000, ApJ, 543, 113
- Yee (1991) Yee, H. K. C. 1991, PASP, 103, 396
- Yee & Ellingson (2001) Yee, H. K. C. & Ellingson, E. 2001, in preparation
- Yee et al. (1996) Yee, H. K. C., Ellingson, E., & Carlberg, R. G. 1996, ApJS, 102, 269
- Yee et al. (1986) Yee, H. K. C., Green, R. F., & Stockman, H. S. 1986, ApJS, 62, 681
- Yee & López-Cruz (1999) Yee, H. K. C. & López-Cruz, O. 1999, AJ, 117, 1985
- Yee et al. (2000) Yee, H. K. C., Morris, S. L., Lin, H., Carlberg, R. G., Hall, P. B., Sawicki, M., Patton, D. R., Wirth, G. D., Ellingson, E., & Shepherd, C. W. 2000, ApJS, 129, 475
- Zaritsky et al. (1997) Zaritsky, D., Nelson, A. E., Dalcanton, J. J., & Gonzalez, A. H. 1997, ApJ, 480, L91
| Cat. # | R.A. (J2000) | decl. (J2000) | Filter | Exp. (s) | UT Date | Comments | |
|---|---|---|---|---|---|---|---|
| 161 | 00 53 10.38 | +01 52 25.3 | 1800 | 23.0 | 19 Dec 1998 | Cirrus | |
| 600 | 19 Dec 1998 | Cirrus | |||||
| 600 | 22.8 | 22 Dec 1998 | Photometric | ||||
| 1350 | 22.6 | 22 Dec 1998 | Photometric | ||||
| 600 | 22 Dec 1998 | Photometric | |||||
| 2700 | 24.1 | 23 Dec 1998 | Photometric | ||||
| 1310 | 07 16 39.58 | +37 19 27.8 | 2400 | 23.6 | 19 Dec 1998 | Cirrus | |
| 600 | 19 Dec 1998 | Cirrus | |||||
| 600 | 20 Dec 1998 | Photometric | |||||
| 600 | 20 Dec 1998 | Photometric | |||||
| 1350 | 22.7 | 20 Dec 1998 | Photometric | ||||
| 2700 | 24.6 | 23 Dec 1998 | Photometric | ||||
| 600 | 23 Dec 1998 | Photometric | |||||
| 1492 | 08 51 40.06 | +33 31 23.3 | 600 | 24 Dec 1998 | Photometric | ||
| 1800 | 23.6 | 24 Dec 1998 | Photometric | ||||
| 2700 | 24.3 | 24 Dec 1998 | Photometric | ||||
| 1200 | 23.1 | 24 Dec 1998 | Photometric | ||||
| 1605 | 09 39 58.76 | 02 49 26.6 | 1800 | 23.6 | 24 Dec 1998 | Photometric | |
| 600 | 24 Dec 1998 | Photometric | |||||
| 2700 | 24.2 | 24 Dec 1998 | Photometric | ||||
| 1681 | 10 07 51.41 | +12 45 43.6 | 1800 | 24.0 | 04 May 2000 | Photometric | |
| 1200 | 22.8 | 04 May 2000 | Photometric | ||||
| 450 | 04 May 2000 | Photometric | |||||
| 2436 | 13 30 11.38 | +30 43 51.3 | 2400 | 24.2 | 03 May 2000 | Photometric | |
| 1800 | 24.4 | 03 May 2000 | Photometric | ||||
| 1200 | 22.8 | 03 May 2000 | Photometric | ||||
| 450 | 03 May 2000 | Photometric | |||||
| 2844 | 15 12 27.90 | +72 00 47.6 | 1800 | 24.0 | 01 May 2000 | Variable Seeing | |
| 450 | 01 May 2000 | Variable Seeing | |||||
| 1200 | 22.4 | 01 May 2000 | Variable Seeing | ||||
| 1800 | 24.0 | 02 May 2000 | Variable Seeing | ||||
| 2906 | 15 31 55.38 | +24 20 42.9 | 1800 | 24.3 | 04 May 2000 | Photometric | |
| 1350 | 22.8 | 04 May 2000 | Photometric | ||||
| 300 | 04 May 2000 | Photometric | |||||
| 3353 | 17 55 51.73 | +67 53 44.9 | 1800 | 01 May 2000 | Photometric | ||
| 1350 | 01 May 2000 | Photometric |
Note. — entries were omitted for observations which were not used in the galaxy color or richness analyses.
| Cat. # | Bgc | log aaLog of the cluster X-ray luminosity in the keV band in ergs s-1. Employing alternative cosmologies (e.g., H km s-1 Mpc-1, , ) reduces these values (a maximum of 30% at ). IPC luminosity is calculated from the third aperture count rate, see Paper 1; the range of values includes an estimate of the Poisson error on the detected count rate. | bbPhotometrically defined blue galaxy fraction, as shown in Fig. 14. Errors are based on the numbers of galaxies detected within the color cuts. | Ap3/Ap1ccRatio of IPC aperture 3 to aperture 1 flux, indicating X-ray extent (see §3). | Notes | |
|---|---|---|---|---|---|---|
| [( Mpc)1.77] | Ratio | |||||
| 161† | [0.55] | [1340] | [44.8] | 3.75 | Dominant X-ray Source | |
| [0.35] | [740] | [44.4] | 2nd Cluster in Field | |||
| 1310 | [0.37] | [1200] | [44.7] | 3.57 | ||
| 1492 | [0.47] | [2240] | [45.1] | 1.78 | ||
| 1605 | [0.25] | [830] | [44.1] | 1.86 | ||
| 1681 | [0.41] | [600] | [44.4] | 1.67 | ||
| 2436 | [0.26] | [1450] | [44.3] | 2.33 | GHO Cluster, Dominant X-ray Source | |
| [0.30] | [520] | 2nd Cluster 5′ NE | ||||
| 2844† | [0.38] | [820] | [44.6] | 3.00 | Variable Seeing | |
| 2906† | [0.47] | [970] | [44.8] | 1.27 | BCG 2′ NE, Possible Contamination | |
| 3353 | Nearby Group; No Bgc Measured |
Note. — Best fit values for redshift, Bgc, and are given in [square brackets] after the range. Clusters denoted with a † are possible cluster identifications, pending further investigation.