Plasma Diagnostics in High-Resolution X-ray Spectra of Magnetic Cataclysmic Variables
Abstract
Using the Chandra HETG spectrum of EX Hya as an example, we discuss some of the plasma diagnostics available in high-resolution X-ray spectra of magnetic cataclysmic variables. Specifically, for conditions appropriate to collisional ionization equilibrium plasmas, we discuss the temperature dependence of the H- to He-like line intensity ratios and the density and photoexcitation dependence of the He-like line ratios and the Fe XVII line ratio. We show that the plasma temperature in EX Hya spans the range from to keV and that the plasma density , orders of magnitude greater than that observed in the Sun or other late-type stars.
Lawrence Livermore National Laboratory, L-43, 7000 East Avenue, Livermore, CA 94550
1. Introduction
In magnetic cataclysmic variables (mCVs), the flow of material lost by the secondary is channeled onto small spots on the white dwarf surface in the vicinity of the magnetic poles. Because the infall velocity is supersonic, the flow passes through a strong shock above the stellar surface, where 15/16 of its prodigious kinetic energy is converted into thermal energy. The post-shock plasma is hydrostatically supported, and cools via cyclotron, thermal bremsstrahlung, and line emission before settling onto the white dwarf surface. Consequently, the post-shock plasma of mCVs is both multi-temperature and multi-density, with a post-shock temperature keV and density for a mass-accretion rate (hence ), relative spot size , and free-fall velocity . If the shock height is a small fraction of the white dwarf radius, a significant fraction of the resulting X-ray emission is intercepted by the white dwarf surface. Competition between photoelectric absorption and Thompson and Compton scattering results in keV X-rays being predominantly scattered by the white dwarf photosphere, resulting in a hard reflection spectral component, while softer and harder X-rays are increasingly likely to deposit their energy in the white dwarf photosphere, heating it to a temperature kK. must be larger by a factor of to explain the soft X-ray spectral component of AM Her-type mCVs.
The unique aspect of the X-ray–emitting plasma in mCVs is the high densities, which are the result of the magnetic funneling of the mass lost by the secondary, the factor-of-four density jump across the accretion shock, and the settling nature of the post-shock flow, wherein the density . X-ray line intensity ratios have long been used to diagnose the temperature and density of solar plasma, but until recently the effective area and spectral resolution of X-ray observatories have been inadequate to allow similar studies of cosmic X-ray sources. The multi-temperature nature of the plasma in CVs is readily apparent from the broad-band nature of their X-ray continua, but even with the 0.5–10 keV bandpass and eV spectral resolution of the ASCA SIS detectors, it is possible to adequately describe the observed spectra of CVs with a small number (typically 2) of discrete temperature components. Ishida, Mukai, & Osborne (1994) and subsequently Fujimoto & Ishida (1997) first applied the ratio of the intensities of the H- to He-like lines of Mg, Si, S, Ar, and Fe in the ASCA SIS spectrum of the intermediate polar-type mCV EX Hya to constrain the range of temperatures present in its accretion column. Unfortunately, ASCA did not have the spectral resolution necessary to utilize any of the density diagnostics available in the X-ray bandpass, such as the density-sensitive He-like triplets, which require eV. With the launch of the Chandra and XMM-Newton X-ray observatories, it is now possible to utilize a broad range of spectral diagnostics to characterize the plasma of mCVs.

2. Chandra HETGS Observation of EX Hya
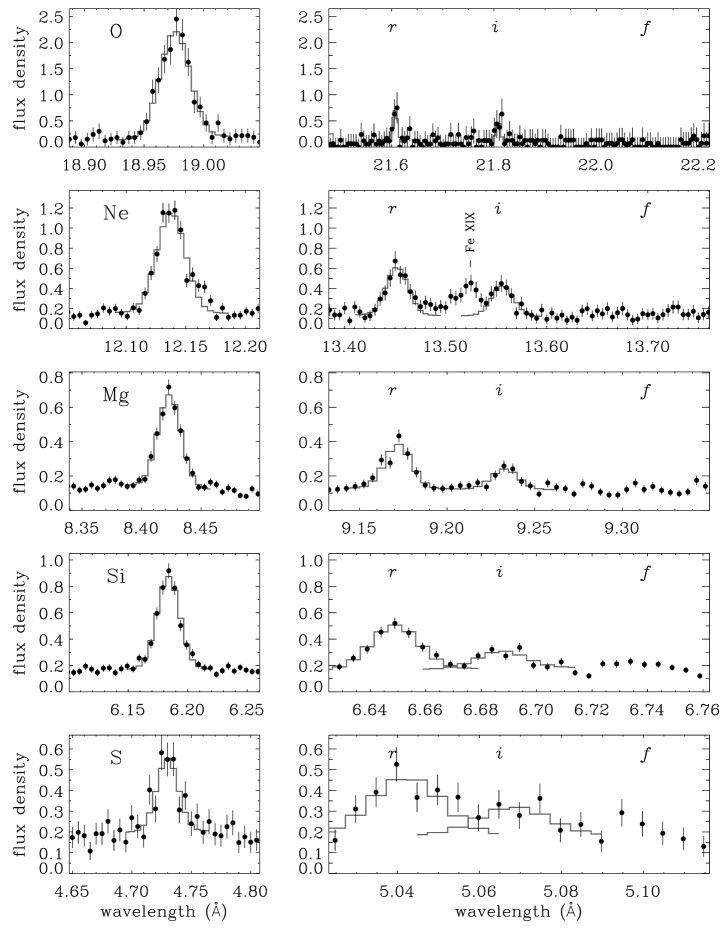
Motivated by the beautiful ASCA spectrum, we recently obtained Chandra HETGS ( and 0.02 Å) and XMM-Newton RGS ( Å) and EPIC spectra of EX Hya. The 60 ks Chandra observation was performed on 2000 May 18 during a multiwavelength (RXTE, Chandra, EUVE, FUSE, HST, and ground-based optical) campaign, while the XMM-Newton observation (100 ks) was performed on 2000 July 1–2. Because of space limitations, we discuss here only the Chandra HETG spectrum, which is shown in Figure 1. The spectrum consists of a modest continuum with superposed lines of H- and He-like O, Ne, Mg, Si, S, and Fe; Fe XVII–XXIV; and “neutral” Fe (via the weak fluorescent line at 6.4 keV = 1.94 Å). Whereas the optical–FUV emission lines of EX Hya are broad, with –– (Hellier et al. 1987; Greeley et al. 1997; Mauche 1999), the X-ray emission lines are narrow, with . This is explained qualitatively by the fact that (1) the post-shock velocity and (2) we view the EX Hya binary nearly edge-on, so the velocity vector of the post-shock flow lies more nearly on the plane of the sky.
3. Temperature Diagnostic
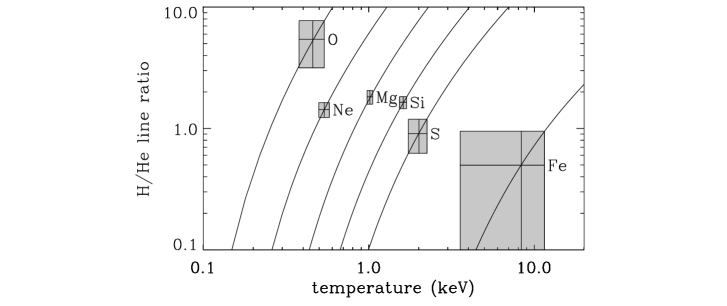
As was done with the ASCA spectra, we can use the ratio of the H- to He-like line intensities in the HETG spectrum of EX Hya to constrain the temperature distribution in the post-shock plasma. This was accomplished by fitting Gaussians to the various emission lines, accounting for the effective area and resolution function of the spectrometer. Results of these fits are shown in Figure 2 for O, Ne, Mg, Si, and S. In addition to easily resolving the H- and He-like emission lines, the HETGS cleanly resolves the resonance (), intercombination (), and forbidden () lines of the He-like triplets, as well as accounts for the presence of other emission lines, such as the relatively strong Fe XIX emission line situated between the resonance and intercombination lines of Ne IX (these three lines appear as a blob in the XMM RGS spectrum). Assuming the Mewe, Gronenschild, & van den Oord (1985) collisional ionization equilibrium (CIE) ionization balance and line intensities, Figure 3 shows that the measured H- to He-like line intensity ratios require that the plasma temperature extends from keV to keV. This is the same range inferred by Fujimoto & Ishida (1997) from the ASCA spectrum of EX Hya, even though the SIS could not resolve the H- and He-like emission lines of O and Ne. The lower temperature limit is a bit of a puzzle, because it seems inescapable that the plasma will cool below this temperature. A possible explanation is that the optical depths in the lines begins to be important at this temperature, where the plasma density is expected to be a factor of times higher than the value just below the accretion shock.

4. Density Diagnostics
4.1. He-like R Line Ratios
The standard density diagnostic of high-temperature plasmas is the ratio of the forbidden to intercombination lines of He-like ions (Gabriel & Jordan 1969; Blumenthal, Drake, & Tucker 1972; Porquet et al. 2001). Because the upper level of the forbidden line is metastable, it can be depopulated by collisional excitation, leading to the conversion of the – forbidden line into the – intercombination blend (for the Grotrian diagram, refer to the left panel of Fig. 4). We used the LXSS plasma code being developed at LLNL (Mauche, Liedahl, & Fournier 2001) to calculate the line ratios as a function of electron density for the abundant elements, and present the results in Figure 5. It can be seen that the critical density for this ratio scales with , ranging from for C to for Fe. Unfortunately, this trend is opposite to that in the accretion column of mCVs (where the high- ions dominate at the top of the column where the temperature is highest and the density is lowest, and the low- ions dominate at the bottom of the column where the temperature is lowest and the density is highest), limiting our ability to “map” the density structure of the column. As is evident from Figure 2, all the He-like triplets of EX Hya are in the “high-density limit” (), implying that the plasma density .
4.2. Complications from Photoexcitation
Unfortunately, this result is not entirely secure. In UV-bright sources like early-type stars, X-ray binaries, and CVs, photoexcitation as well as collisional excitation acts to depopulate the upper level of the He-like forbidden lines. If the radiation field is sufficiently strong at the appropriate wavelengths, the line ratio can be in the “high-density limit” regardless of the density. Photoexcitation has been shown to explain the low line ratios of early-type stars (Kahn et al. 2001; Waldron & Cassinelli 2001), and could explain the low line ratios of EX Hya. To investigate this effect, we included in the LXSS level-population kinetics calculation the photoexcitation rates , where is the continuum spectral energy distribution and are the oscillator strengths of the various transitions. For simplicity, we assume that (i.e., the radiation field is that of a blackbody of temperature ) and that the dilution factor of the radiation field is equal to (i.e., the X-ray–emitting plasma is in close proximity to the source of the photoexcitation continuum). For kK, we obtain the line ratios shown by the full curves in the right panel of Figure 5, which demonstrates that, for the given assumptions, all of the He-like line ratios through Si XIII are significantly affected by photoexcitation. It is unfortunate that this effect begins to disappear at S XV, where the HETGS effective area is low and the spectral resolution is only just sufficient to resolve the He-like triplet. Calorimeter-type detectors like those planned for Astro-E2 and Constellation-X are required to work at these short wavelengths/high energies.

4.3. Fe XVII I(17.10 Å)/I(17.05 Å) Line Ratio
Other than the H- and He-like lines of the abundant elements, the brightest emission lines in the Chandra HETG spectrum of EX Hya are the – (, ) lines of Fe XVII at 15–17 Å (Fig. 1). These lines are strong in the X-ray spectra of high-temperature CIE plasmas because of the high abundance of Fe, the persistence of Ne-like Fe over a broad temperature range (–12 MK), and the large collision strengths for transitions. The importance of Fe XVII has engendered numerous studies of its atomic structure and level-population kinetics, and while emphasis is usually placed on the temperature dependence of the – line ratios (e.g., Rugge & McKenzie 1985; Smith et al. 1985; Raymond & Smith 1986), Mauche, Liedahl, & Fournier (2001) recently discussed the density dependence of these ratios.
The Grotrian diagram for Fe XVII is shown in the right panel of Figure 4. Like the upper level of the forbidden line of He-like ions, the upper level of the 17.10 Å line of Fe XVII is metastable, so collisional depopulation sets in at lower densities, and the intensity ratio of the 17.10 Å line to any of the other – lines (say, the 17.05 Å line) provides a diagnostic of the plasma density. The Fe XVII density diagnostic is ideal for mCVs for two reasons. First, the critical density is high: , comparable to that of Si XIII. Second, the line ratio is less sensitive than the He-like line ratios to photoexcitation. In Fe XVII, photoexcitations out of the level go primarily into the manifold, requiring a significant flux of photons in the 190–410 Å waveband. In He-like ions, photoexcitations out of the level go primarily into the levels, requiring a significant flux of photons at , 1263, 1036, 865, 743, 637, 551, and 404 Å for O, Ne, Mg, Si, S, Ar, Ca, and Fe, respectively. Because the photoexcitation continuum is typically stronger in the UV–FUV than in the EUV, the Fe XVII line ratio is less sensitive to photoexcitation.
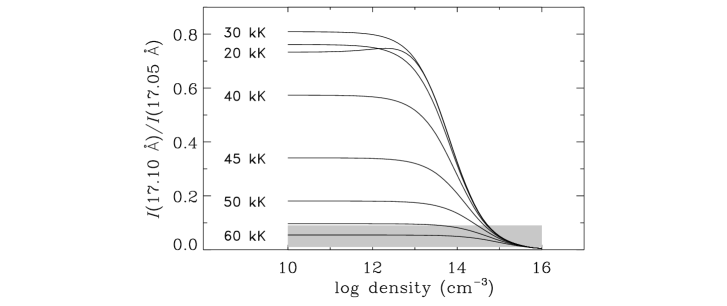
To investigate the density, temperature, and photoexcitation sensitivity of the Fe XVII line ratio, we calculated LXSS atomic models of Fe XVII for a range of densities –, temperatures –8 MK (spanning the range for which the Fe XVII ionization fraction is ), and blackbody photoexcitation temperatures –60 kK. The line ratio for MK, the peak of the Fe XVII ionization fraction, is shown in Figure 6. The measured Fe XVII line ratio of can be explained if the plasma density or if the photoexcitation temperature kK. As detailed by Mauche, Liedahl, & Fournier (2001), the second option is consistent with the assumptions (blackbody emitter, dilution factor equal to ) and the observed FUV flux density only if the fractional emitting area of the accretion spot . This constraint and the observed X-ray flux requires a density for the post-shock flow. Either way, then, the Chandra HETG spectrum of EX Hya requires that the plasma density in this mCV is orders of magnitude greater than that observed in the Sun or other late-type stars.
5. Summary
Using the Chandra HETG spectrum of EX Hya as an example, we have discussed some of the plasma diagnostics available in high-resolution X-ray spectra of mCVs. Specifically, we have discussed the temperature dependence of the H- to He-like line intensity ratios and the density and photoexcitation dependence of the He-like line ratios and the Fe XVII line ratio. Since the discussion assumes that the plasma is in collisional ionization equilibrium and that the optical depths in the lines are negligible, it does not apply to (1) the pre-shock flow, where photoionization competes with collisional ionization to determine the physical state of the plasma, (2) the immediate post-shock flow, where the ions and electrons are not in thermal equilibrium, or (3) the very base of the post-shock flow, where the line optical depths are non-negligible. Where the plasma is optically thin and in collisional ionization equilibrium, the plasma temperature spans the range from to keV and the plasma density . The lower temperature probably signals where the plasma becomes optically thick in the lines, while the higher temperature is comparable to the shock temperature, which Fujimoto & Ishida (1997) inferred from the ASCA SIS spectrum of EX Hya is keV.
This communication has only scratched the surface of the many plasma diagnostics available in high-resolution X-ray spectra of mCVs. For lack of space, our discussion has concentrated on density diagnostics and the complicating affects of photoexcitation because these features are unique to mCVs. For a more general discussion of the physics of high-temperatures plasmas, the reader is referred to the volume “X-ray Spectroscopy in Astrophysics” (van Paradijs & Bleeker 1999), and particularly the chapters by R. Mewe and D. Liedahl.
Acknowledgments.
We are indebted to D. Liedahl for his significant contributions to this work, and thank H. Tananbaum for the generous grant of Director’s Discretionary Time which made the Chandra observations possible. Support for this work was provided in part by NASA Long-Term Space Astrophysics Program grant S-92654-F and NASA Chandra Guest Observer grant NAS8-39073. This work was performed under the auspices of the U.S. Department of Energy by University of California Lawrence Livermore National Laboratory under contract No. W-7405-Eng-48.
References
Blumenthal, G. R., Drake, G. W. F., & Tucker, W. H. 1972, ApJ, 172, 205
Fujimoto, R., & Ishida, M. 1997, ApJ, 474, 774
Gabriel, A. H., & Jordan, C. 1969, MNRAS, 145, 241
Greeley, B. W., Blair, W. P., Long, K. S., & Knigge, C. 1997, ApJ, 488, 419
Hellier, C., Mason, K. O., Rosen, S. R., & Córdova, F. A. 1987, MNRAS, 228, 463
Ishida, M., Mukai, K., & Osborne, J. P. 1994, PASJ, 46, L81
Kahn, S. M., et al. 2001, A&A, 365, L312
Mauche, C. W. 1999, ApJ, 520, 822
Mauche, C. W., Liedahl, D. A., & Fournier, K. B. 2001, ApJ, 560, in press (astro-ph/0106518)
Mewe, R., Gronenschild, E. H. B. M., & van den Oord, G. H. J. 1985, A&AS, 62, 197
Porquet, D., Mewe, R., Dubau, J., Raassen, A. J. J., & Kaastra, J. S. 2001, A&A, 376, 1113
Raymond, J. C., & Smith, B. W. 1986, ApJ, 306, 762
Rugge, H. R., & McKenzie, D. L. 1985, ApJ, 297, 338
Smith, B. W., Raymond, J. C., Mann, J. B., & Cowan, R. D. 1985, ApJ, 298, 898
van Paradijs, J., & Bleeker, J. A. M. 1999, X-ray Spectroscopy in Astrophysics (Berlin: Springer)
Waldron, W. L., & Cassinelli, J. P. 2001, ApJ, 548, L45