The Interstellar Medium around the Supernova Remnant G320.4–1.2
Abstract
Using the Australia Telescope Compact Array, we have carried out a survey of the H i emission in the direction of the “barrel-shaped” supernova remnant (SNR) G320.4–1.2 (MSH 15–52) and its associated young pulsar B1509–58. The angular resolution of the data is , and the rms noise of the order of 30 mJy/beam ( K). The H i observations indicate that the N-NW radio limb has encountered a dense H i filament (density 12 cm-3) at the same LSR velocity than that of the SNR (V km s-1 ). This H i concentration would be responsible for the flattened shape of the NW lobe of G320.4-1.2, and for the formation of the radio/optical/X–ray nebula RCW 89. The emission associated with the bright knots in the interior of RCW 89 can be explained as arising from the interaction between the collimated relativistic outflow from the pulsar and the denser part of this H i filament (density 15 cm-3). The S-SE half of the SNR, on the other hand, seems to have rapidly expanded across a lower density enviroment (density cm-3). The H i data also reveal an unusual H i feature aligned with a collimated outflow generated by the pulsar, suggestive of association with the SNR. The anomalous kinematical velocity of this feature (V km s-1 ), however, is difficult to explain.
Subject headings:
ISM: individual (G320.4–1.2, RCW 89, MSH15-52) — ISM: structure — pulsars: individual (B1509–58) — radio lines: ISM — supernova remnants1. Introduction
The radio morphologies of supernova remnants (SNRs) are usually approximated by limb-brightened spherical shells, in which the shock front accelerates electrons to synchrotron-emitting energies. However, observations at increasingly higher resolution and sensitivity have demonstrated that actual SNR morphologies are much more complex, exhibiting “break-out”, “barrel” and helical patterns (Manchester (1987); Dubner et al. (1996); Whiteoak & Green (1996); Gaensler (1998); Dubner et al. 1998b ). Such a diversity reflects not only variations in the properties of the progenitor star and of the explosion itself, but also echoes the physical conditions of circumstellar and interstellar gas and magnetic fields. The interpretation of SNR morphologies has the additional complication that the images observed are a two-dimensional projection of a three-dimensional object. Radio spectroscopy of the interstellar medium (ISM) provides a valuable tool to unravel these 3D effects using kinematic signatures. As part of an on-going effort to study the interaction of SNRs with their environment (Dubner et al. 1998a ; Dubner et al. 1998b ; Dubner et al. (1999); Giacani et al. (2000)), we present a study of the distribution and kinematics of the neutral hydrogen in the vicinity of SNR G320.4–1.2 (MSH 15–52).
SNR G320.4–1.2 has an unusual radio morphology, consisting of two loosely connected emission regions, one to the N-NW and the other to the S-SE. Figure 1 shows the radio and X-ray emission from the SNR. The young pulsar PSR B1509-58 lies between the two main radio components of the SNR; the pulsar’s position as measured by Gaensler et al. (1999), hereafter G99, is marked in Figure 1 with a cross. The optical/radio/X-ray nebula RCW 89 is located on the NW extreme of G320.4–1.2.
Like many other SNRs, G320.4–1.2 has a “bilateral” or “barrel” morphology (Kesteven & Caswell (1987); Gaensler (1998)). Many different mechanisms have been proposed to account for this morphology, relating to both the progenitor star and supernova explosion (“intrinsic effects”) (Kesteven & Caswell (1987); Manchester (1987); Brighenti & D’Ercole (1994); Willingale et al. (1996)) and to subsequent interaction with the SNR environment (“extrinsic effects”) (Bisnovatyi-Kogan, Lozinskaya, & Silich (1990); Fulbright & Reynolds (1990)). Most recently, Gaensler (1998) has argued that the bilateral appearance arises when a SNR expands into an elongated low-density cavity; the radio emission then originates at the sites where the shock encounters the walls of the cavity.
This peculiar SNR and its energetic young pulsar have been extensively observed throughout the electromagnetic spectrum (see G99 for a summary of previous observations). In particular, recent X-ray and radio data provide convincing evidence that the SNR and pulsar resulted from a single supernova explosion which occurred approximately 1700 yrs ago (Tamura et al. (1996); Brazier & Becker (1997); G99; Gaensler et al. (2001)). Specifically, G99 argue that the entire complex can be interpreted as the result of a low-mass or high-energy explosion occurring near one edge of an elongated low density (n cm-3) cavity. To the NW the SNR has expanded into dense material (n cm-3), while to the SE the remnant has expanded rapidly across the low density cavity. Meanwhile, the pulsar appears to be generating twin collimated outflows, the northern of which is interacting with the SNR to produce a collection of compact radio/X-ray knots embedded in RCW 89. A distance of (5.2 1.4) kpc was derived for G320.1–1.2 by G99, based on H i absorption measurements, in agreement with the results of Caswell et al. (1975).
Within this complex scenario, it is clear that the interpretation of the existing body of observational data can greatly benefit from an accurate knowledge of the distribution and kinematics of the surrounding neutral hydrogen emission. Here we report on an H i survey of SNR G320.4–1.2 and its environment, carried out with the Australia Telescope Compact Array.
2. Observations and Data Reduction
Interferometric H i observations towards G320.4–1.2 were carried out using the Australia Telescope Compact Array (ATCA; Frater, Brooks, & Whiteoak (1992)), a six-element synthesis telescope located near Narrabri, NSW, Australia, during a session of 13 hours on 1998 October 13. In order to achieve optimal coverage in the radial direction, the array was used in the non-standard 210-m configuration, in which five antennas are positioned closely together so as to provide 10 baselines ranging from 31 to 214 m. The sixth (fixed) antenna is separated from the other five elements by 5–6 km, and was not used in our analysis.
A region surrounding the SNR was surveyed in a mosaic of 19 pointings, following a hexagonal grid to cover six square degrees . The separation between grid-points of about satisfies the Nyquist sampling criterion for the primary beam width of (FWHM). Observations were centered at a frequency of 1420 MHz, using 1024 channels over a total bandwidth of 4 MHz. The absolute flux density scale was determined by assuming a flux density for PKS B1934–638 of 14.85 Jy at 1.42 GHz. Observations of PKS B1934–638 were also used to determine the spectral response across the observing band. Time variability in the antenna gains was calibrated using regular observations of PKS B1540–828. After editing and calibration, continuum emission was subtracted from the data in the plane using the task UVLSF in AIPS (van Langevelde & Cotton (1990)). The data were then transferred to the MIRIAD package (Sault & Killeen (1999)), where all pointings were imaged simultaneously to form 390 mosaicked planes, covering LSR velocities between –150 and +171 km s-1 at a velocity resolution of 1 km s-1 (channel separation of 0.82 km s-1 ). This cube was then deconvolved using a mosaicked maximum-entropy technique (Sault, Staveley-Smith, & Brouw (1996)), and then convolved with a gaussian restoring beam.
Any analysis of H i emission requires measurements at all spatial scales down to the resolution limit. However, our ATCA observations are not sensitive to structures larger than . To recover this short-spacing data, we have utilized H i observations made using the Parkes 64-m radio-telescope, carried out as part of the Southern Galactic Plane Survey (SGPS; McClure-Griffiths et al. (2001)) with an angular resolution of . The Parkes data were multiplied by a factor of 0.9 to match the flux calibration applied to the ATCA data; interferometric and single-dish data were then appropriately weighted according to their respective primary beam shapes and combined using the task IMMERGE in MIRIAD (Stanimirović (1999); Sault & Killeen (1999)). The final combined cube has units of Jy beam-1. To convert to units of brightness temperature, these data must be multiplied by a factor of 16.3 K Jy-1 beam. The angular resolution of the data is (Position Angle ), and the rms in line-free channels is mJy beam-1 ( K).
3. Results
3.1. General H i distribution
Figure 2 illustrates the general properties of H i emission in the direction of G320.4–1.2. The top panel shows an average H i profile of the observed region taken from the Parkes SGPS data, while the bottom panel displays the circular rotation model towards , , assuming kpc and km s-1 and using the rotation curve of Fich, Blitz & Stark (1989).
The neutral hydrogen emission in this direction has a complex structure, and is spread over more than 200 km s-1 . The five main peaks of this spectrum can be interpreted as emission from gas related to the Sagitarius-Carina galactic arm (that the line of sight crosses at both and km s-1 ), the Scutum -Crux arm (at velocities of and + 40 km s-1 ), and to the local gas contribution near 0 km s-1 . The SNR would be located on the far border of Carina arm (Georgelin et al. 1987).
We investigate the H i emission distribution in the entire observed velocity interval, looking for morphological and/or kinematical evidences of interaction of G320.4–1.2 and its different components with the surrounding H i gas. Figure 3 provides an overview of the distribution of atomic hydrogen in the surveyed region. It displays the H i emission between km s-1 and km s-1 , the interval in which significant H i emission is found. Each image is the average of six consecutive spectral channels, spanning 5 km s-1 . However the analysis is carried out with the highest possible velocity resolution. The field shown is slightly reduced in size with respect to the observed field to avoid edge effects. The velocity shown in the lower left corner of each image corresponds to the velocity of the first integrated channel. Superimposed on the H i images are a few representative contours of the radio continuum emission of G320.4–1.2 at 1.4 GHz as taken from G99, at a spatial resolution of .
From km s-1 to km s-1 , the most conspicuous feature in H i is an elongated filament seen partially overlapping the bright NW part of the SNR. This filament runs diagonally from NE to SW, in a direction parallel to the Galactic plane. This filament, is discussed in detail in the next section.
From –60 to –40 km s-1 , a strong gradient in the gas density (assumed to be optically thin) between the NW half of the field (closer to the Galactic plane) and the SE corner (away from the Galactic plane) is evident. This density gradient persists up to km s-1 , although with less contrast than at more negative velocities. Significant absorption is evident against bright continuum emission from RCW 89 in this velocity range (See also G99).
From to km s-1 , the H i emission appears quite uniformly distributed, with a few brighter concentrations near the NW corner. Strong absorption against RCW 89 is observed at these velocities. In the most severe cases, this absorption is surrounded by residual sidelobes which were not completely removed in the deconvolution process.
Positive velocities along this line-of-sight correspond to distant gas, located beyond kpc (see Fig 2). We have examined the H i emission at positive velocities, bearing in mind that these data can also include contributions from closer gas which might be associated with G320.4–1.2 but which has been kinematically disturbed.
In the velocity range between –1.5 and 8 km s-1 (i.e. in the images labeled –1.5 km s-1 and +3.5 km s-1 in Fig. 3), two parallel bands of H i emission cross over the field from NE to SW. The H i concentration that runs close to the SE lobe of G320.4–1.2, shows good morphological correspondence with the radio continuum emission of the SNR. This H i filament, as seen in projection, surrounds the SE lobe of the SNR along the eastern and southern borders. Such correspondence is even closer when comparing the H i distribution with the X-ray emission. However, since at this kinematical velocity there is no way to disentangle the contribution of gas likely to be associated with G320.4–1.2 from the intense local gas emission, we do not consider this structure as a firm candidate for H i-SNR association.
From +13 to +22 km s-1 , there is an unusual, bright filament oriented almost perpendicular to the Galactic plane, breaking the plane-parallel symmetry observed otherwise. This filament overlaps both the brightest region of the SNR and the pulsar itself, and will be discussed further in the next section.
At +33 km s-1 and +38 km s-1 , a long, moderately bright H i filament is observed in apparent contact with the NW half of the SNR. However, since most of the H i in this direction is expected to have this plane-parallel distribution, we conclude that this feature is most probably distant background material, located 14 kpc away. The remaining high-velocity images show no features which can be feasibly associated with G320.4–1.2.
In order to determine the systemic velocity of G320.4-1.2, we can use Fig.3 to analize the characteristics of the HI near the SNR. In agreement with previous HI absorption studies ( Caswell et al. 1975, G99), the images in Fig. 3 show that HI absorption is present towards RCW 89 in the velocity range between –61 km s-1 and –51 km s-1 . Thus, the kinematical velocity corresponding to G320.4-1.2 must be more negative than –61 km s-1 . In addition, H i is observed in emission near the northern portion of the remnant up to km s-1 . We therefore conclude that the systemic velocity of G320.4-1.2 lies in the range –76 to –61 km s-1 . Adopting a systemic velocity of km s-1 , the kinematical distance to the source turns out to be about 5 kpc, in good agreement with a previous estimate by G99.
3.2. Particular H i Features
In this section we focus on specific H i features, searching for favorable H i-SNR associations.
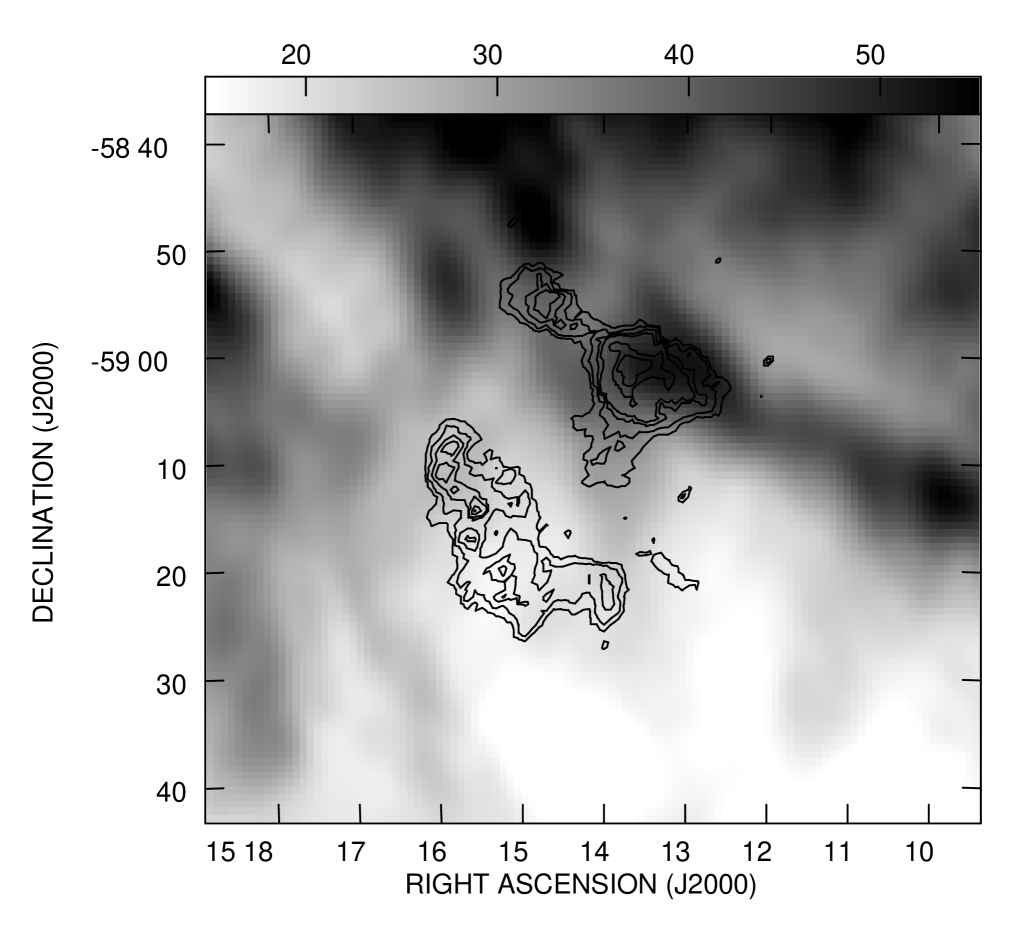
1. The northern filament in the interval km s-1 : This velocity interval corresponds to the systemic velocity of G320.4-1.2. Figure 4 shows in greyscale the H i distribution obtained by integrating between velocities of –76 and –66 km s-1 . The 1.4 GHz radio continuum emission from G320.4-1.2 (as taken from G99) is plotted in contours. This extended H i filament to the NW may represent the dense external wall previously suggested by G99 to be slowing down the expansion of G320.4-1.2 in this direction. This feature may also be responsible for the flattened shape of the NW lobe of the bilateral SNR. In particular this filament has a peak in HI emission ( brightness temperature 80 K at v=–70 km s-1 ) exactly overlapping RCW89. We propose that this H i cloud (about 7’ in diameter) associated with RCW89, is the dense material with which the SNR has collided and with which the outflow from the pulsar is interacting (Tamura et al. (1996); G99). According to this interpretation, the bright nebula RCW89 (or, more precisely, the bright radio/X-ray knots in its interior) has formed at the site of interaction between the collimated relativistic outflow from the pulsar and the dense H i cloud. The optical emission associated with RCW89 can be explained as arising from the ionized outer layers of this high density material, as first suggested by Manchester (1987).
The total H i mass of the extended filament has been estimated in M 4000 M⊙, where an appropriate background correction has been applied. An average atomic density n 12 cm-3 has been calculated for this elongated H i feature by assuming that the dimension along the line of sight equals the size of the minor axis of the filament. In particular, for the denser concentration of this feature, associated with RCW 89, a total mass M 1700 M⊙ and a volume density n 15 cm-3, have been derived (in this case a spherical geometry was assumed for the H i feature).
As another evidence of the interaction of G320.4–1.2 with its surroundings, we have searched for accelerated shocked H i gas all along the northern H i filament, and especially in the direction of RCW 89, where the major interaction SNR–ISM occurs. We examined several H i spectra, as well as RA vs VLSR plots (traced at constant declination), looking for high-velocity features, as observed for example in IC 443 (DeNoyer 1977). Within the moderate angular resolution of the present data, no evidences of accelerated H i gas were found.
We have also investigated the characteristics of the interstellar gas where the SE lobe of G320.4-1.2 has expanded. To carry out this calculation we have considered a sample volume in a location relatively free of H i concentrations around V km s-1 , the systemic velocity of G320.4–1.2. The obtained volume density is n cm-3.
The observed contrast in density between the H i near the NW lobe and the ambient H i in the interior of the SNR, is consistent with the model of G99 in which the NW half of the SNR has encountered the edge of a cavity, while the SE half has expanded relatively unimpedded into a lower density environment.
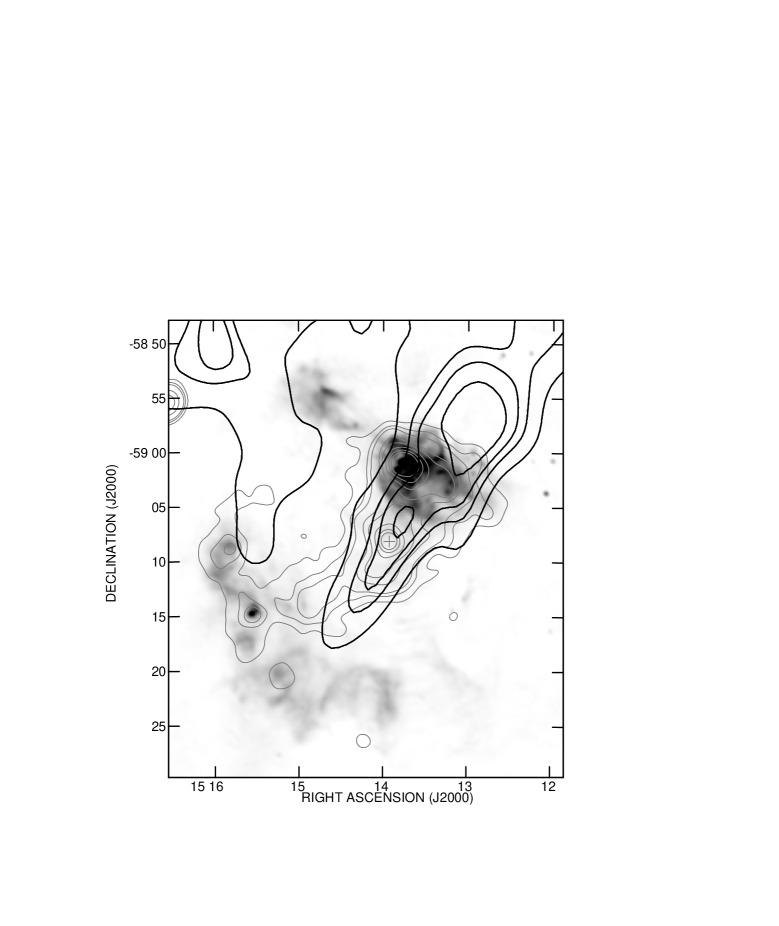
2. The bright filament perpendicular to the Galactic plane in the interval km s-1 : Figure 5 displays in detail this H i filament (thick black contours), overlaid on radio continuum (greyscale) and X-ray (light grey contours) emission from the SNR. The cross indicates the position of PSR B1509–58.
From a morphological point of view, there is a striking alignment of this H i filament with both the NW/SE axis of the X-ray nebula and the weak radio features extending south of RCW 89. ROSAT and Chandra data demonstrate that the elongated X-ray nebula represents opposed collimated outflows directed (in projection) along this NW/SE axis (Brazier & Becker (1997); Gaensler et al. (2001)). G99 argue that the radio emission in this region corresponds to a cylindrical sheath surrounding the pulsar outflow; it has been shown that the magnetic field in the region is well-ordered and oriented in a direction parallel to the axis of the proposed outflow (Milne, Caswell, & Haynes (1993); G99). It is thus conceivable that a pre-existing column of gas with an orientation similar to that of the outflow from the pulsar may have provided the conditions necessary to form a cylinder and thus generate the observed characteristics. For instance, the magnetic field could be frozen to the column of cold H i thus explaining its order and orientation. This H i feature may suggest an association with G320.4–1.2, based solely on the morphology. However, the high difference between the systemic velocity of the SNR and the H i velocity, remains unexplained. For this feature a total H i mass M M⊙ and an average atomic density n cm-3 have been estimated.
4. Conclusions
We have conducted a study of the distribution and kinematics of the interstellar neutral hydrogen in a field around the bilateral SNR G320.4–1.2. This SNR comprises the bright optical/X-ray/radio nebula RCW 89 and the energetic young pulsar B1509–58.
We find several features in H i which suggest that the radio morphology of G320.4–1.2 is a result of the distribution of the surrounding ISM, combined with the action of the pulsar’s relativistic outflows.
The N-NW bright radio limb of G320.4-1.2 shows the effects of interaction with an extended H i filament with density of 12 cm-3 present at the same velocity as that of the SNR ( km s-1 ). In addition, the interaction of the relativistic outflow from PKS B1509-58 with the denser part of this filament (n 15 cm-3) may have been responsible for the formation of the bright nebula RCW89 located on the NW extreme of G320.4-1.2. The opposite radio limb of the SNR apparently expanded into a lower density environment (n 0.4 cm-3) with little distortion from a semicircular shape.
The nature of “barrel”–shaped SNRs can be explained assuming that the SNR expands into a low density cavity with walls almost parallel, and the bright radio limbs originate where the expanding shock encounters the walls (Gaensler 1998). In the case of G320.4–1.2, the present H i study has confirmed the existence of the H i wall associated with the N–NW lobe. However, the observations are not conclusive with respect to the S–SE H i counterpart. We have identified H i structures with the location and morphology suggestive of an H i-SNR association in this direction. However, the fact that they are detected near V km s-1 , indistinguishable in practice from local gas contribution, makes the association uncertain.
Based on morphological coincidences, we suggest a physical association between the SNR and an elongated H i feature with V km s-1 , oriented perpendicular to the Galactic plane. This H i structure is strikingly aligned with the projected axis inferred for the collimated outflows generated by PSR B1509–58. It is difficult to explain the anomalous kinematical velocity of this feature; we suggest that this gas is indeed at the same distance as is G320.4–1.2, but suffers from kinematical distortions. Such perturbations in the velocity field are not unexpected in this region, rich in massive stars with powerful stellar winds that have stirred the interstellar material for thousands of years (Georgelin et al. 1987; Lortet, Georgelin & Georgelin 1987).
References
- Bisnovatyi-Kogan, Lozinskaya, & Silich (1990) Bisnovatyi-Kogan, G. S., Lozinskaya, T. A., & Silich, S. A. 1990, Ap&SS, 166, 277.
- Brazier & Becker (1997) Brazier, K. T. S. & Becker, W. 1997, MNRAS, 284, 335.
- Brighenti & D’Ercole (1994) Brighenti, F. & D’Ercole, A. 1994, MNRAS, 270, 65.
- Caswell et al. (1975) Caswell, J. L., Murray, J. D., Roger, R. S., Cole, D. J., & Cooke, D. J. 1975, A&A, 45, 239.
- DeNoyer (1977) DeNoyer, L.K., 1977, ApJ, 212, 416.
- Dubner et al. (1999) Dubner, G., Giacani, E., Reynoso, E., Goss, W. M., Roth, M., & Green, A. 1999, AJ, 118, 930.
- Dubner et al. (1996) Dubner, G. M., Giacani, E. B., Goss, W. M., Moffett, D. A., & Holdaway, M. 1996, AJ, 111, 1304.
- (8) Dubner, G. M., Green, A. J., Goss, W. M., Bock, D., C.-J., & Giacani, E. 1998a, AJ, 116, 813.
- (9) Dubner, G. M., Holdaway, M., Goss, W. M., & Mirabel, I. F. 1998b, AJ, 116, 1842.
- Fich, Blitz, & Stark (1989) Fich, M., Blitz, L., & Stark, A. A. 1989, ApJ, 342, 272.
- Frater, Brooks, & Whiteoak (1992) Frater, R. H., Brooks, J. W., & Whiteoak, J. B. 1992, J. Electr. Electron. Eng. Aust., 12, 103.
- Fulbright & Reynolds (1990) Fulbright, M. S. & Reynolds, S. P. 1990, ApJ, 357, 591.
- Gaensler (1998) Gaensler, B. M. 1998, ApJ, 493, 781.
- Gaensler et al. (2001) Gaensler, B. M., Arons, J., Kaspi, V. M., Pivovaroff, M. J., Kawai, N., & Tamura, K. 2001, ApJ, submitted.
- Gaensler et al. (1999) Gaensler, B. M., Brazier, K. T. S., Manchester, R. N., Johnston, S., & Green, A. J. 1999, MNRAS, 305, 724 (G99).
- Georgelin et al. (1987) Georgelin, Y. M., Boulesteix, J., Georgelin, Y. P., Laval, A., & Marcelin, M. 1987, A&A, 174, 257.
- Giacani et al. (2000) Giacani, E. B., Dubner, G. M., Green, A. J., Goss, W. M., & Gaensler, B. M. 2000, AJ, 119, 281.
- Kesteven & Caswell (1987) Kesteven, M. J. & Caswell, J. L. 1987, A&A, 183, 118.
- Lortet, Georgelin, & Georgelin (1987) Lortet, M. C., Georgelin, Y. P., & Georgelin, Y. M. 1987, A&A, 180, 65.
- Manchester (1987) Manchester, R. N. 1987, A&A, 171, 205.
- McClure-Griffiths et al. (2001) McClure-Griffiths, N. M., Green, A. J., Dickey, J. M., Gaensler, B. M., Green, A. J., Haynes, R. F., & Wieringa, M. H. 2001, ApJ, 551, 394.
- Milne, Caswell, & Haynes (1993) Milne, D. K., Caswell, J. L., & Haynes, R. F. 1993, MNRAS, 264, 853.
- Sault & Killeen (1999) Sault, R. J. & Killeen, N. E. B. 1999, The Miriad User’s Guide, (Sydney: Australia Telescope National Facility). (http://www.atnf.csiro.au/computing/software/miriad/).
- Sault, Staveley-Smith, & Brouw (1996) Sault, R. J., Staveley-Smith, L., & Brouw, W. N. 1996, A&AS, 120, 375.
- Stanimirović (1999) Stanimirović, S. 1999. PhD thesis, University of Western Sydney.
- Tamura et al. (1996) Tamura, K., Kawai, N., Yoshida, A., & Brinkmann, W. 1996, PASJ, 48, L33.
- Trussoni et al. (1996) Trussoni, E., Massaglia, S., Caucino, S., Brinkmann, W., & Aschenbach, B. 1996, A&A, 306, 581.
- van Langevelde & Cotton (1990) van Langevelde, H. J. & Cotton, W. D. 1990, A&A, 239, L5.
- Whiteoak & Green (1996) Whiteoak, J. B. Z. & Green, A. J. 1996, A&AS, 118, 329. (http://www.physics.usyd.edu.au/astrop/wg96cat/).
- Willingale et al. (1996) Willingale, R., West, R. G., Pye, J. P., & Stewart, G. C. 1996, MNRAS, 278, 749.