The intracluster iron distribution around 4C+55.16
Abstract
We report on the metal distribution in the intracluster medium around the radio galaxy 4C+55.16 () observed with the Chandra X-ray Observatory. The radial metallicity profile shows a dramatic change at 10 arcsec ( kpc) in radius from half solar to twice solar at inner radii. Also found was a plume-like feature located at arcsec to the south-west of the centre of the galaxy, which is mostly accounted for by a strong enhancement of iron L emission. The X-ray spectrum of the plume is characterized by the metal abundance pattern of Type Ia supernovae (SNeIa), i.e., large ratios of Fe to -elements, with the iron metallicity being unusually high at solar (90 per cent error). How the plume has been formed is not entirely clear. The inhomogeneous iron distribution suggested in this cluster provides important clues to understanding the metal enrichment process of the cluster medium.
keywords:
galaxies: clusters: individual: 4C+55.16 — galaxies: abundances — galaxies: cD — X-rays: galaxies1 introduction
The metal abundance ratio pattern is useful for understanding the origin of heavy elements in the intracluster medium (ICM) because of significantly different metal yields between Type Ia and II (plus Ib and Ic) supernovae (SNeIa and SNeII) (Renzini et al 1993). Overall, SNeII appear to play a major role in enriching the ICM, as inferred from abundance measurements based on ASCA data (Mushotzky et al 1996; Fukazawa et al 1998). On the other hand, it has been suggested that an iron metallicity gradient is present in the ICM, especially of clusters with a cooling flow. Evidence for an increasing contribution from SNeIa at inner radii, inferred from an enahancement of iron abundance relative to elements, has been reported for some clusters (Finoguenov, David & Ponman 2000; Fukazawa et al 2000; Kaastra et al 2001). However, the iron abundance generally remains significantly sub-solar and rarely exceeds 1 solar even at the metallicity peaks in nearby clusters (e.g., De Grandi & Molendi 2001).
Whereas the limited spatial resolution of the previous X-ray telescopes means that studies of a metallicity gradient in ICM are possible only for nearby clusters on a large scale, with the arcsecond resolution of Chandra X-ray Obseratory (Weisskopf et al 1996), we are now able to explore a cluster core at higher redshift in much more detail. In this Letter, we present spatially resolved high metallicity concentration in the central part of the cluster around 4C+55.16. A comprehensive study of the cluster emission will be presented elsewhere.
4C+55.16 is a compact powerful radio source residing in a large galaxy at a redshift of 0.240 (Pearson & Readhead 1981, 1988; Whyborn et al 1985; Hutchings, Johnson & Pyke 1988). Recently, luminous cluster emission (erg s-1) around the radio galaxy has been recognized through ASCA and ROSAT HRI observations (Iwasawa et al 1999). We assume H0 = 50 km s-1 Mpc-1 and q0 = 0.5 throughout this paper. The angular scale is then 4.8 kpc arcsec-1 for a redshift of 0.24.
2 observation and data reduction
4C+55.16 was observed with the Chandra X-ray Observatory on 2000 October 8. The galaxy was positioned on the ACIS-S3 detector, which was operating in Faint mode at a focal plane temperature of C. The background of the CCD chip did not show significant flare events but remained within 20 per cent fluctuation around the mean count rate most of the total 9.07 ks exposure. The data were reduced using software in CIAO 2.1.3 and the latest calibration (caldb 2.7) released in August 2001. Despite improved quality of spectral fits relative to the previous calibration, the redshift inferred from the Fe K line is , which we use in the spectral analysis but is higher than 0.240 from the optical spectroscopy of the cD galaxy (Lawrence et al 1996).
Spectral analysis was performed using XSPEC version 11. Spectral parameters obtained from the analysis are presented with the 90 per cent confidence region for one parameter of interest throughout this paper, unless stated otherwise.
3 results
3.1 X-ray morphology of cluster core
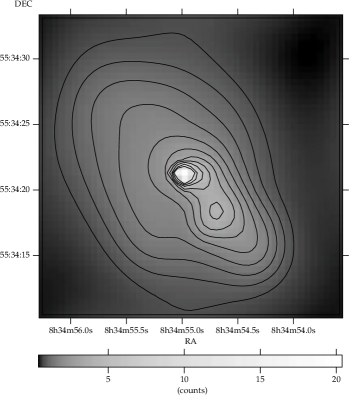
Adaptively smoothed 0.3–7 keV image of the cluster core obtained from the ACIS-S3 is shown in Fig. 1. An unresolved bright X-ray source is found at the position of the nucleus of the radio galaxy. The X-ray cluster emission is elongated along the major axis of the optical isophote of 4C+55.16 at a position angle of . A notable feature seen in the cluster core region is a plume-like X-ray excess extending by arcsec to the SW of the nucleus. There is no obvious counterpart in the optical and near-infrared images (Hutchings et al 1988; C. Crawford, priv. comm.).
3.2 Radial variation of the ICM properties


The point source at the nucleus shows a hard X-ray spectrum, which can be attributed naturally to nonthermal emission from the active nucleus (Fig. 2). A power-law fit to the spectrum yields a photon index of with no significant excess absorption above the Galactic value ( = cm-2, Dickey & Lockman 1990). The observed 0.5–2 keV and 2–7 keV fluxes of the nuclear source are erg cm-2 s-1 and erg cm-2 s-1, respectively. The rest-frame 2–10 keV luminosity is estimated to be erg s-1.
Also taken were spectra from eight annuli of radii of 1–2.5, 2.5–5, 5–9, 9–15, 15–25, 25–40, 40–60, 60–100 arcsec. The background data were taken from a region on the same detector where the cluster emission is negligible. Each spectrum was fitted by a single MEKAL model. For the metallicity measurement, we use solar abundance ratios taken from Anders & Grevesse (1989). The ACIS spectra and fitting results on temperature and metallicity are shown in Fig. 2 and Fig. 3. Excess absorption is not significant in most cases. However, it affects the temperature measurements and a few times cm-2 could still be within the calibration uncertainty. We therefore present results in Fig. 3 both for when Galactic absorption is assumed and variable excess absorption is allowed.
The temperature of the cluster gas shows a monotonic decrease towards the centre. It is noted that flattening of the temperature gradient is not seen up to 100 arcsec (480 kpc) in radius, which is rather unusual. A similarly high temperature is obtained for the outermost annulus when background is extracted from the blank sky data provided by Chandra Science Center.
The metal abundance profile shows a dramatic increase at a radius around 10 arcsec. Within this radius, the metallicity significantly exceeds solar whilst it is about half solar at the outer radii. A strong Fe L feature around 0.9 keV (in the observed frame), by which metallicity is primarily derived, is evident in the spectra from the inner three regions (see Fig. 2). Although individual spectra do not have sufficient counts in the Fe K band, the integrated spectrum within a radius of 9 arcsec (excluding the nuclear source) shows a clear strong Fe K line, supporting the high metallicity implied from the Fe L emission (Fig. 4).
3.3 Fe-L plume
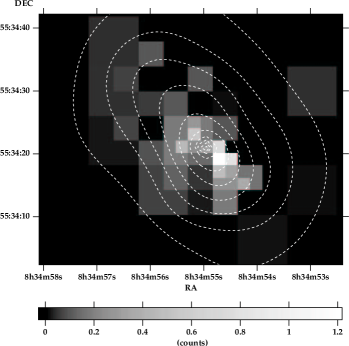
The X-ray plume located near the nucleus (see Fig. 1) is found to show particularly strong Fe L emission. The continuum-subtracted Fe L image, made from the 0.78–1.0 keV (0.95–1.25 keV in the galaxy frame) image, shows strong excess at the plume region (Fig. 5). Since the Fe L-free band (e.g., 1.8–5 keV) image shows a smooth elliptical isophoto centred on the galaxy nucleus with no particular excess at the plume, the plume feature is mostly accounted for by the excess Fe L emission. This also indicates that the ICM itself is not structured, unlike the disturbed X-ray morphology resulted from displaced ICM by radio jets seen in nearby clusters such as Hydra A (McNamara et al 2000) and Perseus cluster (Fabian et al 2000). In 4C+55.16, most of the radio emission originates from the VLBI-scale compact core and the small radio lobe, aligned approximately perpendicular to the plume, carries only small power (Whyborn et al 1985).


The spectrum of the Fe L plume (Fig. 6) is investigated. The spectral data were collected from a rectangular region of arcsec with a position angle , centred on the plume, which covers most of the SW quarter of the 1–5 arcsec annulus. We also take a spectrum from the rest of the annulus (“C-shaped region”: approximately three-quarter of the 1–5 arcsec annulus covering position angles from to to avoid the nucleus and plume), for comparison. The strong Fe L emission from the plume peaks at an energy of keV, very similar to that ( keV) of the C-shaped region spectrum, suggesting similar temperatures. Therefore the enhancement of Fe L emission seen in the plume is more consistent with a metallicity effect than the presence of cool gas.
Fitting the C-shaped region spectrum by a single MEKAL model gives a good fit with a temperature of keV and solar metallicity (Table 1).
The metallicity inferred for the C-shaped region spectrum is already unusually high for ICM. The even stronger Fe L emission seen in the plume (Fig. 7) could be a result from selective enrichment of iron, presumably by SNeIa. Since our short exposure spectrum of the plume (the integrated count is ) does not have sufficient quality for fitting emission lines from individual elements, we tried three different metal abundance patterns appropriate for a) Solar photosphere; b) SNII; and c) SNIa, in order to see which pattern reproduces the observed spectrum best. MEKAL is used for the solar abundance case, while the enrichment patterns by the two supernova types are implemented with the variable abundance version of MEKAL (VMEKAL), using the abundance ratios relative to the solar values given in Dupke & Arnaud (2001), based on the stellar yields for SNII (Nomoto et al 1997a) and for the deflagration model (W7) of SNIa (Nomoto, Thielmann & Yokoi 1984; Nomoto et al 1997b).
The results of spectral fitting are shown in Table 1. The SNeII type abundance pattern can be ruled out. The SNIa abundance pattern gives a significantly better fit over that of the solar abundance ( for 13 degrees of freedom for both fits). The SNIa abundance model gives a temperature keV, similar to the surrounding C-shaped region, and solar iron metallicity (as shown in Fig. 7, the iron metallicity exceeds 1 solar at confidence level).
More complex models, e.g., two-temperature model and cooling-flow model, are not required by the data. The inclusion of extra components may be needed, which could alter the metallicity measurements if the data quality is much better, but it would usually push the metallicity value even higher.
The model of the SNIa abundance pattern is also examined for the C-shaped region spectrum. It gives solar metallicity, but does not improve the fit over the solar abundance model, unlike for the plume spectrum (see Table 1).
| Abundance | /dof | |||
|---|---|---|---|---|
| pattern | keV | |||
| (a) Solar | 2.1 | 14.2/13 | ||
| (b) SNIa | 5.4 | 7.9/13 | ||
| (c) SNII | 3.1 | 0.7 | 7.3 | 32.7/13 |
| C-shaped | 14 | 12.2/29 | ||
| region |
4 discussion
We have found a striking increase in metallicity in the cluster core around 4C+55.16 through iron emission measurements. Metallicity increases of a lesser degree have been found earlier towards the centres of several nearby clusters (up to 0.5 solar, De Grandi & Molendi 2001). Centaurus and Virgo clusters show peak metallicity of solar (Ikebe et al 1999; Sanders & Fabian 2001) and solar (Böhringer et al 2001), respectively. Sérsic 159-03 shows an iron-rich region (0.76 solar) displaced from the centre by kpc (Kaastra et al 2001). Our results for the higher redshift cluster 4C+55.16 are more dramatic than any of these, with the cluster core being about twice solar abundance and the plume is apparently three times richer in iron. No mechanism other than a metallicity effect appears to be plausible: photoionization by the active nucleus, for instance, has a problem with orientation, i.e., the radio axis is perpendicular to the plume; and non-equilibrium ionization of the gas, which could be induced by a merger, would last for less than a million years and thus is unlikely to be observed in the absence of any optical signature of a merger.
From the temperature, metallicity, and normalization of the VMEKAL thermal spectrum obtained from the fit to the plume spectrum with the SNIa abundance pattern, and its assumed volume, kpc3, we obtain gas densities, cm-3, and gas mass, M⊙. The iron mass, M⊙, the emissivity of the gas, erg s-1 cm-3, and its cooling time, yr are derived.
The metal-enrichment of the plume region clearly needs iron-rich sources, such as SNeIa. With the iron yield per SNIa of 0.74 M⊙, SNeIa are required to produce the iron in the plume. We discuss a few possiblities for the origin of the iron-rich plume.
Frequent minor-merger events are expected in the cD galaxy. The plume could be the gas stripped from an infalling metal-rich galaxy, although iron needs to be selectively left behind. More likely is star formation taking place in the gas deposited by a merger. A short duration starburst results in a metallicity pattern of SNeIa after a significant number of SNeIa start to explode (e.g., Hamann & Ferland 1993; Yoshii, Tsujimoto & Kawara 1998). However, an immediate difficulty is the lack of excess in optical light there. The M⊙ or more of star formation for producing the required number of SNeIa should be visible in blue light. There are two other potential problems, depending on evolutionary models of SNIa progenitors. Firstly, even if the progenitors were formed in a clump, they would have moved in the galactic potential and phase mixed within a timescale of order a few times the crossing time of the plume yr (its size, 14 kpc divided by the orbital velocity of say 300 km s-1). This is consistent only with the lifetime of currently disfavoured doubly-degenerate (DD) progenitors (Tutukov & Yungelson 1994) and single degenerate (SD) with a large mass (up to 8M⊙) secondary star (Matteucci 1994), and not with that of SD binaries with a smaller mass secondary star (SNeIa only start to explode after 0.5 Gyr for an elliptical, Kobayashi et al 2000). Secondly, the time scale of SNeIa enrichment must match the short cooling time of the gas. For an elliptical galaxy with L⊙ like 4C+55.16, the peak SNIa rate, which lasts for less than 1 Gyr, is expected to be 0.1–1.5 SNeIa yr-1 (Kobayashi et al 2000; Matteucci 1994). With this range of SN rate, it takes 0.2–3 Gyr to produce SNeIa, hence the iron mass in the plume. Thus the cooling time of the plume requires a SN rate at the higher end of the expected range to be matched by the iron enrichment time scale. It should also be noted that a similar amount of iron is contained outside the plume within the central 25 kpc.
An alternative possibility is that the plume has been ejected from the centre of the galaxy. Gas enriched by SNeIa may be retained within the steep cluster potential until ejection takes place. However, in order for the gas not to cool and then drop out, some form of heating to combat the radiative cooling is required. SN heating can only partially offset the cooling; the thermal energy in the plume is erg, which is equivalent to the total energy from the required SNeIa, assuming erg per SN and no SN energy is radiated. Using the cooling time as a guide, the projected distance of 14 kpc between the plume peak and the centre of the galaxy requires the ejected gas clump to travel at a velocity of km s-1. Since no sign of a temperature rise in the ICM due to a shock is seen, the motion of the galaxy must be subsonic, i.e., the velocity should be less than the sound speed of km s-1 for the 3 keV intracluster gas. At a velocity in a range of 100–600 km s-1 and the ICM density of cm-3, whether ram pressure stripping works effectively is not trivial. Although a dynamical study of the cluster is required to be conclusive, from an inspection of the X-ray and radio images, the cD galaxy appears to be lying at the centre of the cluster potential and the radio lobe which perpendicular to the plume does not show any sign of the radio-emitting plasma being swept back, indicating no evidence for fast motion of the cD galaxy (at least on the plane of the sky). One last possiblity is that the metal-rich plume is a fossil from when the cluster core was hotter. This requires that mixing of metals with surrounding gas is suppressed, much as conduction is reduced (e.g., Vikhlinin et al 2001; Ettori & Fabian 2000)
In summary, the high iron metallicity found in the plume region is unusual when compared with well-studied nearby clusters. Although the amount of iron could be supplied by SNeIa within the central galaxy, how it accumulated is not clear.
Acknowledgements
We thank all the members of the Chandra team. The adaptive binning software was provided by Jeremy Sanders. The Royal Society (ACF,SE,SWA) and PPARC (KI) are thanked for support.
References
- [1] Anders E., Grevesse N., 1989, Geochim. Cosmochim. Acta, 53, 197
- [2] Böhringer H., et al, 2001, A&A, 365, L181
- [3] De Grandi S., Molendi S., 2001, ApJ, 551, 153
- [4] Dickey J.M., Lockman F.J., 1990, ARAA, 28, 215
- [5] Dupke R.A., Arnaud K.A., 2001, ApJ, 548, 141
- [6] Ettori S., Fabian A.C., 2000, MNRAS, 317, L57
- [7] Fabian A.C., et al, 2000, MNRAS, 318, L65
- [8] Finoguenov A., David L.P., Ponman T.J., 2000, MNRAS, 544, 188
- [9] Fukazawa Y., Makishima K., Tamura T., Ezawa H., Xu H., Ikebe Y., Kikuchi K., Ohashi T., 1998, PASJ, 50, 187
- [10] Fukazawa Y., Makishima K., Tamura T., Nakazawa K., Ezawa H., Ikebe Y., Kikuchi K., Ohashi T., 2000, MNRAS, 313, 21
- [11] Hamann F., Ferland G., 1993, ApJ, 418, 11
- [12] Hutchings J.B., Johnson I., Pyke R., 1988, ApJS, 66, 361
- [13] Ikebe Y., Makishima K., Fukazawa Y., Tamura T., Xu H., Ohashi T., 1999, ApJ, 525, 58
- [14] Iwasawa K., Allen S.W., Fabian A.C., Edge A.C., Ettori S., 1999, MNRAS, 306, 467
- [15] Kaastra J.S.,Ferrigno C., Tamura T., Paerels F.B.S., Peterson J.R., Mittaz J.P.D., 2001, A&A., 365. L99
- [16] Kobayashi C., Tsujimoto T., Nomoto K., 2000, ApJ, 539, 26
- [17] Lawrence C.R., Zucker J.R., Readhead A.C.S., Unwin S.C., Pearson T.J., Xu W., 1996, ApJS, 107, 541
- [18] Matteucci F., 1994, A&A, 288, 57
- [19] McNamara B., R., et al, 2000, ApJ, 534, L135
- [20] Mushotzky R., Loewenstein M., Arnaud K.A., Tamura T., Fukazawa Y., Matsushita K. Kikuchi K., Hatsukade I., 1996, ApJ, 466, 686
- [21] Nomoto K., Thielmann F.-K., Yokoi K., 1984, ApJ, 286, 644
- [22] Nomoto K., Hashimoto M., Tsujimoto T., Thielemann F.-K., Kishimoto K., Kubo Y., 1997a, Nucl. Phys. A, 616, 79
- [23] Nomoto K., Iwamoto K., Nagasato N., Thielemann F.-K., Brachwitz F., Tsujimoto T., Kubo Y., Kishimoto N., 1997b, Nucl. Phys. A, 621. 467
- [24] Pearson T.J., Readhead A.C.S., 1981, ApJ, 248, 61
- [25] Pearson T.J., Readhead A.C.S., 1988, ApJ, 328, 114
- [26] Renzini A., Luca C., D’Ercole A., Pellegrini S., 1993, ApJ, 419, 52
- [27] Sanders J.S., Fabian A.C., 2001, MNRAS, submitted
- [28] Tutukov A.V., Yungelson L.R., 1994, MNRAS, 268, 871
- [29] Vikhlinin A., Markevitch M., Murray S.S., 2001, ApJ, 551, 160
- [30] Weisskopf M.C., O’Dell S.L., van Speybroeck L., 1996, Proc. SPIE, 2805, 2
- [31] Whyborn N.D., Browne I.W.A., Wilkinson P.N., Porcas R.W., Spinrad H., 1985, MNRAS, 214, 55
- [32] Yoshii Y., Tsujimoto T., Kawara K., 1998, ApJ, 507, L113