Observatoire Midi-Pyrénées, 14 avenue E. Belin, 31400 Toulouse, Observatoire Midi-Pyrénées, 57 avenue d’Azereix - BP 826 - 65008 Tarbes Cedex Institut Universitaire de France Lund Observatory, Box 43, 22100 Lund, Sweden C.R.A.L, École Normale Supérieure, 69364 Lyon, France Theoretical Astrophysics Center and Astronomical Observatory/NBIfAFG, Juliane Maries Vej 30, DK-2100 Copenhagen, Denmark Michigan State university, East Lansing, MI 48824, USA \PACSes\PACSit96.60.MzPhotosphere, granulation \PACSit92.60Convection, turbulence, diffusion
A simulation of solar convection at supergranulation scale
Abstract
We present here numerical simulations of surface solar convection which cover a box of 30303.2 Mm3 with a resolution of 31531582, which is used to investigate the dynamics of scales larger than granulation. No structure resembling supergranulation is present; possibly higher Reynolds numbers (i.e. higher numerical resolution), or magnetic fields, or greater depth are necessary. The results also show interesting aspects of granular dynamics which are briefly presented, like extensive p-mode ridges in the k- diagram and a ringlike distribution of horizontal vorticity around granules. At large scales, the horizontal velocity is much larger than the vertical velocity and the vertical motion is dominated by p-mode oscillations.
1 Introduction
The classical mechanism invoked to explain the origin of supergranulation is the latent heat of the conversion of He2+ into He+ at km below the sun surface. In a fluid at rest, such a heat release (or absorption) may indeed trigger an instability which can develop into motions at scales comparable to the supergranulation scale. However, this reasoning might be oversimplified since the solar plasma is highly turbulent and the above instability may be suppressed by the high diffusion of turbulent motions. It may well be that supergranulation is a surface phenomenon which results from a large-scale instability of a collection of granules Rieutord et al. (2000). Such an instability is a consequence of nonlinear interactions between granules; large-scale perturbations feel the effect of granulation as diffusion, namely turbulent viscosity. But as shown by Gama et al. (1994), this viscosity may be negative which thus triggers a large-scale instability. In the same vein, the very existence of mesogranulation as a distinct scale of convection has been questioned several times Straus & Bonaccini (1997); Rieutord et al. (2000); Hathaway et al. (2000), casting doubts on the importance of the first ionization of Helium in convection. Another possibility is that supergranulation reflects the larger size of convective upflows with increasing scale height at greater depths.
These remarks show that the dynamics of scales larger than the granulation are still largely not understood while they certainly play an important role in the solar magnetism as shown by the interaction between supergranulation and network.
In order to progress on these questions, we performed a numerical simulation of compressible convection with radiative transport which has a horizontal extent as wide as computationally affordable in order to accommodate as large as a supergranule. The domain is, however, rather shallow having an aspect ratio of . In the following we present some preliminary results of the simulation with emphasis on the dynamics of scales larger than granulation.
2 The simulation
We simulate convection on a range of horizontal scales using a radiation-hydrodynamics code developed by two of the authors (Nordlund and Stein). A description of the code can be found in Stein & Nordlund (1998). Briefly, the code solves the equations of hydrodynamics (mass, momentum, and energy conservation) together with the equation of radiative transfer for a compressible, viscous medium. The viscosity employed is an artificial hyperviscosity which stabilizes the numerical scheme; our simulation falls into the class of LES (Large Eddy Simulation). Our aim is to simulate flows on granular and larger scales. To this end certain trade-offs have been made between physical realism and computational demands: the radiative transfer is treated in the grey approximation and the horizontal resolution is a rather coarse 95 km. These restrictions made it affordable to study a large volume representing a part of the solar surface layers. The computational domain covers horizontally, and it extends vertically from about above to a depth of below this level. The computational grid comprises nodes in each horizontal plane and 82 nodes in the vertical direction. The lateral boundaries of the computational domain are periodic. The upper boundary allows the transmission of acoustic waves. The lower boundary allows a free in- and outflow of mass with the constraint of a vanishing net mass flux across the boundary, and constrains the horizontal velocity in inflows according to , where is half the minimum advection time across the bottom zone. The entropy of inflowing material is prescribed; this entropy together with the gravitational acceleration and chemical composition are the basic control parameters of the simulation. Note, unlike a standard stellar atmosphere code, the effective temperature of the model is an outcome of the computation. It can be adjusted by changing the entropy of the inflowing material.


The radiative transfer is treated in strict LTE adopting grey opacities which include contributions of spectral lines and are dependent on pressure and temperature. The non-locality of the radiation field together with the geometry of the flow is taken into account by solving the transfer equation at each time step employing a modified Feautrier technique along a large number (here about 500,000) of representative directions (“rays”, long characteristics) traversing the computational domain. The equation of state takes into account the ionization of hydrogen, helium, and other abundant elements as well the formation of the molecule. Opacities and the equation of state are derived from data of the Uppsala stellar atmosphere package Gustafsson et al. (1975).

The large scale model was set up by tiling the plane with 55 identical smaller scale models. Due to the periodic boundary conditions this results in a flow field which is a valid solution of the governing equations. The horizontal symmetry of the initial configuration was broken by adding a small arbitrary velocity disturbance. We simulated almost 7 hours of solar time from which about the last 5 hours are sufficiently evolved that the memory of the initial symmetry — as illustrated by figure 2 — is lost and no longer plays a role in the granular dynamics. This took 18,000 CPU hours on a SGI Origin 2000 system (running 6 processors in parallel). The flow field was sampled every 20 s (solar time) producing a total of 110 Gb of numerical data.
3 Preliminary results
In Fig. 1 we compare the mean temperature and velocity profile of the present simulation to one from a run with twice the resolution but smaller horizontal extent. The temperature structure shows some differences around (roughly corresponding to unity optical depth) and the higher atmospheric layers. The differences stem from the different treatment of the radiative transfer which is grey in the present case as opposed to frequency-dependent in the more resolved run. The ATLAS9 static model atmosphere shows temperature deviations of similar order. Since we are here not aiming at the best possible representation of the actual solar temperature structure we consider the correspondence satisfactory. The same holds for the velocity profiles in Fig. 1 which show some increase of the velocity fluctuations with resolution, in particular around the velocity maximum, an effect expected from previous experience (see Stein & Nordlund (1998)).
In figure 2, we plot the amplitude spectra (, E(k) being the spectral density of velocity square) of horizontal and vertical velocities near the level. Initially there was no power present at scales larger than 6 Mm (k=1 – 5). The time-averaged power spectrum shows three interesting features: First, there is no equivalent of solar supergranulation. This may be explained by many factors: the box is too shallow, magnetic field is missing, resolution, i.e. the Reynolds number, is too low or the length of the run is too short for supergranulation to have developed. Second, the horizontal velocities are mainly dominated by scales roughly twice larger than those dominating vertical velocities. This seems to be related to the presence of strong downdrafts. Third, the spectrum for horizontal motion shows a break at 5Mm. The origin of this break needs further investigation.

Besides the question of the formation of large scale structures, the simulation offers interesting “side products”. For instance, since the size of the domain is large enough to contain many hundreds of granules, it was possible to test and assess the relevance of granule tracking techniques (see November & Simon, 1988; Roudier et al., 1999) as a method for measuring plasma horizontal velocities at scale larger than 3 Mm (see Rieutord et al., 2001).
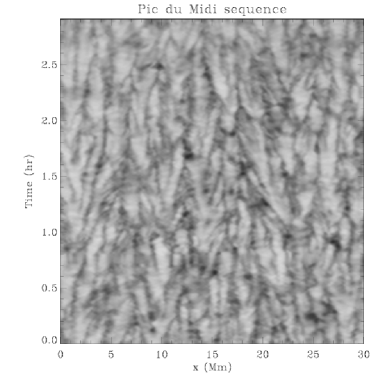
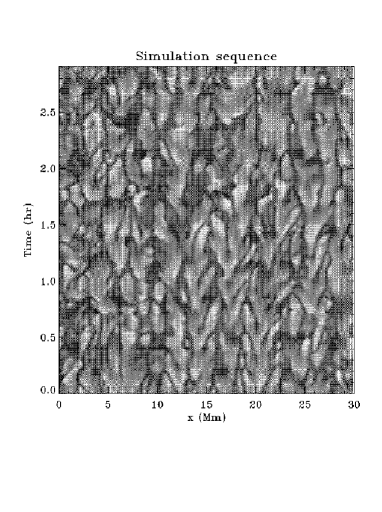
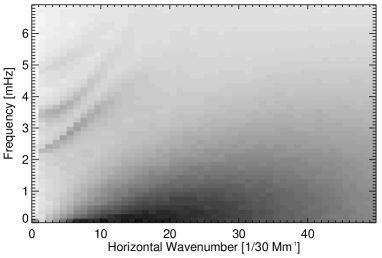
In figure 3 we computed a time-distance view of granulation; such plots show that some granular features persist on timescales of one hour or even more; such a behavior is also visible in observational data and strengthens the confidence that the basic dynamical properties of granulation are captured within the simulation. Another interesting dynamical feature is shown by the k– diagram which reveals the acoustic modes excited by convection in the box (see figure 4). Despite its “fuzzy” appearance one should appreciate that it is perhaps the richest k– diagram ever computed from a realistic convection simulation including radiative transfer.
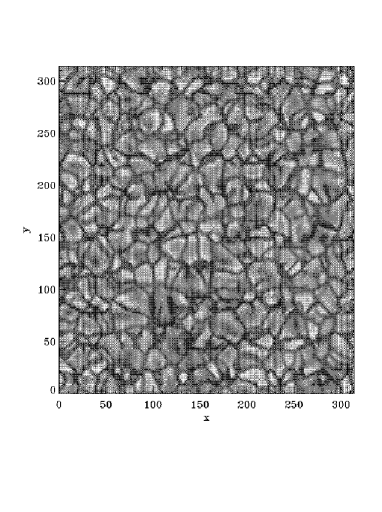
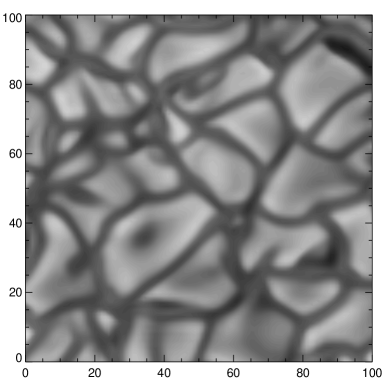
Finally, we plotted in figure 5 a small field of view centered on what we interpret to be an “exploding granule” (see Nordlund, 1985 for an explanation of “exploding granules”); of course such an event is much smoother in the simulation than in the real sun. We associate with this picture a plot of the horizontal vorticity at the level (figure 5). This shows that granules are surrounded by a ring of vorticity where the upflows turn over into the intergranular lanes. This is the basis of the vortex ring model of granules (Parker (1992) and Arendt (1993, 1994)). Higher resolution simulations show that these vortex rings become turbulent and consist of tangled smaller vertex tubes Stein & Nordlund (1998). One can assemble such vortex rings and then analyse the large-scale perturbations of such an assembly and determine whether or not they are unstable. Results along these lines of research will be presented in future work.
Acknowledgements.
Calculations were carried out on the CalMip machine of the ‘Centre Interuniversitaire de Calcul de Toulouse’ (CICT) which is gratefully acknowledged. R.F. Stein acknowledges financial support by NASA grant NAG 5-9563 and NSF AST grant 98-19799.References
- Arendt (1993) Arendt, S. 1993, Geophys. Astrophys. Fluid Dyn., 70, 161
- Arendt (1994) —. 1994, Astrophys. J., 422, 862
- Gama et al. (1994) Gama, S., Vergassola, M., & Frisch, U. 1994, J. Fluid Mech., 260, 95
- Gustafsson et al. (1975) Gustafsson, B., Bell, R. A., Eriksson, K., & Nordlund, A. 1975, A. & A., 42, 407
- Hathaway et al. (2000) Hathaway, D., Beck, J., Bogart, R., Bachmann, K., Khtri, G., Petitto, J., Han, S., & Raymond, J. 2000, Solar Phys., 193, 299
- November & Simon (1988) November, L. J. & Simon, G. W. 1988, Astrophys. J., 333, 427
- Parker (1992) Parker, E. N. 1992, Astrophys. J., 390, 290
- Rieutord et al. (2001) Rieutord, M., Roudier, T., Ludwig, H.-G., Nordlund, Å., & Stein, R. 2001, A. & A., 377, L14
- Rieutord et al. (2000) Rieutord, M., Roudier, T., Malherbe, J. M., & Rincon, F. 2000, A. & A., 357, 1063
- Roudier et al. (1999) Roudier, T., Rieutord, M., Malherbe, J., & Vigneau, J. 1999, A. & A., 349, 301
- Stein & Nordlund (1998) Stein, R. F. & Nordlund, Å. 1998, Astrophys. J., 499, 914
- Straus & Bonaccini (1997) Straus, T. & Bonaccini, D. 1997, A. & A., 324, 704