L1521E: A Starless Core in the Early Evolutionary Stage ?
Abstract
We have studied the physical and chemical properties of a quiescent starless core L1521E with various molecular lines. It is found that there exists a compact dense core traced by the H13CO+, HN13C, CCS, and HC3N lines; their distributions have a single peak at the same position. The core radius is as small as 0.031 pc, whereas the H2 density at the peak position is as high as (1.3-5.6)105 cm-3. Although the density is high enough to excite the inversion transitions of NH3, these lines are found to be very faint in L1521E. The distributions of NH3 and CCS seem to be different from those of well-studied starless cores, L1498 and L1544, where the distribution of CCS shows a shell-like structure while that of NH3 is concentrated at the center of the core. Abundances of carbon-chain molecules are higher in L1521E than the other dark cloud cores, and especially those of sulfur-bearing molecules CnS are comparable to the cyanopolyyne peak of TMC-1. Our results suggest that L1521E would be in a very early stage of physical and chemical evolution.
1 Introduction
On the basis of observations in various wavelength regions from radio to X-ray as well as theoretical considerations and simulations, it has been well established that dense cores in dark clouds are formation sites of low-mass stars. Because dense cores have low kinetic temperature (10 K) and high H2 density ( cm-3), they have been observed mainly with molecular lines. Especially, extensive survey observations of NH3 by Myers and his collaborators have greatly contributed to understanding of the physical property of dark cloud cores (e.g. Benson & Myers 1989). They found that 68 % of the dense cores observed by the NH3 lines (”NH3 cores”) accompany the IRAS sources, which are newly born stars in the cores (Benson & Myers 1989; Beichman et al. 1986). Therefore, it has been recognized that the NH3 lines are useful to study the physical properties of star-forming dense cores in dark clouds.
On the other hand, Suzuki et al. (1992) pointed out that NH3 is not always a good tracer of dense cores because of the chemical abundance variation from core to core. They carried out survey observations of CCS, HC3N, HC5N, and NH3 toward 49 dense cores and found that the spectra of carbon-chain molecules tend to be intense in starless cores, while those of NH3 tend to be intense in star forming cores. Especially, Suzuki et al. (1992) identified a few cores where the lines of carbon-chain molecules are intense while the NH3 lines are hardly detected, which are called ”carbon-chain-producing regions”. They are L1495B, L1521B, L1521E, and the cyanopolyyne peak of TMC-1. Recently, Hirota, Ikeda, & Yamamoto (2001) reported that the deuterium fractionation ratios of DNC/HNC and DCO+/HCO+ are significantly smaller in carbon-chain-producing regions than in the others. These systematic variation would reflect the difference in chemical evolutionary stages of the cores; carbon-chain molecules and NH3 are abundant in relatively early and late stages, respectively (Suzuki et al. 1992) and deuterium fractionation ratios increase as the core evolves (Hirota et al. 2001; Saito et al. 2000).
Although the dense cores identified by the NH3 lines have extensively been observed with various molecular lines, no systematic study has been carried out for the carbon-chain-producing regions except for TMC-1 (e.g. Olano, Walmsley, & Wilson 1988; Hirahara et al. 1992; Pratap et al. 1997). Detailed studies on the other carbon-chain-producing regions would be essential for understanding of chemical and physical evolution of dense cores. Among them, L1521E in the Taurus dark cloud complex (d=140 pc) is the most interesting source. It gives strong C34S and CCS lines, whereas only weak NH3 line has been detected so far. Particularly the C34S emission is brightest among dense cores in our previous survey (Hirota et al. 1998). In this paper, we report the first comprehensive characterization of the chemical and physical properties of L1521E.
2 Observations
The observed lines are summarized in Table 1. We took the reference position of L1521E to be ()= (07′17″), where the spectra of H13CO+, HN13C, CCS, and HC3N are found to be most intense. In the previous papers (e.g. Myers, Linke, & Benson 1983), several molecular lines were observed at the position which is 30″ north from our reference position.
The 45 GHz and 76-93 GHz lines were observed with the 45 m radio telescope at Nobeyama Radio Observatory (NRO)111Nobeyama Radio Observatory is a branch of the National Astronomical Observatory of Japan, an interuniversity research institute operated by the Ministry of Education, Science, Sports and Culture of Japan in several observing sessions from 1990 to 2000. All of them were observed with SIS mixer receivers whose system temperatures were about 200-500 K. The main-beam efficiencies () were 0.7 and 0.5 for the 45 GHz and 76-93 GHz regions, respectively, and the beam sizes were 37″ and 20-17″ for the 45 GHz and 76-93 GHz regions, respectively. Acousto-optical radio spectrometers with the frequency resolution of 37 kHz were used for the backend. Pointing was checked by observing a nearby SiO maser source, NML-Tau, every 1-2 hours, and the pointing accuracy was estimated to be better than 5″. All the observations were performed with the position-switching mode, in which a typical off position was 10′ away from the source position.
The 19-23 GHz lines were observed with the Effelsberg 100 m radio telescope of Max-Planck-Institut für Radioastronomie in 2000 May. We used cooled HEMT receivers, whose system temperatures were about 30 K. The digital autocorrelators with the frequency resolution of 10 kHz were used for the backend. For pointing and intensity calibrations, we observed 3C123 every 1-2 hours. We adopted a flux density of 3C123 to be 3.12 Jy at 23780 MHz (Ott et al. 1994). Observations were carried out with the frequency switching mode, in which the offset frequency was set to be 0.2 MHz.
The lines of DNC and HN13C were observed with the NRAO 12 m telescope222The National Radio Astronomy Observatory is a facility of the National Science Foundation, operated under cooperative agreement by Associated Universities, Inc. at Kitt Peak in 1999 December. We used two SIS mixer receivers and observed the DNC and HN13C lines simultaneously. The system temperature was about 400 K. The main-beam efficiency is derived from the observations of planets to be 0.7 for both lines. The hybrid spectrometers with the frequency resolution of 48.8 kHz were used for the backend. We employed the position-switching mode as in the observations with the NRO 45 m telescope.
3 Dense Core in L1521E
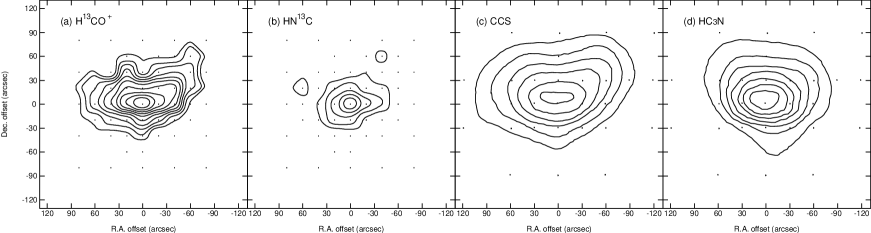
Figure 1 shows the integrated intensity maps of H13CO+, HN13C, CCS, and HC3N in L1521E. It is clearly found that there exists a compact dense core traced by these lines, which has a single peak at the reference position with a structure elongated toward the east-west direction. The shape and peak position of these maps are similar to each other except for the slight difference in size, partly due to the difference in their critical density. There are neither signs of complex density variations nor of molecular abundance variations as seen in TMC-1 (Hirahara et al. 1992, Pratap et al. 1997). The core size is derived to be 0.09 pc0.04 pc from the two dimensional Gaussian fitting of the integrated intensity map of H13CO+. The peak position of these lines is close to that of the C18O line (Zhou et al. 1994), while the shape of the C18O distribution is different from the above maps probably due to the lower critical density of C18O.
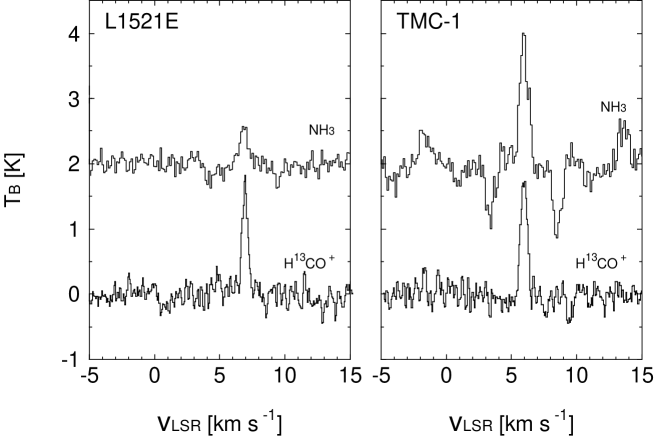
Figure 2 shows the spectra of NH3 (=1,1) and H13CO+(=1-0) observed toward the reference position. The peak brightness temperature of the H13CO+ line is similar to those observed toward TMC-1 and other dense cores (Mizuno et al. 1994). In order to evaluate the H2 density, we carried out the statistical equilibrium calculation based on the LVG model (Goldreich & Kwan 1974) for DNC and HN13C. The H2 density derived from the =1-0 and =2-1 lines of DNC is 4.5 cm-3, which is consistent with the density derived from the =1-0 and =2-1 lines of HN13C (5.6 cm-3). These values are close to that derived from =1-0 and =2-1 lines of C34S (1.3 cm-3; Hirota et al. 1998). The H2 density of L1521E is comparable to those in other dense cores ( e.g. Benson & Myers 1989; Hirota et al. 1998).
Although the H2 density is high enough to excite the inversion line of NH3(=1,1), it is found to be very faint toward the reference position of L1521E, as shown in Figure 2. Since the distribution of NH3 is sometimes different from other molecules, we carried out the mapping observation of the NH3 line toward the 4′4′ region centered at the reference position with spatial resolution of 40″. However, the NH3 emission is generally weak over the entire core, and there is no other position where the NH3 line is more intense than in the reference position. The distributions of CCS and NH3 in L1521E seem to be different from those of the other starless cores previously observed, such as L1498 (Kuiper, Langer, & Velusamy 1996) and L1544 (Ohashi et al. 1999; Benson & Myers 1989). In these cores, the distribution of CCS shows a shell-like structure, while that of NH3 is concentrated at the central position. Such distributions can be interpreted qualitatively in terms of the chemical evolution; CCS tends to be depleted at the center of chemically evolved cores, whereas NH3 becomes abundant there (Suzuki et al. 1992; Bergin & Langer 1997). In contrast to L1498 and L1544, CCS is not depleted at the center of the core in L1521E, and NH3 is less abundant there. Therefore, L1521E would be in the very early stage of its chemical evolution.
It is notable that the core radius of L1521E, 0.031 pc, is significantly smaller than those of the other starless H13CO+ cores, 0.049-0.129 pc, and is rather comparable to those of the star-forming cores, 0.026-0.033 pc (Mizuno et al. 1994). Mizuno et al. (1994) interpreted this systematic difference in terms of the physical evolution of dense cores; star-forming cores are gravitationally more contracted than starless cores, and hence, the size of a dense part traced by the H13CO+ line would decrease from starless cores to star-forming cores. However, the L1521E core is apparently an exception to this scenario, because it is undoubtedly a starless core in spite of its small size; there are no IRAS point sources associated with L1521E. Furthermore, the submillimeter continuum emission and the evidence of molecular outflows have never been reported for L1521E. According to Lee, Myers, & Tafalla (1999), the asymmetric line profile of CS(=2-1) indicating the infalling motion has not been detected toward the L1521E core. Considering the absence of intense NH3 emissions, it is rather likely that L1521E is in a very early stage of physical evolution; the small size would indicate that L1521E is less evolved than the other starless cores, and hence, the high density region is still compact.
The total mass of the H13CO+ core of L1521E is evaluated to be 2.4 assuming the peak density and the core radius of 3105 cm-3 and 0.031 pc, respectively. The mass of the starless NH3 core ranges from 0.33 to 83 (Benson & Myers 1989), and hence, the mass of L1521E corresponds to the lower end of the above range. This is consistent with the above result that L1521E is a still growing core. The virial mass of the H13CO+ core of L1521E is evaluated to be 2.8 assuming the kinetic temperature of 10 K, which indicates that the core of L1521E would be gravitationally bound. In the maps of the CCS and H13CO+ lines, significant velocity gradient of 2 km s-1 pc-1 is observed along the major axis; the velocity increases from east to west. If this gradient is ascribed to the rotation about the minor axis, the mass supported by centrifugal force is estimated to be only 0.05 . Therefore, the centrifugal force may contribute to cloud support only partly, as in the case of the NH3 cores (Goodman et al. 1993).
4 Molecular Abundances
We derived the abundances of various molecules toward the reference position. For this purpose, the line parameters for all the observed lines were determined by the Gaussian fit, as summarized in Table 1. We ignored the unresolved hyperfine structures of the NH3, HC3N, DNC, and HN13C lines, and hence, their linewidths are broader than the others. In addition to the intense spectra of CCS and HC3N, the longer carbon-chain molecules such as C3S, C4H, and HC5N are also detected at the reference position as shown in Figure 3. Therefore L1521E seems to be rich in carbon-chain molecules, as Suzuki et al. (1992) suggested.
We calculated the column densities of observed molecules at the reference position of L1521E by the same method employed in Hirahara et al. (1992) and Suzuki et al. (1992) in order to compare the present results with those for the other dark cloud cores. We assumed the LTE condition with the excitation temperatures of 6.5 K for NH3, HC3N, and HC5N, 6.0 K for C4H, and 5.5 K for C3S, because only a single line was observed each for these species. For NH3, all the ortho and para levels were assumed to be thermalized at the kinetic temperature of 10 K. On the other hand, we carried out the LVG calculations for DNC and HN13C. The column densities of DNC and HN13C are derived by using the =1-0 and =2-1 transitions in the present study, and hence, they are reduced by a factor of 2-3 from those reported by Hirota et al. (2001), where the column density was determined only from the =1-0 line with the assumption of the H2 density of 1.3 cm-3. The derived column densities are summarized in Table L1521E: A Starless Core in the Early Evolutionary Stage ? along with those of several molecules reported previously.
It is important to estimate the optical depths of the observed lines, particularly for the NH3 (1, 1) line. However, only the main hyperfine component was detected for the NH3 (1, 1) line, so that we cannot determine the optical depth from the intensity ratio of the hyperfine components. Only the upper limit to the optical depth of the main hyperfine component can be estimated from the upper limit to the intensity of the strongest satellite component (i.e. three times the rms noise) to be 4.0. However the upper limit of the excitation temperature is evaluated as low as 3.3 K in this case. This excitation temperature is significantly lower than those reported for other dark cloud cores (4.5-7.5 K; Suzuki et al. 1992). Since the H2 density of L1521E ((1.3-5.6) cm-3) is enough high to excite the NH3 (1, 1) line, the excitation temperature less than 3.3 K is unrealistic. When we assume the excitation temperature range from 4.5 K to 7.5 K observed toward other dark cloud cores, the column density determined ranges from 11.1 cm-2 to 6.7 cm-2, whereas the optical depth ranges from 0.39 to 0.13. Therefore, the reason why the NH3 lines are hardly detected can be ascribed to the low column density.
In order to evaluate the fractional abundances of the observed molecules relative to H2, we usually derive the column density of H2 from that of C18O because the fractional abundance of CO and its isotopic species relative to H2 are well determined (Frerking, Langer, & Wilson 1982). However, the distribution of C18O in L1521E seems to be different from those of the other molecular lines as discussed above (Zhou et al. 1994) and hence, it is possible that the gas traced by the C18O line is not the same as those traced by the observed lines of the other species whose critical densities are higher than that of C18O. Pratap et al. (1997) suggested this point in their detailed study on TMC-1, and proposed to calculate the fractional abundances relative to HCO+. Therefore, we also follow their analysis and compared the fractional abundances relative to H13CO+ between L1521E and TMC-1.
The column densities of carbon-chain molecules toward L1521E are significantly higher than the typical NH3 cores (Suzuki et al. 1992). Although the uncertainty of the calculated column densities are estimated to be a factor of a few mainly due to the assumed excitation temperature, the fractional abundances of C34S, CCS, and C3S relative to H13CO+ in L1521E are comparable to or higher than those of TMC-1, whereas those of longer carbon-chain molecules such as C4H, HC3N, and HC5N are lower by an order of magnitude. On the other hand, the column density of NH3 in L1521E is 7.3 cm-2 which is apparently smaller by a factor of 10 than those in the typical NH3 cores (Benson & Myers 1989; Suzuki et al. 1992). In relation to this, we also found that the N2H+ line was not detected with the rms noise level of 0.2 K in L1521E, although it has been employed as a good tracer of dense cores (Lee et al. 1999). The upper limit of the column density of N2H+ is calculated by assuming the LTE condition with the excitation temperature of 5.0 K (Benson, Caselli, & Myers 1998) and the FWHM linewidth of 0.5 km s-1. We found that the fractional abundance of N2H+ relative to H13CO+ is at least smaller by a factor of 4 than that in the cyanopolyyne peak of TMC-1 (Hirahara et al. 1995), and hence, N2H+ would also be exceptionally deficient in L1521E.
These characteristic features on molecular abundances seem to be understood as follows. Relatively high abundances of CnS in comparison with TMC-1 may indicate that the gas-phase abundance of the sulfur atom might be higher in L1521E than in TMC-1 and other dense cores. One possible reason is that the heavy atoms are not so depleted in L1521E. This could be possible if the L1521E core is in the very early phase of its physical evolution (Bergin & Langer 1997). In this case, the ionization degree would be enhanced, which gives an unfavorable condition for production of HC3N and HC5N, because the insertion reactions of the nitrogen atom to hydrocarbon ions compete with the electron recombination reactions. Furthermore the high degree of ionization provides an additional unfavorable situation for deuterium fractionation, which is consistent with the extremely low DNC/HNC and DCO+/HCO+ ratios observed in L1521E (Hirota et al. 2001). The low abundances of NH3 and N2H+ directly indicate the young age of the L1521E core, since these species are only abundant in the late stage of chemical evolution.
According to the physical properties and chemical abundances, L1521E could be a novel example of a very young core. Further detailed observations of this and similar cores would be of particular importance for understanding the initial phase of star formation processes.
References
- B (86) Beichman, C. A., Myers, P. C., Emerson, J. P., Harris, S., Mathieu, R., Benson, P. J., & Jennings, R. E. 1986, ApJ, 307, 337
- B (98) Benson, P. J., Caselli, P., & Myers, P. C. 1998, ApJ, 506, 743
- B (89) Benson, P. J., & Myers, P. C. 1989, ApJS, 71, 89
- B (97) Bergin, E. A. & Langer, W. D. 1997, ApJ, 486, 316
- F (82) Frerking, M. A., Langer, W. D., & Wilson, R. W. 1982, ApJ, 262, 590
- G (74) Goldreich, P., & Kwan, J. 1974, ApJ, 189, 441
- G (93) Goodman, A. A., Benson, P. J., Fuller, G. A., & Myers, P. C. 1993, ApJ, 406, 528
- H (92) Hirahara, Y., et al. 1992, ApJ, 394, 539
- H (95) Hirahara, Y., et al. 1995, PASJ, 47, 845
- H (98) Hirota, T., Yamamoto, S., Mikami, H., & Ohishi, M. 1998, ApJ, 503, 717
- H (01) Hirota, T., Ikeda, M., & Yamamoto, S. 2001, ApJ, 547, 814
- K (96) Kuiper, T. B. H., Langer, W. D., & Velusamy, T. 1996, ApJ, 468, 761
- L (99) Lee, C. W., Myers, P. C., & Tafalla, M. 1999, ApJ, 526, 788
- M (94) Mizuno, A., Onishi, T., Hayashi, M., Ohashi, N., Sunada, K., Hasegawa, T., & Fukui, Y. 1994, Nature, 368, 719
- M (83) Myers, P. C., Linke, R. A., & Benson, P. J. 1983, ApJ, 264, 517
- O (99) Ohashi, N., Lee, S. W., Wilner, D. J., & Hayashi, M. 1999, ApJ, 518, L41
- O (88) Olano, C. A., Walmsley, C. M., & Wilson, T. L. 1988, A&A, 196, 194
- O (94) Ott, M., Witzel, A., Quirrenbach, A., Krichbaum, T. P., Standke, K. J., Schalinski, C. J., & Hummel, C. A. 1994, A&A, 284, 331
- P (97) Pratap, P., Dickens, J. E., Snell, R. L., Miralles, M. P., Bergin, E. A., Irvine, W. M., & Schloerb, F. P. 1997, ApJ, 486, 862
- S (00) Saito, S., Ozeki, H., Ohishi, & Yamamoto, S. 2000, ApJ, 535, 227
- S (92) Suzuki, H., Yamamoto, S., Ohishi, M., Kaifu, N., Ishikawa, S., Hirahara, Y., & Takano, S. 1992, ApJ, 392, 551
- Z (94) Zhou, S., Evans, N. J., II., Wang, Y., Peng, R., & Lo, K. Y. 1994, ApJ, 433, 131

| bbfootnotemark: | ||||||||
|---|---|---|---|---|---|---|---|---|
| Transition | (MHz) | aaThe position is cyanopolyyne peak except for C4H, which is at 1′southeast of the cyanopolyyne peak. | (Debye) | Telescope | (K) | (km s-1) | (km s-1) | (K) |
| C4H(=2-1,=-,=3-2) | 19015.144 | 2.00 | 0.9 | MPIfR | 0.24 | 6.78 | 0.48 | 0.06 |
| NH3( = 1,1) | 23694.506ccfootnotemark: | 1.50 | 1.47 | MPIfR | 0.57 | 6.84 | 0.72 | 0.13 |
| C3S(=4-3) | 23122.985 | 4.00 | 3.6 | MPIfR | 1.71 | 6.81 | 0.32 | 0.17 |
| HC5N(=16-15) | 42602.153 | 16.00 | 4.33 | NRO | 0.39 | 6.79 | 0.39 | 0.06 |
| CCS(=-) | 45379.033 | 3.97 | 2.81 | NRO | 2.5 | 6.83 | 0.42 | 0.1 |
| HC3N(=5-4) | 45490.316ccfootnotemark: | 5.00 | 3.72 | NRO | 2.7 | 6.86 | 0.73 | 0.1 |
| DNC(=1-0) | 76305.727 | 1.00 | 3.05 | NRO | 0.34 | 6.87 | 0.78 | 0.09 |
| DNC(=2-1) | 152609.774 | 2.00 | 3.05 | NRAO | 0.18 | 6.87 | 0.54 | 0.04 |
| HN13C(=1-0) | 87090.850 | 1.00 | 3.05 | NRO | 0.69 | 6.91 | 0.62 | 0.09 |
| HN13C(=2-1) | 174179.411 | 2.00 | 3.05 | NRAO | 0.31 | 6.77 | 0.42 | 0.06 |
| H13CO+(=1-0) | 86754.330 | 1.00 | 4.07 | NRO | 1.72 | 6.93 | 0.52 | 0.14 |
| N2H+(=1-0) | 93173.777ccfootnotemark: | 3.40 | 1.00 | NRO | 0.2 |
| Molecule | L1521E | Reference | TMC-1aaThe position is cyanopolyyne peak except for C4H, which is at 1′southeast of the cyanopolyyne peak. | Reference |
|---|---|---|---|---|
| C34S | 1.25 | 1 | 0.73 | 1 |
| CCS | 2.8 | 2 | 6.6 | 3 |
| C3S | 1.4 | 1.3 | 3 | |
| C4H | 9.8 | 440 | 4 | |
| HC3N | 2.3 | 17.1 | 3 | |
| HC5N | 0.46 | 5.6 | 3 | |
| NH3 | 7.3 | 19 | 3 | |
| N2H+ | 0.14 | 0.74 | 5 | |
| DNC | 0.042 | 0.89 | 2 | |
| HN13C | 0.064 | 0.53 | 2 | |
| H13CN | 0.23 | 1 | 0.37 | 1 |
| H13CO+ | 0.106 | 2 | 0.14 | 6 |
| C18O | 170 | 7 | 330 | 6 |
References. — 1: Hirota et al. (1998); 2: Hirota et al. (2001); 3: Suzuki et al. (1992); 4: Hirahara et al. (1992); 5: Hirahara et al. (1995); 6: Pratap et al. (1997); 7: Myers et al. (1983)