Spiral waves in accretion discs
Abstract
In the first part of this article, we review the observational evidence for spirals in the accretion discs of cataclysmic variables. It is shown that with the increasing amount of data available, spirals appear to be an omnipresent feature of accretion discs in outburst. Spirals seem to live until decline that is, for several tens of orbital periods. We then study the formation of spiral shocks from a theoretical side, using the results of various numerical simulations. We make a comparison between observations and theory and briefly discuss the implications of the presence of spirals in the discs of cataclysmic variables.
Royal Observatory of Belgium, 3 av. Circulaire, 1180 Brussels
Physics & Astronomy, Southampton University, Southampton SO17 1BJ, UK
1. Introduction
In close binaries, it is the detailed process of angular momentum transport that determines the structure of the accretion disc and therefore the rate at which gas, supplied from the mass donor, is actually accreted by the compact object. Although so fundamental to the process of accretion through discs, our understanding of angular momentum dispersal is very limited. We can roughly divide the possible physical mechanisms that may provide the required angular momentum transport into two classes. Those that work on a local scale and exchange angular momentum among neighbouring parcels in the disc, and those that rely on global, large scale structures in the disc. The local processes are commonly referred to as ‘viscous processes’ though it is clear that the molecular viscosity of the accretion disc material itself is many orders of magnitudes too small. Viscous interaction in the sheared Keplerian disc allows some material to spiral inwards, losing angular momentum, while excess momentum is carried outwards by other parts of the flow. In the famous -parameterisation of Shakura & Sunyaev (1973), this viscosity was replaced by a single dimensionless constant, which allows one to solve the structure equations for thin, viscously heated accretion discs.
A very different way of transporting the angular momentum is via density waves in the disc. In self-gravitating discs, the ability of density waves to transport angular momentum is a direct result from purely gravitational interaction between the wave and the surrounding disc material. Waves of this type can still transport angular momentum in the absence of self gravity, provided some mechanism exists that exchanges momentum between the wave and the fluid. Sawada, Matsuda, & Hachisu (1986) conducted numerical simulations of mass transfer via Roche lobe overflow of inviscid, non self-gravitating discs, and witnessed the development of strong spiral shocks in the disc which were responsible for the bulk of the angular momentum transport throughout the flow. Such trailing spiral patterns are the natural result of a tidal deformation of the disc that is sheared into a spiral pattern by the (near) Keplerian rotation profile of the disc material (Savonije, Papaloizou, & Lin 1994).
Although predicted in the 80s, observational evidence for spirals relies on the ability to spatially resolve the accretion discs in interacting binaries. Indirect imaging methods are thus required to search for such global disc asymmetries. Since the wave pattern is a co-rotating structure close to the orbital plane, Doppler tomography of strong emission lines is the ideal tool at hand. Although providing an image of the line emission distribution in velocity space, and not spatial coordinates, spirals should be readily identified as they maintain their spiral shape in the velocity coordinate frame.
The first convincing evidence of spirals was found in 1997, in the accretion disc of the eclipsing dwarf nova IP Peg. Since then, such waves have been confirmed in several outburst events of IP Peg as well as in other cataclysmic variables. In the next section, we will review the current observational status. A more detailed review can be found in Steeghs (2001).
2. Observational overview
2.1. IP Peg: when the story begun
When a Doppler map was constructed of the hydrogen and helium emission from IP Pegasi, just after rise to one of its outbursts, a surprising emission pattern was found (Steeghs, Harlaftis, & Horne, 1997, 1998). The accretion disc was far from symmetric but instead disc emission was dominated by a two armed pattern in the lower left and upper right quadrants of the Doppler map. The spiral arm velocities ranged between 500 and 700 km/s, corresponding to the outer regions of the accretion disc. The emissivity contrast between the spirals and other parts of the disc, was about a factor of 3 for H, and 5 in the case of HeI 6678 emission. There was no evidence for line emission from the bright spot. The spiral arm in the lower quadrant, closest to the secondary, extended over an angle of 100∘, and was weaker than the arm in the opposite quadrant. Strong emission from the irradiated secondary star was also present, producing the prominent S-wave at low velocities.
A week later, during the same outburst, more spectroscopy was obtained before the decline of the outburst had started (Steeghs et al. 1996). The Doppler image showed that the spiral pattern persists throughout the outburst, and the secondary star made a considerably larger contribution (from 6% to 10%) to the line flux. The arm in the upper right quadrant was still stronger, and the location of the arms had not changed, although the upper right arm appeared shorter.
In a different outburst Harlaftis et al. (1999) secured a whole orbit of IP Pegasi, three days after outburst. The HeII emission line at 4686Å was observed to provide a comparison with the previously observed H and HeI emission patterns. The trailed spectrogram of HeII, again showed the familiar behaviour of the double peaks from the disc, leading to a two armed spiral in the Doppler tomogram. A very similar emission pattern from the disc was also present in the nearby Bowen blend consisting of CIII/NIII emission and the Helium I line at 4471Å. The two spirals could be traced for almost 180 degrees, and the velocity of the arms varied from 495 km/s to 780 km/s. The widths of the arms were significant, and even changed as a function of azimuth. It is thus an intrinsically broad feature: the arms cover a substantial part of the disc, with the strongest emission from the outer regions. The dynamics of the majority of the accretion disc material are thus affected by the presence of these spirals.
Morales-Rueda, Marsh & Billington (2000) present spectroscopy of the dwarf nova IP Pegasi taken during two consecutive nights, 5 and 6 days after the start of the August 1994 outburst. Doppler maps show marked spiral structure in the accretion disc. The spiral shocks are present on both nights with no diminution in strength from one night to the next.
The detections by Steeghs et al. (1997) and Harlaftis et al. (1999) were made and 3 days after the start of the August 1993 and the November 1996 outbursts respectively, whereas the data presented by Morales-Rueda et al. (2000) were taken 5 and 6 days after the outburst had started. The spectroscopic data taken 8 days after the start of the August 1993 outburst by Steeghs et al. (1996) also hints at their presence. This indicates that the spiral shocks are long-lived structures, with time-scale of the order of days instead of hours.
During the 1999 outburst of IP Peg, spirals were again observed (Steeghs & Boffin, in preparation). One can then conclude that Doppler tomography of IP Pegasi during outburst invariably shows the presence of spiral shaped disc asymmetries. The two armed spiral dominates the disc emission from the start of the outburst maximum and persists for at least 8 days, corresponding to about 50 binary orbits. The spirals are present in a range of emission lines from neutral hydrogen to ionised helium, the latter indicating that the gas concerned has to be hot, although it is not yet clear if we are looking at direct emission from the shock, or recombination emission from the spiral arms. The asymmetry between the two arms that was observed in the discovery data, is also present at other epochs and in other lines. Moreover, as we will now see, IP Peg is no longer the only system with evidence for distortions of a spiral nature.
2.2. Disc asymmetries in other systems
The eclipsing dwarf nova EX Dra, with a 5-hour orbit, was the second object to show similar disc behaviour. Joergens, Spruit, & Rutten (2000) present Doppler images of EX Dra during its July 1996 outburst, and the similarity of the Doppler maps with those of IP Pegasi is obvious. The disc seen in the HeI line reconstructed by Doppler tomography shows a clear two-armed spiral pattern pointing to spiral shocks in the disc. The Balmer and HeII maps also give evidence for the presence of spirals. The asymmetry of the spirals in the EX Dra disc is smaller than in the IP Peg observations perhaps indicating that the shocks are weaker. The spiral arm in the upper right is stronger in intensity as well as in asymmetry than that one in the lower left. This pattern is also seen in the Doppler maps of IP Peg.
Time resolved spectroscopic observations of U Gem during its March 2000 outburst show strong spiral shocks in the accretion disc (Groot 2001). The HeII 4686 most clearly shows the spiral arms during outburst. During the plateau at maximum brightness, 9 days into the outburst, the spiral shocks contribute 14% to the total HeII flux. The two arms of the spiral show a distinctly different evolution during the outburst and decline, which indicates an asymmetric evolution in the disc. Before outburst, the trailed spectrum shows a clear single S-wave which is identified as arising from the hot spot, located at a position of 0.55 R. The upper arm is stronger than the lower one at the end of the maximum brightness plateau but not during the decline of the outburst. Nine days after maximum brightness, the slope in the radial velocity - orbital phase plane of the lower arm of the spiral is –2600700 km s-1 orbit-1 and for the upper arm this is –1300200 km s-1 orbit-1. One day later, these numbers are –1740400 km s-1 orbit-1 and –1100200 km s-1 orbit-1 for the lower and upper arms, respectively, while during the decline, they become, respectively, 250140 km s-1 orbit-1 and 900170 km s-1 orbit-1. Thus, the decrease of the slope of the lower arm is much more rapid and pronounced than for the upper one.
As stated by Groot (2001), a possible evolutionary scenario for the spiral shocks one can derive from the comparison of these three systems is that the shocks appear immediately when the outburst starts (IP Peg; Steeghs et al. 1997), but not just prior to outburst (U Gem in quiescence; Groot 2001), grow in strength when the outburst reaches its maximum magnitude (Harlaftis et al. 1999 and Joergens et al. 2000), and continue to gain in strength, or at least remain constant, during the plateau phase characteristic of many DN outbursts (Steeghs et al. 1996, Groot 2001), and then fade during outburst decline (Groot 2001).
In another outburst of U Gem, Steeghs, Morales-Rueda, & Marsh (in preparation) also observed clear spirals in the HeII at the start of the outburst, which persisted during the maximum brightness plateau, 4 to 5 days after outburst (Fig. 1). On the other hand, during decline, 9 days after outburst, the Balmer emission reveals a relatively circular disc.
Indication for the presence of spiral patterns in the stars SS Cyg and V347 Pup are also discussed in Steeghs (2001). Very recently, prominent spiral arms have also been observed in the early phases of the 2001 WZ Sge outburst (Kuulkers et al., this volume).
We shall now turn to the theory and see if such spirals, apparently ubiquitous in the discs of cataclysmic variables, can be explained.
3. Theoretical analysis
Spirals are an ubiquitous phenomenon in astrophysical sites. They may appear, for example, in galaxies, protostellar discs, associated with Jovian planets in proto-planetary discs as well as in accretion discs in binary systems. Such waves may play a very crucial role in the transport of angular momentum and hence in the process of accretion.
Tidally generated spiral waves are the result of tidal torques of the companion star on the orbiting disc material. Initially triggered at the outer edge of the disc, where the tidal interaction between the disc and the companion star is strongest, they take the form of trailing spirals because the azimuthal velocity of the disc material monotonically increases inwards. Lin & Papaloizou (1979) were among the first to observe the spiral pattern in their study of tidal torques on accretion discs in binary systems with extreme mass ratios. In their case, the spirals were the result of the interaction with the inner Lindblad 2:1 resonance. It was however Sawada, Matsuda, & Hachisu (1986a,b) who showed, in their 2D inviscid numerical simulations of accretion discs in a binary of unit mass ratio, that spiral shocks could form which propagate to very small radii. Spruit (1987) and later Larson (1990) made semi-analytical calculations which were followed by numerous - mostly 2D - numerical simulations. A more detailed account can be found in Boffin (2001).
Savonije, Papaloizou, & Lin (1994) presented both linear and non-linear calculations of the tidal interaction of an accretion disc in close binary systems. They showed, in agreement with Lin & Papaloizou (1979), that the resonance is significant over a region proportional to the temperature. Thus, even in CVs with larger mass ratios, they concluded that the centre of the 2:1 resonance can still be thought of as lying in the vicinity of the boundaries of the disc and that the resonance can still generate a substantial wave-like spiral response in the disc, but only if the disc is large and the Mach number is smaller than about 10. For larger Mach number, Savonije et al. consider that wave excitation and propagation becomes ineffective and unable to reach small radii at significant amplitude.
3.1. Opening angle
The opening angle of the spirals is directly related to the temperature of the disc as, when the shock is only of moderate strength, it roughly propagates at sound speed. For illustration purposes, we present in Fig. 2 two numerical simulations of an accretion disc using the Smoothed Particle Hydrodynamics (SPH) method. An adiabatic equation of state (eos) is used with in one case, and a pseudo-isentropic eos with in the other. As is clear from the figure, the case produces a very open spiral, while the cooler one shows only a hint of disturbance at the outer edge, with very tightly wound spirals. This is even more clear in the high resolution simulation shown in Fig. 7 of Boffin (2001). Figure 2 also shows the reason for the difference: in the former case, the Mach number has values as small as 5, corresponding to a very hot disc, while in the latter case, the Mach number is above 20. This effect is the principal reason why it was believed that spirals may not be present in the accretion discs of cataclysmic variables, which are not hot enough. This is in particular the case in quiescent discs. As a byproduct, Fig. 2 also shows that the origin of the spirals lies in the tidal force of the companion, as in these simulations, no mass transfer is allowed from the companion.
3.2. Structure of spiral shocks
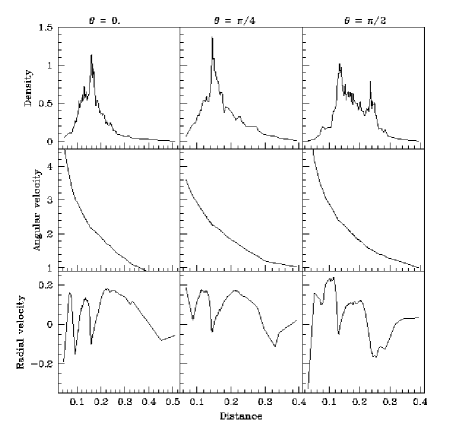
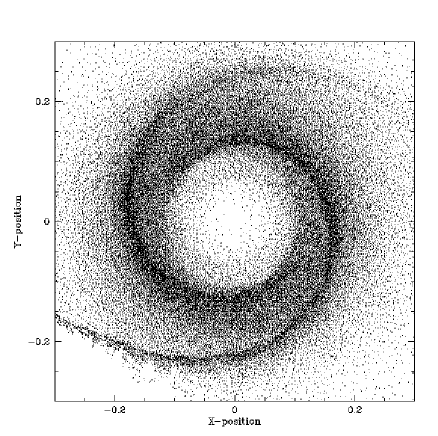
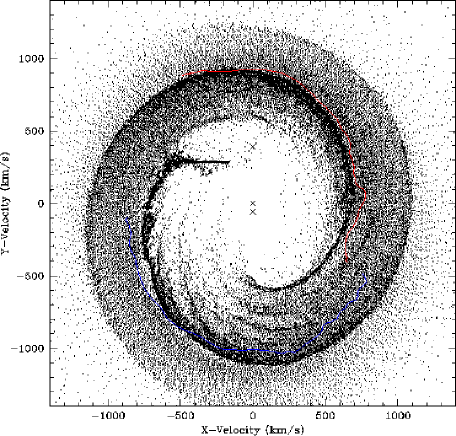
In this section, we would like to have a more detailed look at the way spirals affect the flow and hence lead to angular momentum transfer and mass accretion. To this aim, we will use the result of a simulation with using a modified version of the SPH method (Boffin, Yukawa, & Matsuda, in preparation). Figure 3 shows the flow in a close binary with mass ratio when we allow mass transfer from the inner Lagrangian point. Again, the now very typical open spiral can be seen. We then make three slices in this flow, at angles 0, and , considering only the upper right quadrant, and show the properties of the particles as a function of distance from a primary star (Fig. 5). As can be seen, the spiral shocks have a clear effect on the density field but also on the velocity field. In particular, the radial velocity exhibits a clear jump at the position of the shock. A more detailed analysis of the role of the spirals in the transport of angular momentum, in terms of an effective can be found in Boffin (2001). In Fig. 4 we show the corresponding Doppler map, that is the structure of the flow in the velocity-velocity plane. This allows a direct comparison with observations.
3.3. Comparison with observations
Looking at Fig. 4 and 1, one sees that a qualitative agreement can easily be reached. In fact, in Fig. 4, we have also plotted a scaled version of the position and intensity of the spirals observed during the August 1999 outburst of IP Peg (Steeghs & Boffin, in preparation; see Steeghs 2001). The agreement between theory and observations seems rather convincing. This very fact is at the base of a lot of controversy in the literature, because the discs obtained in the numerical simulations are considered too hot to be realistic, even for systems in outburst (see e.g. Savonije et al. 1994, Godon, Livio, & Lubow 1998).
But what is the Mach number in the discs of cataclysmic variables ? A rough estimate is generally taken assuming Keplerian rotation and a central temperature of a few K. This gives then Mach numbers in the range 15 to 50. One has to note however that, because of the tidal field, the flow in the accretion disc is far from being Keplerian, and large departures exist that can affect the geometry of the spirals, especially in the outer parts. Moreover, the tidal force can increase the temperature of the these outer parts (Steeghs & Stehle 1999). These two effects join together to bring the Mach number to values smaller than about 10, at least in the outer parts of the disc. This could explain the apparent agreement between observations and theory. This explains also why spirals can only be seen during the outburst, when the disc is large and hot. However, it has still to be explored if other parameters than the Mach number do not play a role in the geometry of the spiral pattern. A definitive conclusion will only be possible once we can make detailed three-dimensional numerical simulations including a realistic equation of state. One should also caution that the spirals observed in the different cataclysmic variables are not always similar and that even for a given system, their shape may vary in the outburst cycle. As Groot (2001) noticed, its tomogram of U Gem nine days after maximum compares favorably with the low Mach number simulations in Steeghs & Stehle (1999), while the IP Peg, EX Dra and U Gem in decline tomograms, all appear to have their maximum emissivity rotated anti-clock wise with respect to the simulations of Steeghs & Stehle (1999). On the other hand, as shown by Fig. 4, it is also possible to have an agreement between numerical models and one outburst of IP Peg. Here again, one needs detailed self-consistent numerical simulations and a complete observational coverage of the same outburst of one cataclysmic variable to reach a more definitive conclusion. The time of pioneering is over, now comes the time for a detailed study.
References
Boffin, H. M. J. 2001, in LNP Proc. 573, Astrotomography, ed. H. M. J. Boffin, D. Steeghs, & J. Cuypers (Springer), 69
Godon, P. 1997, ApJ, 480, 329
Godon, P., Livio, M., Lubow, S. 1998, MNRAS, 295, L11
Groot, P. 2001, ApJL, 551, L89
Harlaftis, E. T., Steeghs, D., Horne, K., Martin, E., T. M., 1999, MNRAS
Joergens, V., Spruit, H. C., Rutten, R. G. M. 2000, A&A, 356, 33
Larson, R. B. 1990, MNRAS, 243, 358
Lin, D.N.C., Papaloizou, J. 1979, MNRAS, 186, 799
Morales-Rueda, L., Marsh, T., Billington, I. 2000, MNRAS, 313, 454
Savonije, G.J., Papaloizou, J.C.B., Lin, D.N.C. 1994, MNRAS, 268, 13
Sawada, K., Matsuda, T., Hachisu, I. 1986, MNRAS, 219, 75
Sawada, K., Matsuda, T., Hachisu, I. 1986, MNRAS, 221, 679
Shakura, N. I., Sunyaev, R. A. 1973, A&A, 24, 337
Spruit, H. C. 1987, A&A, 184, 173
Steeghs, D. 2001, in LNP Proc. 573, Astrotomography, ed. H. M. J. Boffin, D. Steeghs, & J. Cuypers (Springer), 44
Steeghs, D., Stehle, R. 1999, MNRAS, 307, 99
Steeghs, D., Harlaftis, E. T., Horne, K. 1997, MNRAS, 290, L28
Steeghs, D., Harlaftis, E. T., Horne, K. 1998, MNRAS, 296, 463
Steeghs, D., Horne, K., Marsh, T. R., Donati, J. F., 1996 MNRAS, 281, 626