Temperature Map of the Perseus Cluster of Galaxies Observed with ASCA
Abstract
We present two-dimensional temperature map of the Perseus cluster based on multi-pointing observations with the ASCA GIS, covering a region with a diameter of . By correcting for the effect of the X-ray telescope response, the temperatures were estimated from hardness ratios and the complete temperature structure of the cluster with a spatial resolution of about 100 kpc was obtained for the first time. There is an extended cool region with a diameter of and keV at about east from the cluster center. This region also shows higher surface brightness and is surrounded by a large ring-like hot region with keV, and likely to be a remnant of a merger with a poor cluster. Another extended cool region is extending outward from the IC 310 subcluster. These features and the presence of several other hot and cool blobs suggest that this rich cluster has been formed as a result of a repetition of many subcluster mergers.
1 Introduction
Temperature maps of clusters of galaxies give almost direct knowledge about the history of past subcluster mergers. Many clusters are now known to exhibit significant temperature structures in the intracluster medium (ICM) based mainly on ASCA observations, and these results give us a view that clusters of galaxies are still evolving (e.g. Markevitch et al. 1996, 1998). However, the spatial resolution of ASCA is not capable of resolving kpc scale structures for objects at . On the other hand, nearby clusters () are very extended with , which requires us to perform multi-pointing observations. This makes the analysis complicated because of the energy-dependent point spread function (PSF) of the ASCA XRT, and only recently several results have been coming out (Watanabe et al. 1999; Kikuchi et al. 2000; Shibata et al. 2001; Furusho et al. 2001; Watanabe et al. 2001).
This letter reports temperature structure of the Perseus cluster (A426, ) over a radius of ( Mpc). This is the brightest cluster in the X-ray sky, and a very suitable object for the study of various properties of the intracluster medium (ICM). The PSPC image of the Perseus cluster showed significant substructures in the east from the cluster center, which has been interpreted as an evidence that the cluster is not in a relaxed state but has undergone recent mergers (Schwarz et al. 1992; Ettori et al. 1998). Following the initial ASCA study on the temperature variation for the central pointing (Arnaud et al. 1994), Ezawa et al. (2001) showed the large-scale metal abundance gradient and fluctuation of temperature distribution in 4 sectors based on mapping observations from ASCA. They also reported an extended soft component in the cluster center, characterized by a temperature keV. Recent Chandra image showed a complicated X-ray morphology around the central galaxy NGC 1275 (Fabian et al. 2000).
In this letter, we report on the two-dimensional temperature map with the resolution of ( kpc) derived from multi-pointing observations of the Perseus cluster with ASCA. We use km s-1 Mpc-1 and , which indicates kpc at the Perseus cluster. The solar number abundance of Fe relative to H is taken as (Anders and Grevesse 1989).
2 Observation and Analysis
ASCA observations of the Perseus cluster were performed in 4 separate occasions between August 1993 and February 1997. The number of pointings is 13 with an average exposure time of 10–20 ksec each, and the total exposure time amounts to 172 ksec. The observed regions cover a diameter of about . In this letter, we only deal with the GIS data because of its larger field of view than the SIS. The data screening procedure was the same as in our previous analysis for 3 other clusters (Furusho et al. 2001). The cosmic X-ray background (CXB) was taken from the archival blank-sky data taken during 1993–1994 (Ikebe 1995).
The flow of the data analysis is almost the same as that described in Furusho et al. (2001), i.e. we calculated hardness ratio in each pixel of the merged image for the 13 pointings after the background subtraction, and estimated temperature by comparing it with simulated values for isothermal ICM. The ray-tracing simulation includes effects from energy-dependent PSF and stray light (Tsusaka et al. 1995). As for the input X-ray image of the cluster, we employed the observed two-dimensional PSPC image in the energy range 0.5–2.0 keV in the same way as in Furusho et al. (2001). The PSPC observation of the Perseus cluster consists of 5 pointings, and the data were analyzed with the Extended Source Analysis Software package (Snowden et al. 1994). The input spectrum was assumed to be a single-temperature MEKAL model with keV with the Galactic absorption ( cm-2), and the significant metallicity gradient reported by Ezawa et al. (2001) was included in the model.
The definition of the hardness ratio is , where and represent count rates in the energy range 2–10 keV and 0.7–2 keV, respectively. The ratio of HRs between the data and the isothermal simulation for each pixel gives a deviation factor of the HR from the assumed temperature, along with its statistical error. Note that the HR values for the isothermal cluster differ from position to position because the PSF profile and the stray light intensity have significant energy dependence. Based on the relation, whose profile again depends on the position, we estimated the temperature for each observed region. The calculation of the relation was based on the single temperature model including the radial metallicity gradient.
As for the pixel size, the hard and soft band images were first constructed for pixels. For each pixel, the HR value used for the color-coded temperature map was calculated for surrounding cells (). This running average effectively suppresses the statistical fluctuation but reduces the angular resolution at the same time. The statistical errors in the cells are all less than 10%, and the systematic errors due mainly to the fluctuation of the cosmic X-ray background and the modelling of the XRT response (see Furusho et al. 2001) were estimated to be about 20% in the outer region and smaller in the inner regions, respectively.
3 Results
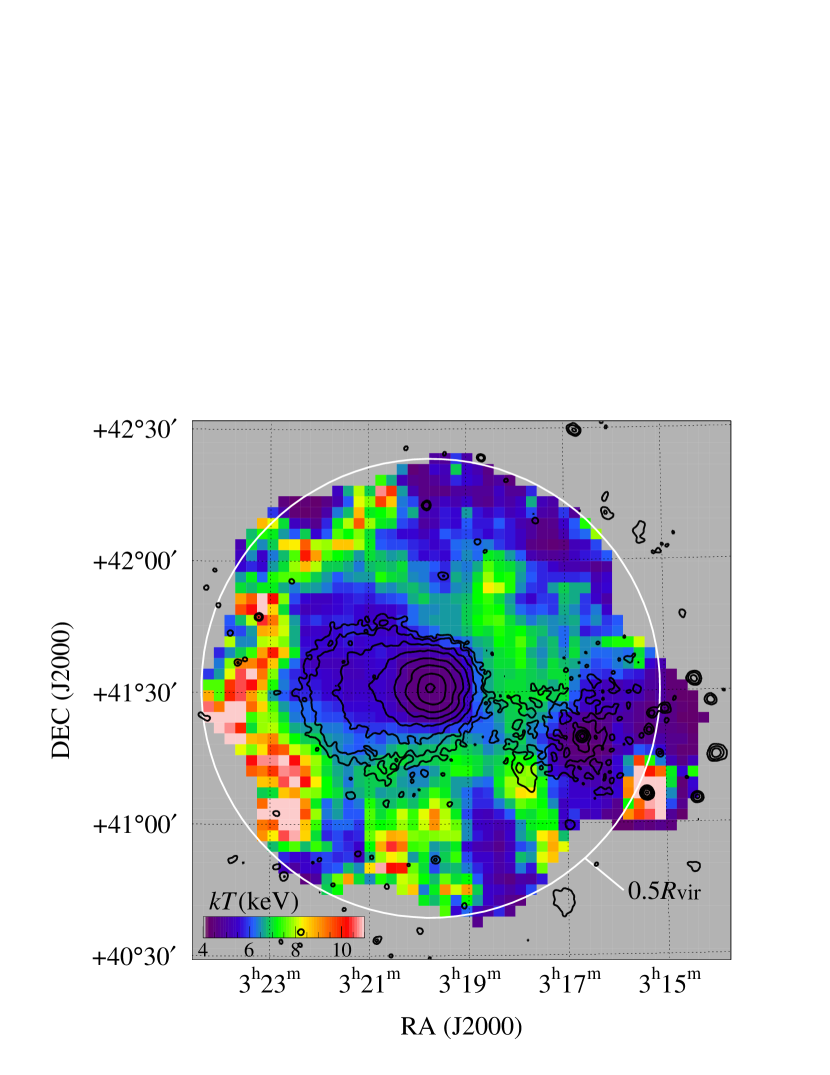
Figure 1 shows the color-coded temperature map of the Perseus cluster, compared with a residual PSPC surface brightness after subtracting a smooth model from the observed image. The subtracted model parameters, derived for the smooth western sector, were taken from Ettori et al. (1998). The temperatures were estimated assuming a single temperature as mentioned earlier. We first note that the temperature structures in the map are generally consistent with the previous coarse-resolution results by Ezawa et al. (2001). There is a large cool region around in the east from the cluster center, which is clearly extended with a diameter of about ( kpc). This cool region shows a remarkable correspondence to the enhancement in the surface brightness as seen in Figure 1. The correspondence between the cool region and the excess surface brightness suggests that this extended region is either embedded in or lying foreground to the Perseus cluster. This substructure in the surface brightness was already noted by Schwarz et al. (1992) and Ettori et al. (1998), but this is the first case which reveals that this feature accompanies a clear temperature drop.
The other interesting feature in the temperature map is the ring-like hot region which almost encircles both the cool region and the cluster center. The eastern ridge, at from the center running north to south, seems particularly hot with keV in a number of connected pixels. The rest of the ring-like feature indicates approximately the same temperature with keV. There are other soft regions: one small region in the south-south-west direction at , and an elongated region at the north-east edge. Neither of the regions show structures in the surface brightness distribution, suggesting that the low ICM temperatures in these regions do not accompany significant density contrast.
The central region within a diameter of shows a marked softening of the spectrum, as studied by Ezawa et al. (2001). They showed that 2 spectral components were needed to fit the spectra in the central region within , but the hotter component itself also indicated a marked softening down to keV. We also carried out spectral analysis assuming the 2-temperature model, and produced a temperature map only for the hot component. As a result, the color pattern turned out to be similar to Figure 1 in that the temperature in the central region within became low with keV. See Ezawa et al. (2001) for more information about the spectral softening in the central region.
Apart from the central concentration of the soft component, the two bright point sources, IC 310 and 1RXS J031525.1+410620, in the south-west region are clearly recognized in the temperature map. These sources are characterized by low ( keV) and high ( keV) temperatures, respectively, showing that the temperature map can effectively separate contributions from discrete sources.
One dimensional cutouts of the temperature distribution are shown in Figure 2a along east-to-west and south-to-north paths running through the center with a width of as indicated in Figure 2b. The errors in the plot denote 90% statistical errors for single parameters. These plots clearly demonstrate that the observed temperature variation is statistically significant. The extended cool region is recognized as a flat region between and along the path A in Figure 2a, which corresponds to the residual component as shown by the contours in Figure 1. The very high temperature at the eastern edge ( in path A), the hot region in the south ( in path B), and the northern cool region ( in B) can also be identified clearly. These one dimensional plots suggest that a significant change of the temperature occurs in a scale of (300 kpc), even though the finer scale structure may be suppressed by the bin width of .
To look into the spectral variation in correlation with the temperature variation in some detail, we have accumulated the energy spectra for selected regions and carried out spectral fits. We have chosen 3 representative regions as shown in Figure 2b, which indicate medium (#1), low (#2) and hot (#3) temperatures, respectively. The strong cool component around the central region causes the fit with single temperature models unacceptable and complicates the temperature estimation. To avoid this problem, we limited the energy range to 2–10 keV and carried out single temperature fits. Since the temperature of the cool component is about 2.0 keV (Ezawa et al. 2001), about 80% of the photon flux in the cool component can be suppressed. Free parameters were normalization, temperature and metal abundance, and was fixed to the Galactic value. The results are summarized in Table 1 along with 90% errors for single parameters. Since the data need to be accumulated in a few 100 square arcmin, the amplitude of temperature variations is suppressed if small-scale variations exist. The temperatures in the hot and the medium regions overlap in the 90% error, but the value in the cool region (#2) is significantly lower than the other two. It is notable that the accumulated spectrum in the east hot region does not show the high temperature of keV seen in the temperature map. This is because the very hot pixels are almost at the outer edge of the cluster, where the surface brightness is very low, and the spectral fit is affected by colder inner pixels. In summary, the spectral fit confirms the significance of the lower temperature in the extended region in the east of the cluster center. All the 3 regions indicate a consistent metal abundance around 0.3 solar.
4 Discussion
The mapping observation of the Perseus cluster from ASCA has detected a remarkable temperature structure as shown in Figure 1. Previous studies from ASCA (Arnaud et al. 1994; Ezawa et al. 2001) based on spatially accumulated spectra indicated that the ICM temperature significantly varied in several regions. However, this is the first case that the temperature map of the whole cluster is derived with a spatial resolution . The Perseus cluster has several extended cool ( keV) regions which seem to be surrounded by a filamentary structure with medium ( keV) to hot ( keV) temperatures. This feature looks quite different from, e.g., the Centaurus cluster, in which a hot region exists near the cluster center (Churazov et al. 1999; Furusho et al. 2001).
The remarkable finding is the extended cool region with a low temperature of about 5 keV at east from the cluster center. As seen in figure 1, this region has a diameter of about (600 kpc). The same region was recognized in the ROSAT observations (Schwartz et al. 1992; Ettori et al. 1998) based on the substructure in the surface brightness. The residual image after subtraction of a -model (contours in Fig. 1; also Schwarz et al. 1992) is very similar to the structure of the extended cool region. Ettori et al. (1998) discuss that there is possibly a group of galaxies merging into the main body of the cluster. Considering the size and temperature of the cool region, the merged body may well be an established poor cluster. No significant variation of metal abundance in this cool region suggests that the merged cluster was already enriched with metals to around 0.3 solar. Since the density contrast should be smoothed out in the sound crossing time ( yr), this extended cool region would have been created within the recent yr.
Figure 1 also shows that a chain of hot regions seem to be surrounding the cool region discussed above. It could be that the collision of the poor cluster, whose direction may be nearly in parallel to the line of sight, has caused shock heatings and created a large ring-like hot region. The diameter of the “hot ring” is as large as about ( Mpc). Assuming that the hot region has a spherical shell structure with inner and outer radii of 500 kpc and 1 Mpc, respectively, its excess thermal energy is estimated to be erg. The necessary mass of the colliding system is then at least if the relative velocity is about 1000 km sec-1. This suggests that a major merger with a small size cluster (such as Abell 1060) may have created the ring-like temperature structure.
Let us look into relevant time scales here. The thickness of the “hot ring” is less than about 500 kpc, therefore if the heat front propagates at km s-1 the time required to heat up the ring is less than yr, which is comparable to the ion-electron relaxation time (Takizawa 1999). On the other hand, the conduction time for this “hot ring” structure to be smoothed out is roughly estimated as yr, assuming a standard thermal conductivity. This means that the hot structure would dissipate away before the whole region is sufficiently heated up. The presence of the “hot ring” suggests that the thermal conductivity in ICM may be lower by an order of magnitude than the standard value, as recently pointed out by Ettori and Fabian (2000). In such an outer region of the cluster with low gas density, however, suppression of the conduction in terms of strong magnetic field may not be effective.
Other structures in the temperature map are smaller and seemingly consisting of many blobs with a rough size of (300 kpc). We note that in the Virgo cluster, Shibata et al. (2001) reported that the spatial scale of hot and cool regions are about 300 kpc, which is more or less the typical size of groups of galaxies. The Perseus cluster shows hot regions with keV toward the southern and northeastern edges of the cluster. Low temperatures ( keV) are seen at northwestern and southwestern edges, with the latter around IC 310. These asymmetric temperature structures do not accompany significant surface-brightness contrast except for the IC 310 subcluster. This indicates that the pressure distribution is not smooth, and a considerable bulk flow of the gas may be present. Numerical simulations indicate that the temperature structure remains several yr after a subcluster collision (e.g. Schindler and Müller 1993), and the slow relaxation process between ions and electrons would also cause complex distribution of the electron temperature (Takizawa 1999). The observed temperature structure in the Perseus cluster suggests that this cluster has experienced many subcluster mergers. These mergers may well have been the main building processes which have made the Perseus cluster into such a massive system, as suggested from numerical simulations of the cluster growth (Navarro, Frenk, and White 1995).
Finally, the distribution of the cool gas in the southwest near IC 310 looks as if the subcluster gas is blown away from the center of the Perseus. This suggests that the IC 310 subcluster is now falling into the main cluster, and the cool gas associated with the subcluster may be slowed down due to the ram pressure. We hope that observation with high angular resolution may lead to direct detection of shock features, such as sharp edges (Markevitch et al. 2000) observed with Chandra, and bring us a closed-up view of the dynamical processes in the cluster system.
References
- (1)
- (2) Anders, E., & Grevesse, N. 1989, Geochim. Cosmochim. Acta, 53, 197
- (3)
- (4) Arnaud, K. A. et al. 1994, ApJ, 436, L67
- (5)
- (6) Churazov, E., Gilfanov, M., Forman, W., & Jones, C. 1999, ApJ, 520, 105
- (7)
- (8) Ettori, S., Fabian, A. C., & White, D. A. 1998, MNRAS, 300, 837
- (9)
- (10) Ettori, S. & Fabian, A. C. 2000, MNRAS, 317, L57
- (11)
- (12) Evrard, A. E., Metzler, C. A. & Navarro, J. F. 1996, ApJ, 469, 494
- (13)
- (14) Ezawa, H. et al. 2001, PASJ, No. 4 in press
- (15)
- (16) Fabian, A. C. et al. 2000, MNRAS, 318, L65
- (17)
- (18) Furusho, T., Yamasaki, N. Y., Ohashi, T., Shibata, R., Kagei, T., Ishisaki, Y., Kikuchi, K., Ezawa, H., & Ikebe, Y. 2001, PASJ, 53, 421
- (19)
- (20) Ikebe, Y. 1995, Ph. D. thesis, University of Tokyo
- (21)
- (22) Kikuchi, K. et al. 2000, ApJ, 531, L95
- (23)
- (24) Markevitch, M. 1996, ApJ, 465, L1
- (25)
- (26) Markevitch, M., Forman, W. R., Sarazin, C. L., & Vikhlinin, A. 1998, ApJ, 503, 77
- (27)
- (28) Markevitch, M. et al. 2000, ApJ, 541, 542
- (29)
- (30) Navarro, J. F., Frenk, C. S., & White, S. D. M. 1995, MNRAS, 275, 720
- (31)
- (32) Schindler, S. & Müller, E. 1993, A&A, 272, 137
- (33)
- (34) Schwarz, R. A., Edge, A. C., Voges, W., Böhringer, H., Ebeling, H., & Briel, U. G. 1992, A&A, 256, L11
- (35)
- (36) Shibata, R. et al. 2001, ApJ, 549, 228
- (37)
- (38) Snowden, S. L., McCammon, D., Burrows, D. N., & Mendenhall, J. A. 1994, ApJ, 424, 714
- (39)
- (40) Takizawa, M. 1999, ApJ, 520, 514
- (41)
- (42) Tsusaka, Y., et al. 1995, Appl. Opt., 34, 4848
- (43)
- (44) Watanabe, M., Yamashita, K., Furuzawa, A., Kunieda, H., Tawara, Y., & Honda, H. 1999, ApJ, 527, 80
- (45)
- (46) Watanabe, M., Yamashita, K., Furuzawa, A., Kunieda, H., & Tawara, Y. 2001, PASJ, No. 4, in press
| 1 MEKAL model ( fixed, 2–10 keV) | |||
|---|---|---|---|
| /d.o.f. | |||
| region | [keV] | [solar] | |
| #1 (west hot) | 90.1/68 | ||
| #2 (east cool) | 88.8/68 | ||
| #3 (east hot) | 39.7/32 | ||