The Crab-like Supernova Remnant G21.50.9 at Millimeter Wavelengths
Abstract
We present a BIMA image of the supernova remnant G21.50.9 at 94 GHz with angular resolution . On scales larger than our synthesized beam, our results do not indicate any radial or local variations in the acceleration or synchrotron loss processes for the relativistic particles emitting at radio wavelengths. However, the FWHM size of the radio remnant is significantly greater than that of the X-ray remnant. Either any low-frequency spectral break is distributed across the remnant, or more probably the break frequency is in fact higher than GHz.
1 Introduction
Pulsar-powered nebulae have a characteristic radio spectrum; powering by the embedded neutron star, whether observed or not, creates a relatively flat synchrotron spectrum with a spectral index () between 0 and at low frequencies. Above this regime one or more breaks occur in the spectrum as synchrotron losses, reduced energy from the pulsar with time, and expansion of the nebula play a role. At high frequencies, synchrotron losses will dominate the spectrum and a break will occur such that the higher frequency spectral index should be steeper by 0.5 (Kardashev, 1962; Reynolds & Chanan, 1984). When the expansion, pulsar decay, and synchrotron losses are all important, an intermediate region with an intermediate slope will be present in the spectrum. The break points will generally diverge with time (Woltjer et al., 1997). In addition, non-thermal X-rays may come from the same or different parent populations of relativistic electrons.
To determine the parameters of the Crab-like SNRs, it is necessary to measure the frequencies at which the spectral breaks occur and the actual spectral indices in the different spectral components. Also, because the expansion rate and the magnetic fields may vary with position within a remnant, it is important to image in the region of the break frequency to look for possible variations across the source. The lower break frequency generally falls somewhere between and Hz (Salter et al., 1989b; Green & Scheuer, 1992). The Crab itself has a break frequency of about Hz, well above the mm band (Strom & Greidanus, 1992). However, measuring spatial variations in the mm-wave region of the spectrum is a difficult task which has not been done for any Crab-like SNR, since the synchrotron emission is generally weak and, while the sources are often extended, high resolution observations are needed to resolve structure across them.
G21.50.9 is one candidate which can be studied in detail. Integrated flux density measurements indicate a break frequency near 50 GHz and a total flux density of 4 Jy at 84.2 GHz (Salter et al., 1989b). The object has been imaged with resolution at both 4.9 GHz (Becker & Szymkowiak, 1981) and 22.3 GHz (Fürst et al., 1988). As expected, these two low-frequency images appear the same with a filled center and some structure. In addition, the center has very low polarization but is surrounded by a ring of highly polarized emission with a radial magnetic field. This may well indicate different conditions in the interior and around the outside of this SNR.
Recent X-ray observations have painted a very different picture at higher energies (Slane et al., 2000; Warwick et al., 2001). Here the emission is seen over a greater area, and has several distinct components: an unpulsed, compact X-ray source, an extended core corresponding to the radio nebula, and a faint outer shell of radius about 150 arcsec which is not observed in the radio.
In this letter we present the first interferometric image above the previously suggested break frequency using the BIMA111The BIMA array is operated by the Berkeley-Illinois-Maryland Association under funding from the National Science Foundation array at 94 GHz. We compare this new image with images at 5 GHz, 22 GHz and 0.1–10 keV to look for structures corresponding to the spectral break seen in the integrated flux density.
2 Observations
Observations were obtained with the B, C, and D configurations of the BIMA array (Welch et al., 1996) between 1998 October and 1999 March. To achieve suitable coverage, we used the technique of multi-frequency synthesis over both sidebands of the local oscillator. We measured two orthogonal polarizations to ensure accurate total intensities. In order to image fully the extended structure, and to assist with the recovery of low spatial frequency information, we imaged the source with a 7-point hexagonal mosaic. The primary beam of the 6.1-m antennas is Gaussian with FWHM and respectively at 90, and 110 GHz.
The quasar 1743038 was observed as a phase calibrator at 25 to 30 minute intervals, after 3 complete cycles of 7 pointings. The antenna gains were determined from observations of planets at short antenna separations; the uncertainty in the flux density scale is 10%. All data were obtained in an 800 MHz bandwidth using a digital correlator with 256 frequency channels. Single sideband system temperatures during the observations were between 170 and 450 K (scaled to outside the atmosphere).
Imaging was done with the MIRIAD software package (Sault, Teuben, & Wright 1995) using a maximum entropy mosaicing algorithm (Sault, Staveley-Smith, & Brouw 1996), in which the multiple pointing centers were combined into a mosaiced image corrected for the primary beam. To assess imaging reliability for a complicated source we must consider image fidelity (i.e. how well the image represents the real source brightness distribution), rather than the more familiar measures of thermal noise level or image dynamic range. To do this we re-calibrated and re-imaged G21.50.9 many times by choosing subsets of the data, and using a variety of weighting schemes (natural, uniform and robust). The RMS difference between these images was consistent with the thermal noise at 94 GHz (3 mJy beam-1). The peak differences between these images was 12 mJy beam-1, so differences between images corresponding to as much as 1.5 contours on figure 1 may not be significant. We use these empirical estimates of the RMS in evaluating the results.
3 Results
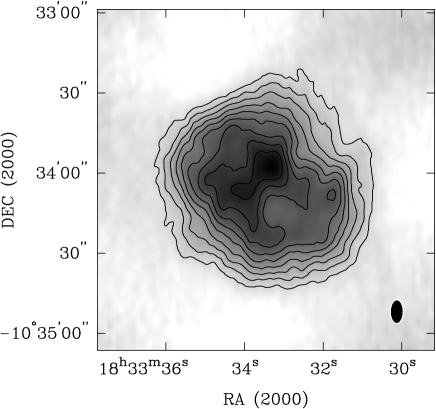
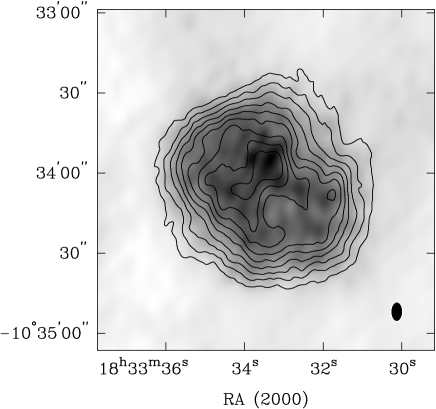
Figure 1 shows the maximum entropy image with mean frequency 93.7 GHz. The convolving half-power beamwidth was . This image includes measurements on spatial scales up to 2 arcmin. The 94 GHz image is similar to the 5 GHz (Becker & Szymkowiak, 1981) and 22 GHz (Fürst et al., 1988) images with comparable angular resolution, but does not reproduce the detailed small-scale structure seen at 22 GHz, even after convolution to the resolution () used for detailed studies by Fürst et al. (1988). If real, these features should be above the noise level in our image. It may be that the ‘CLEAN’ algorithm used by them produced a mottled appearance in the smooth emission (Cornwell, Braun, & Briggs, 1999). The three interferometric images also differ somewhat from the single dish 90 GHz image (Salter et al., 1989a): the secondary peak to the north east in that image is not seen with the interferometers. Given the difficulties inherent in single-dish imaging, we do not consider this discrepancy significant.
The total flux density recovered in the final image is 3.5 Jy measured within a radius of . The total flux densities measured on the individual images made from the 90 and 110 GHz data separately (3.4 Jy and 3.6 Jy) are consistent within the calibration errors of about 10%. Omitting the most compact array configuration reduces the measured total flux density, to 3.0 Jy, as expected. We conclude that the final image recovers all the emission corresponding to the known radio extent, with a total flux density Jy at 94 GHz, in agreement with the single-dish result at 91 GHz of Jy (Salter et al., 1989a). However, we note that the total flux density has been estimated in the deconvolution and has not been directly measured by the interferometer.
3.1 Radial profile analysis
In order to evaluate the spectral index distribution accurately, we must match the data as closely as possible, not only in angular resolution but also in the spatial sampling of the images. One possibility is to compare completely sampled images at each frequency. We have compared the normalized surface brightness in elliptical annuli of the 94 GHz, 22 GHz (Fürst et al., 1988) and 0.1–10 keV images.222The X-ray data used were from HRC image #1406 (1999 October 25) in the Chandra archive. The 5 GHz maps (Becker & Szymkowiak, 1981) were not available in digital format. The best-fit center for the analysis was determined empirically to be , (J2000). The ellipses had position angle 45° and axial ratio 0.6. To make the comparison we subtracted base levels of 5000 K, 2 mJy beam-1 and 2 counts respectively from the 22 GHz, 94 GHz and X-ray images, and then normalized the data at the center, after removing the contribution of the compact X-ray source. The comparison, using annuli of width 5 arcsec, is plotted in figure 2.
The errors in our radial profile at 94 GHz were estimated empirically from the RMS variation between the various images discussed in §2. Using 1.5 arcsecond bins, the RMS variation between the derived radial profiles was generally less than 1.5% of full scale. The error bars on figure 2 indicate this uncertainty.
The two radio datasets agree within our estimate of the error at all but two points on the plot. Taking into account the sensitivities of the images and the ‘peak’ errors in the imaging process (§2), we do not find these discrepancies to be significant. Thus we can find no significant radial differences between the radio images at 22 and 94 GHz. A similar analysis was made from the contour maps of the 5 and 94 GHz data using graphical techniques. These were also found not to differ significantly.
By contrast, the X-ray shape of the plerion remnant differs significantly from the radio shape. At a radius of 30″, the radio surface brightness is two-thirds of the central value, whereas the X-ray surface brightness is only 15% of its peak. The major axis FWHM sizes of the radio and X-ray remnants are 68″ and 35″ respectively.
3.2 Search for a radio shell
G21.50.9 has recently been shown to have faint X-ray emission extending well beyond the radio (Slane et al., 2000; Warwick et al., 2001). This may be the signature of the SNR shell; in this case a radio counterpart would be expected. Slane et al. report that they have been unable to detect this shell at 1 GHz to a surface brightness limit of W m-2 Hz-1 sr-1 (30 mJy arcmin-1). Any emission with a canonical shell-type spectral index between and would be far below our detection limit. Emission on the scales Slane et al. expected from the X-ray brightness distribution would be heavily resolved except on the shortest of our baselines. Modeling the X-ray emission with – diameter Gaussian, disk and shell distributions, we generated data for the most compact array configuration used. The expected visibility of the extended emission ranged from 5 to 50% for these models. After tapering our data to a beam, we were unable to detect any emission to a () level of 10 mJy beam-1 corresponding to a source brightness limit of 20 to 200 mJy arcmin-1 for the above models.
4 Discussion
The virtually identical radial brightness distributions above and below the apparent break frequency given by Salter et al. (1989a) indicate no change in the spectral index with radius. This would appear to rule out any change in magnetic field strength, and thus break frequency with radius and also any variation in diffusion of particles throughout the remnant. Alternatively the break may actually be above the frequency of our observations. We discuss both possibilities below, but first we revisit the questions of the age and distance of G21.50.9.
The most reliable distance estimates for G21.50.9 have been minimum distances obtained kinematically from hydrogen absorption measurements. These estimates have ranged from 4.4 to 5.5 kpc. The best determination of remains that of Davelaar et al. (1986) ( km s-1). We use kpc (Reid, 1993) and the Galactic rotation model of Brand & Blitz (1993) to obtain a minimum distance to G21.50.9 of 4.4 kpc. At that distance the major axis of about is 2.1 pc. See Davelaar et al. (1986) for a discussion of the maximum distances sustainable from a kinematic analysis.
There is no reliable age estimate for G21.50.9. While it is physically smaller than the other Crab-like SNRs studied, it is much fainter than the Crab and also has a low frequency for the break in the spectrum, implying that the pulsar either did not provide as much energy, or has had time to decay. G21.50.9 may be the result of a supernova in a very dense part of the Galaxy, or its progenitor may have had a relatively weak stellar wind. The radio size alone indicates that the remnant could be young compared to the historical Crab-like SNRs (the Crab Nebula and 3C58). But the larger size of the faint outer X-ray component indicates a greater age. A reasonable estimate for the age could be 1000 years, although this may be substantially in error.
4.1 Spectral break below 100 GHz
If the break frequency is below our observing frequency and particles are injected locally by the neutron star as the nebula expands, we would expect to see some spectral steepening at the edge of the remnant, where electrons with shorter lifetimes would be under-abundant. This would show up as a smaller size, as is seen in X-rays but not in the radio. Applying the standard minimum energy requirement (equipartition), the average magnetic field for G21.50.9 at our adopted minimum distance is 460G (Slane et al., 2000). This is comparable to estimates of the field in the Crab Nebula obtained by this and other methods (Hester et al., 1996). The conventional spectral break due to synchrotron losses in a field mG occurs at age yr at frequency GHz. For GHz the estimated age of the break would be yr, larger than seems likely for this small-diameter object, unless it was formed in a very dense medium. Magnetic fields of several mG are required to make the synchrotron lifetime comparable to the age of most known Crab-like remnants exhibiting only a naked plerion. This supports the view that this spectral break is above our observing frequency.
Another explanation of the observed spectrum, discussed by Green & Scheuer (1992), is that in 3C58 and G21.50.9 the pulsar’s excitation has stopped and so the decay of the older electrons has proceeded further and caused the steeper high frequency spectrum. If the relativistic electrons do diffuse throughout the remnant, this could allow the same structure above and below the break frequency. A related explanation for the low frequency of the spectral break and the steeper spectrum above the break comes from a suggestion that Crab-like SNRs might evolve to be more like G21.50.9 when the pulsar input decays; young electrons observed in X-rays experience a weaker magnetic field when they are injected into the pulsar wind nebula than did the older ones still seen at radio wavelengths (Woltjer et al., 1997). We note that 3C58 and G21.50.9 both have lower break frequencies and steeper spectral indices above the break than remnants with active pulsars such as the Crab Nebula and (Green 2000333Available at http://www.mrao.cam.ac.uk/surveys/snrs., Manchester et al. 1993).
In summary, if the break is below our observing frequency, and due to synchrotron losses, we would expect the spectral index to steepen with distance from the remnant’s center. Since this is not observed, either the electrons were not injected with a simple power law and perhaps have an intrinsic spectral flattening towards longer wavelengths, or the radio-emitting particles have diffused throughout the remnant.
4.2 Spectral break above 100 GHz
The above discussion and the X-ray results seem to favor the conclusion that the break is indeed above approximately 100 GHz. Perhaps the slightly lower integrated flux densities in the 50–100 GHz range could be accounted for by different background levels chosen by different observers, particularly if there is any faint radio counterpart corresponding to the extended X-ray emission.
Gallant & Tuffs (1998) have measured the spectrum of G21.50.9 at infrared wavelengths and find evidence for an X-ray to radio change in spectral index of , which could indicate a break frequency much higher than previously thought. Extrapolation of the X-ray spectra (Slane et al., 2000; Warwick et al., 2001) to meet the extrapolation of a single power law fit to all the radio data or just to the points below 30 GHz tends to support this conclusion. We note that a recent report of an integrated flux density of 3.9 Jy for the entire SNR at a frequency of 230 GHz by Bandiera et al. (2001) also supports a single power law for the radio spectrum at least beyond that frequency. Sub-millimeter and further infra-red observations are required to settle the question.
Overall, the observational data better support a higher break frequency due to simple synchrotron losses, with spatial effects seen in X-rays but not at radio wavelengths. In this case, the particles on the outer edges of the remnant should have been injected/accelerated first, and are the ones showing evidence that the highest energy particles have begun to decay.
4.3 The X-ray morphology
The radio data do not address the question of why there are distinct breaks in the X-ray morphology between the central peak and the core and again between the core and the plateau. The former characteristic is similar to that seen in 3C58 (Helfand et al., 1995) but the latter appears to be a unique property of G21.50.9. One possibility is that there could have been multiple events or injection epochs. Although the entire remnant seems to be pulsar-powered, expansion into different ISM may affect the way the material responds to the pulsar stimulation. Alternatively, the pulsar may have a nebula or a companion which could change its effect on its surroundings. The breaks in the X-ray spectrum may also be due to different decay rates for the emitting particles in the core and the plateau. The recent X-ray data argue against any thermal component (Safi-Harb et al., 2001).
5 Conclusion
Using BIMA observations at 94 GHz we have found G21.50.9 morphologically to have very similar structure at millimeter and longer radio wavelengths, indicating no change in spectral index with radius (although we have not been able to reproduce all the small-scale structure seen at 22 GHz). Particles emitting at radio wavelengths either do not show evidence of a variation in lifetime with distance from the assumed pulsar, or are well-diffused throughout the remnant. Since radial variations in the spectrum are seen at X-ray wavelengths, the most likely scenario is that the break frequency is above the frequency of the present observations. Measurements at higher frequencies will most likely support this picture. If they instead confirm a break frequency well below 94 GHz, the break is not likely to be due to the limited lifetimes of the higher energy electrons, but to some other mechanism.
References
- Bandiera et al. (2001) Bandiera, R., Neri, R. & Cesaroni, R., 2001, in AIP Conf. Ser. 565, Young Supernova Remnants, ed. S. Holt & U. Huang (New York: AIP), 329
- Becker & Szymkowiak (1981) Becker, R., & Szymkowiak, A. 1981, ApJ, 248, l23
- Brand & Blitz (1993) Brand, J. & Blitz, L. 1993, A&A, 275, 67
- Cornwell, Braun, & Briggs (1999) Cornwell, T., Braun, R., & Briggs, D. S. 1999, in ASP Conf. Ser. 180, Synthesis Imaging in Radio Astronomy II, ed. G. B. Taylor, C. L. Carilli, & R. A. Perley (San Francisco: ASP), 151
- Davelaar et al. (1986) Davelaar, J., Smith, A. & Becker, R. H. 1986, ApJ, 300, L59
- Fürst et al. (1988) Fürst, E., Handa, T., Morita, K., Reich, P., Reich, W., & Sofue, Y. 1988, PASJ, 40, 347
- Gallant & Tuffs (1998) Gallant, Y. A., & Tuffs, R. J. 1998, Mem. Soc. Astron. Ital., 69, 963
- Green & Scheuer (1992) Green, D., & Scheuer, P. 1992, MNRAS, 258, 943
- Green (2000) Green D. A. 2000, A Catalogue of Galactic Supernova Remnants (2000 August version; Cambridge: MRAO).
- Helfand et al. (1995) Helfand, D. J., Becker, R. H. & White, R. L. 1995, ApJ, 453, 741
- Hester et al. (1996) Hester, J. J. et al. 1996, ApJ, 456, 225
- Kardashev (1962) Kardashev, N. S. 1962, SvA, 6, 317
- Manchester et al. (1993) Manchester, R. N., Staveley-Smith, L. & Kesteven, M. J. 1993, ApJ, 411, 756
- Pacini & Salvati (1973) Pacini, F., & Salvati, M. 1973, ApJ, 186, 249
- Reid (1993) Reid, M. J. 1993, ARA&A, 31, 345
- Reynolds & Chanan (1984) Reynolds, S., & Chanan, G. 1984, ApJ, 281, 673
- Safi-Harb et al. (2001) Safi-Harb, S., Harrus, I. M., Petre, R., Pavlov, G. P., Koptsevich, A. B., & Sanwal, D. 2001, ApJ, in press
- Salter et al. (1989a) Salter, C. J., Emerson, D. T., Steppe, H., & Thum, C. 1989a, A&A, 225, 167.
- Salter et al. (1989b) Salter, C., Reynolds, S., Hogg, D., Payne, J., & Rhodes, P. 1989b, ApJ, 338, 171
- Sault et al. (1995) Sault, R. J., Teuben, P. J., & Wright, M. C. H. 1995, in ASP Conf. Ser. 77, Astronomical Data Analysis Software and Systems IV, ed. R. A. Shaw, H. E. Payne, & J. J. E. Hayes (San Francisco: ASP), 433
- Sault et al. (1996) Sault, R. J., Staveley-Smith, L., & Brouw, W. N. 1996, A&AS, 120, 375
- Slane et al. (2000) Slane, P., Chen, Y., Schulz, N. S., Seward, F. D., Hughes, J. P., & Gaensler, B. M. 2000, ApJ, 533, L29
- Strom & Greidanus (1992) Strom, R & Greidanus, H. 1992, Nature, 358, 654
- Warwick et al. (2001) Warwick, R. S. et al. 2001, A&A, 365, L248
- Welch et al. (1996) Welch, W. J. et al. 1996, PASP, 108, 93
- Woltjer et al. (1997) Woltjer, L., Salvati, M., Pacini, F., & Bandiera, R. 1997, A&A, 325, 295