Jy radio sources in the cluster MS105403
Abstract
An extremely deep 5 GHz radio observation is presented of the rich cluster MS105403 at redshift . 34 radio sources are detected down to a 6 level of 32Jy, compared to about 25 expected from previous blank field radio source count determinations; the sources giving rise to these excess counts lie predominantly within 2 arcmins ( kpc) of the cluster centre. Existing imaging and spectroscopic observations have provided optical identifications for 21 of the radio sources and redshifts for 11, of which 8 are confirmed cluster members. Four of these eight confirmed cluster sources are associated with close galaxy pairs (10 – 25 kpc projected offset) of similar magnitude, implying that the radio source may be triggered by an interaction. However, although MS105403 has a very high fraction (17%) of on–going mergers (separations kpc), no radio emission is detected towards any of these merger events, setting a mean upper limit of 10 yr-1 for any star formation associated with these mergers. This supports a hypothesis that low luminosity radio sources may be onset by initial weak interactions rather than direct mergers. The host galaxies of the other four confirmed cluster radio sources are all isolated, and show a range of morphologies from early–type to Sc. A comparison between the emission line and radio luminosities suggests that two of these four radio sources are low–luminosity active galactic nuclei (AGN), whilst for at least one of the other two the radio emission is associated with on–going star formation. All of the radio sources associated with the galaxy pairs appear more likely AGN than starburst origin. The overall proportion of radio sources associated with AGN in this cluster (%) is higher than that detected at these flux density levels in the field (4050%).
keywords:
galaxies: clusters: individual: MS105403 — galaxies: starburst — galaxies: evolution — radio continuum: galaxies1 Introduction
Clusters of galaxies are the largest, most massive, collapsed structures in the Universe and, although only a small fraction (%; Dressler 1984) of all low redshift galaxies lie in cluster environments, clusters play a key role in studies of galaxy evolution since they contain large numbers of galaxies at the same distance. The central regions of clusters are dominated by a population of luminous early-type galaxies which occupy a narrow locus in colour–magnitude relations and show a tight relationship between their effective radius, effective surface brightness, and central velocity dispersion (the fundamental plane, Dressler et al. 1987; Djorgovski & Davies 1987); these relations evolve with redshift out to roughly in accordance with passive evolution predictions, with no significant increase in scatter (e.g. van Dokkum et al. 1998a,b, Schade, Barrientos & Lopez-Cruz 1997, Stanford, Eisenhardt & Dickinson 1998). However, Butcher & Oemler [1978] showed that by redshift a substantial population of bluer galaxies appears in many, but not all, clusters. These bluer galaxies are almost all disk galaxies, of which many exhibit strong H or [OII] 3727 emission lines indicative of recent star formation (e.g. Dressler et al. 1997, 1999). These results point strongly to a higher level of activity in high redshift clusters.
In addition to star–formation activity, galaxies can also display nuclear activity associated with an active galactic nucleus (AGN). One of the cleanest methods of searching for either of these forms of activity is to utilise the radio emission. AGN are extremely luminous at radio wavelengths, with luminosities reaching as high as about W Hz-1 at 1.4 GHz. Normal (ie non-AGN) galaxies have a range of observed radio luminosities, between about and W Hz-1 at 1.4 GHz, with starbursting galaxies filling the upper half of that range. The radio emission arising from these normal galaxies comes predominantly from the synchrotron emission of particles accelerated in supernova shocks (e.g. Condon 1992 and references therein), with a smaller thermal contribution from HII regions, and so essentially reflects the current star formation of the galaxy.
At redshifts the radio luminosities of luminous starburst galaxies and weak AGN correspond to microjansky flux density levels, and over recent years numerous Jy level radio surveys of the field have been carried out [1987, 1991, 1993, 1998, 1999, 2000]. The integral radio source count shows an upturn below a couple of mJy, indicating the emergence of a new population of radio sources at microjansky levels [1984, 1985]; indeed, a large proportion of the Jy radio source population have been shown to be associated with starburst galaxies and normal spiral galaxies at substantial redshifts (e.g. Windhorst et al 1995). The steep slope of the differential source counts of Jy radio sources, similar to that of the very powerful radio galaxies and quasars, implies that this population of sources, if it is a single population, is undergoing strong cosmological evolution with either the density or luminosity of the sources being higher in the past. This is in broad agreement with determinations of the evolution of the cosmic star formation rate [1998], suggesting that studies of Jy radio sources are important for understanding the star formation history and evolution of ordinary galaxies [2001].
Whilst deep Jy field surveys have made considerable progress in recent years, no studies of radio sources in distant clusters have been carried out to comparable depth. At low redshift (), the radio luminosity function in clusters, when viewed in terms of the proportion of optical galaxies which have a given radio luminosity, is statistically indistinguishable from that of the field [1996]. This is somewhat unexpected since the onset of a starburst or AGN is likely to be induced either by an infall of gas onto the galaxy or through a weak interaction or merger with a companion galaxy: it would be natural to assume that each of these phenomena would occur at a different rate in cluster environments than in the field. In low redshift clusters the similarity may be due to the relatively relaxed states of the clusters, with much of the gas and galaxies lying in stable virialised orbits and the gas having been stripped from the galaxies in the cluster centre (e.g. Gunn & Gott 1972): these effects reduce interactions and prevent a higher fraction of radio sources forming in these environments. Clusters of galaxies at higher redshifts, however, may still be in their formation process, with relatively high galaxy merger rates (e.g. van Dokkum et al. 1999) and a plentiful supply of disturbed gas. These should provide ideal laboratories to induce starbursts and AGN (cf. the high fraction of post–starburst galaxies in clusters; Poggianti et al 2000).
Dwarakanath & Owen [1999] carried out a detailed radio study of two clusters, Abell 2125 and Abell 2645, which have similar redshifts and richnesses (Abell class 4), but very different fractions of Butcher–Oemler blue galaxies; Abell 2125 has a blue galaxy fraction of 0.19, whereas that of Abell 2645 is only 0.03. They found that the radio luminosity distribution of cluster members of Abell 2125 is bimodal, with a peak at about W Hz-1 composed entirely of AGN, and a second higher peak at or below (due to the detection limit) W Hz-1 composed of a mixture of AGN and star-forming galaxies (see Section 5.4 for more details). In Abell 2645 many fewer radio sources were detected, with essentially the entire lower luminosity class of sources missing. The presence of this lower luminosity class of radio sources therefore seems to be connected with the presence of the blue Butcher–Oemler galaxies, although the two populations do not overlap strongly: only one of the blue galaxies in the Abell 2125 cluster has an associated radio source.
Smail et al [1999] have made a deep radio observation (rms W Hz-1 in our assumed cosmology) of the cluster CL09394713 and detect 8 cluster radio sources111Here the blended entries labelled 296 and 230 by Smail et al. are taken to be part of the same extended radio source, since even if separated into two sources the far brighter 296 entry still remains resolved., associated with a range of galaxy morphologies from ellipticals through to Sd–type galaxies. At higher redshifts, Stocke et al. [1999] have studied radio galaxies in clusters with redshifts to a limiting point source 1.4 GHz radio luminosity of W Hz-1. They found no evidence for evolution of the population of radio sources between redshift and the present epoch. However, their observations are only sensitive enough to detect the brighter of the two populations of cluster radio sources discovered by Dwarakanath & Owen [1999], and it is the fainter population which appears to depend upon the dynamical state of the cluster, and hence may be expected to show strong redshift evolution.
The goal of the current project, therefore, is to investigate in detail the nature of the fainter radio source population in high redshift clusters. This aim was addressed by carrying out a deep VLA observation of the rich cluster MS105403 at . The nature of this cluster and the existing observations of it are described in Section 2, and the new VLA observations are described in Section 3. The radio source population is investigated and compared with the optical imaging data in Section 4. In Section 5 an analysis is made of the cluster radio source population, including a detailed comparison of the radio, optical and emission line properties of the cluster galaxies. Conclusions are drawn in Section 6. Throughout the paper, cosmological parameters of , and km s-1Mpc-1 are assumed.
2 The cluster MS105403
With a redshift of , MS105403 is the highest redshift cluster in the Extended Medium Sensitivity Survey (EMSS) X–ray selected cluster sample [1990], and also one of the most luminous in X–rays with a 0.3–3.5 keV X–ray luminosity of erg s-1. On account of its high redshift and richness (Abell class 3), a deep 5 by 5 arcminute mosaic was made of the field around the cluster using the wide–field planetary camera 2 (WFPC2) on the Hubble Space Telescope (HST), in two filters (F606W and F814W; van Dokkum et al. 2000). This has subsequently been supplemented by deep near–infrared imaging of the cluster in the , and wavebands using the NTT, and , , imaging using FORS on the VLT, to provide galaxy colours across a long wavelength baseline (Franx et al. in preparation). These images show a conspicuous overdensity of red cluster galaxies with a somewhat irregular and elongated distribution [2000], probably consisting of three sub-clumps of galaxies at the same radial velocity; this is consistent with the detection of substructure in the X–ray image [1998, 2001].
Multi–object spectroscopy carried out on the Keck Telescope has enabled redshifts to be determined for over 200 objects in this field, with more than 130 of these being confirmed as cluster members (van Dokkum et al. 2000, Tran et al. in preparation). These authors found that the fraction of all early type galaxies in the central regions of the cluster is 46%, much lower than that at low redshift (%). Further, a very high fraction (17%) of cluster galaxies are classified as “merger/peculiar” on the basis of double nuclei (separations kpc), tidal tails, and distorted morphologies [1999]. This high fraction strongly argues against monolithic collapse models of galaxy formation. Interestingly, many of the merging galaxies are red, bulge–dominated galaxies with no detected nebular line emission, and colours offset from the early–type colour magnitude relation by only 0.07 magnitudes. The fraction of blue galaxies in the cluster, calculated in a manner equivalent to that defined by Butcher & Oemler [1978], is [2000], comparable to the mean value determined for clusters at redshifts .
MS105403 is clearly an interesting rich cluster with a wealth of observations over a wide variety of wavelengths and, crucially, with spectroscopic redshifts for the majority of the objects towards the cluster centre: currently, spectroscopic redshifts have been measured for 80% of all galaxies with (the brightest cluster galaxy has ) within the bounds of the HST mosaic. As such, MS105403 is an ideal target for a deep cluster radio survey. Indeed, it was one of the high redshift clusters in the 1.4 GHz survey of Stocke et al. [1999], who detected three radio sources within the cluster down to a flux density limit of 0.2mJy. These are discussed later, together with the weaker sources identified in the current observations.
3 Observations and data reduction
3.1 Observations and calibration
MS105403 was observed using the Very Large Array (VLA) at 5 GHz in C array configuration during three 10-hour runs on April 3, 6 and 7 2000. The total on-source integration time was 96270 seconds. The observations were carried out simultaneously at two frequencies, 4835 and 4885 MHz, each with two circular polarisations and 50 MHz bandwidth. With this set–up, the full–width–half–power of the antenna primary beam is about 9 arcmins and the angular resolution about 4 arcsec.
The observations were carried out using standard VLA procedures. Short observations of the primary flux calibrator 3C286 (1331+305) were used to calibrate the flux density scale, assuming flux densities of 7.46 and 7.51 Jy at the two observing frequencies; these are the most recently determined VLA values, and are approximately 1% above the flux density scale of Baars et al. [1977]. Observations of 3C286 separated in time by about 6 hours were used to determine the absolute polarisation position angle and to estimate the uncertainty in this calibration () from the difference between the solutions for the two different scans. The secondary calibrator 1058+015, offset 5 degrees from MS105403, was observed at 30 minute intervals throughout the runs to provide accurate phase calibration. The wide range of parallactic angles at which this calibrator was observed enabled the on-axis antenna polarisation response terms to be accurately determined.
3.2 Editing and Imaging
After first discarding data from any antenna or baseline showing excessive noise (very little for the first run, about 5% of the data from the second run and 10% of the data from the third run), the data were cleaned using the aips task imagr. Then, the presence of a just sufficiently bright (7mJy) point source towards the centre of the field, enabled two cycles of phase self–calibration to be carried out, which reduced the map rms by 10–15%. Final maps of the field were then produced in the Stokes parameters I, Q and U, by further cleaning the datasets. The maps were produced using an intermediate data weighting between those of natural and uniform weighting, by setting the data weighting robust parameter to 0.5. This weighting provided the best compromise between the higher sensitivity of a naturally weighted map and the higher angular resolution of a uniformly weighted map: the rms noise level was only 8% higher than that of natural weighting, and a Gaussian restoring beam of full–width–half–maximum (FWHM) 5 arcsec (north-south) by 4.5 arcsec (east–west) was used. A second total intensity map was also made at full angular resolution (4.0 by 3.9 arcsec FWHM) using uniform weighting to allow more detailed investigation of the source structural parameters; the rms noise level was about 70% higher than than that of the robust map.
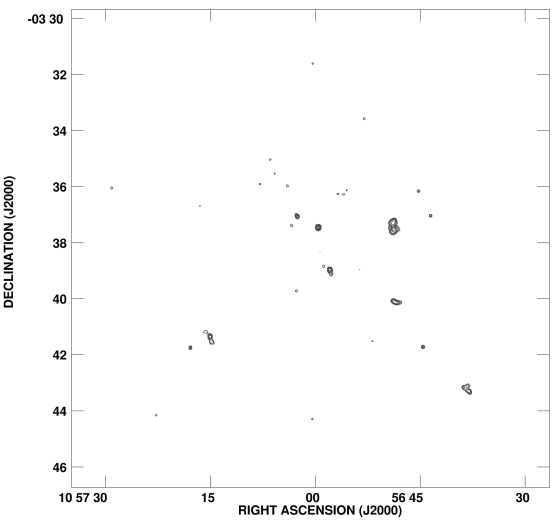
Maps of the field of size 1024 1024 pixels, with pixel size 1.0 arcsec were made. Extra clean boxes were placed around a further six sources outside of this field, to prevent any increase in the map noise due to their sidelobes, but these extra sources are not considered further in this paper since they are well beyond the primary beam for these observations and are unlikely to be associated with the cluster. 25000 clean iterations were used, which cleaned the maps down to a level of . Although negative clean components were found after a much smaller number of iterations, this deep cleaning is essential to fully remove the source sidelobes. A contour plot of the Stokes I 5 by 4.5 arcsec resolution map of the field is displayed in Figure 1.
3.3 Source extraction and properties
The resultant rms noise of the lower resolution maps is Jy, within a few percent of the theoretically expected value, indicating the success of the editing and calibration procedures. Real sources were taken to be those which had either a peak image flux density222Note that due to primary beam attenuation the true sky flux densities are higher than the observed image flux densities at large radii; see discussion of corrections later in this section. For clarity, in this paper the term “sky flux density” is adopted for the true flux density of the source and the term “image flux density” refers to the (uncorrected) lower value measured on the images due to primary beam attenuation. in excess of 32 Jy (6), or a peak flux density in excess of 21 Jy (4) and extended structure whose integrated image flux density was detected above the 6 level. There are no negative regions which would be selected according to these criteria if the sign of the radio flux density were inverted across the entire map, and so it is reasonable to expect that all of the extracted sources are real. Only those sources within 400 arcsec of the pointing centre (corresponding to 80% primary beam attenuation) were considered. 34 sources were thus selected from the image, and are detailed in Table 1.
| Source | RA (J2000) Dec | log() | Nature | PA | ||||||
| (1) | (2) | (3) | (4) | (5) | (6) | (7) | (8) | (9) | (10) | (11) |
| [′′] | [Jy] | [Jy] | [Jy] | [W Hz-1] | [′′] | [deg] | ||||
| MS1054C1 | 10 56 59.59 | 3 37 27.7 | 10.6 | 7302.0. | 7309.0 | 7302.0 | 25.1 | U | … | |
| MS1054C2 | 10 57 02.03 | 3 37 31.4 | 29.9 | 21.3 | 33.2 | 32.1 | 22.7 | R/U | 4.8 | 54 |
| MS1054C3 | 10 57 02.60 | 3 37 03.6 | 50.5 | 341.0 | 461.0 | 465.7 | 23.9 | R | 3.5 | 36 |
| MS1054C4 | 10 57 03.41 | 3 37 23.6 | 53.0 | 51.9 | 228.0 | 230.5 | … | E | 140 | |
| [Diffuse] | ||||||||||
| MS1054C5 | 10 57 03.80 | 3 37 42.7 | 57.0 | 24.2 | 38.2 | 38.8 | 22.8 | R/U | 4.3 | 75 |
| MS1054C6 | 10 57 04.09 | 3 37 07.8 | 67.0 | 35.3 | 51.5 | 52.8 | 23.0 | R/U | 3.2 | 108 |
| MS1054C7 | 10 56 58.86 | 3 38 51.4 | 77.4 | 61.1 | 91.6 | 95.0 | … | R/U | 1.5 | 41 |
| MS1054C8 | 10 56 57.93 | 3 38 58.0 | 87.9 | 839.0 | 1358.0 | 1428.0 | 24.4 | E | 148 | |
| [Core-jet] | ||||||||||
| MS1054C9 | 10 56 56.86 | 3 36 16.0 | 92.9 | 60.9 | 61.1 | 64.5 | … | U | … | |
| MS1054C10 | 10 56 55.97 | 3 36 16.7 | 99.8 | 52.3 | 47.6 | 56.1 | … | U | … | |
| MS1054C11 | 10 56 55.51 | 3 36 08.4 | 110.6 | 40.5 | 39.8 | 44.3 | … | U | … | |
| MS1054C12 | 10 57 03.99 | 3 35 58.9 | 114.5 | 63.4 | 63.7 | 69.7 | 23.1 | U | … | |
| MS1054C13 | 10 56 53.70 | 3 38 58.0 | 125.2 | 40.6 | 39.4 | 45.8 | … | U | … | |
| MS1054C14 | 10 57 02.73 | 3 39 43.2 | 133.5 | 56.0 | 62.2 | 71.7 | 23.1 | U | … | |
| MS1054C15 | 10 57 00.01 | 3 35 13.5 | 142.5 | 28.5 | 72.3 | 85.3 | 22.1 | R | 7.2 | 168 |
| MS1054C16 | 10 57 05.85 | 3 35 32.4 | 151.3 | 38.9 | 37.9 | 47.1 | … | U | … | |
| MS1054C17 | 10 57 07.95 | 3 35 54.8 | 156.0 | 47.4 | 45.3 | 58.2 | … | U | … | |
| MS1054C18 | 10 56 48.90 | 3 37 26.9 | 166.7 | 1029.0 | 6023.0 | 7653.0 | 23.8 | E | 7 | |
| [FR I] | ||||||||||
| MS1054C19 | 10 57 06.46 | 3 35 02.2 | 181.5 | 49.7 | 63.7 | 85.3 | … | R/U | 2.7 | 125 |
| MS1054C20 | 10 56 48.59 | 3 40 07.2 | 228.3 | 485.3 | 1493.0 | 2396.5 | … | E | 69 | |
| [FR I?] | ||||||||||
| MS1054C21 | 10 56 45.25 | 3 36 09.8 | 237.3 | 69.2 | 77.6 | 130.4 | 22.6 | U | … | |
| MS1054C22 | 10 56 43.53 | 3 37 02.6 | 249.0 | 106.0 | 104.5 | 188.3 | … | U | … | |
| MS1054C23 | 10 57 16.50 | 3 36 41.7 | 252.6 | 39.4 | 49.9 | 90.1 | … | U | … | |
| MS1054C24 | 10 57 16.53 | 3 38 45.1 | 256.6 | 33.8 | 38.1 | 70.2 | … | U | … | |
| MS1054C25 | 10 56 53.02 | 3 33 34.6 | 263.2 | 56.6 | 58.7 | 107.4 | … | U | … | |
| MS1054C26 | 10 56 51.88 | 3 41 31.4 | 265.1 | 39.9 | 41.8 | 76.4 | … | U | … | |
| MS1054C27 | 10 56 50.23 | 3 33 42.9 | 275.4 | 29.6 | 71.4 | 143.9 | … | R | 6.3 | 70 |
continued on following page
| Source | RA (J2000) Dec | log() | Nature | PA | ||||||
| [′′] | [Jy] | [Jy] | [Jy] | [W Hz-1] | [′′] | [deg] | ||||
| MS1054C28 | 10 56 46.09 | 3 41 32.7 | 315.4 | 32.0 | 30.8 | 79.9 | … | U | … | |
| MS1054C29 | 10 56 39.37 | 3 38 49.3 | 317.7 | 30.0 | 41.9 | 106.3 | … | R/U | 4.1 | 23 |
| MS1054C30 | 10 57 15.07 | 3 41 21.2 | 318.6 | 550.7 | 1230.8 | 3131.8 | … | E | 11 | |
| [FR I (II?)] | ||||||||||
| MS1054C31 | 10 56 44.61 | 3 41 43.3 | 338.2 | 167.6 | 168.3 | 484.4 | … | U | … | |
| MS1054C32 | 10 57 00.36 | 3 31 36.0 | 360.1 | 45.2 | 47.3 | 153.2 | … | U | … | |
| MS1054C33 | 10 57 17.88 | 3 41 44.9 | 365.3 | 166.2 | 174.0 | 589.4 | … | U | … | |
| MS1054C34 | 10 57 23.00 | 3 35 15.0 | 371.8 | 26.8 | 424.0 | 1600.0 | … | E | 110 | |
| [Diffuse] | ||||||||||
The absolute position of each source was determined, together with its position relative to the cluster centre (as determined by the optically selected brightest cluster galaxy). For extended sources, note that the quoted position is the position of the peak of the radio flux, and may not accurately correspond to the location of the associated optical galaxy. Similarly for the very faintest sources the theoretically determined errors may be somewhat optimistic.
The peak flux density of each source was measured directly from the image, and corrected for the effects of chromatic aberration: the 50 MHz bandwidth leads to radial smearing of a true point source, and results in the measured peak flux density being decreased by 5% at 230 arcsec radius, and 10% at 345 arcsec radius for these observations. For unresolved or barely resolved sources, the integrated flux density was calculated from a Gaussian fit using the aips task jfmit. Sources which are clearly extended, or of such low signal–to–noise that Gaussian fitting may be misleading, had their integrated flux density calculated by summing the flux density within a small box placed around the source. No correction has been made for surface brightness biases (e.g. Pascarelle et al. 1998), which should be fairly negligible at the relatively low angular resolution of these observations. The image flux densities were then corrected for primary beam attenuation to determine the true sky flux density of each source. This attenuation is approximately 50% at a radius of 270 arcsec. For those sources which were either extended or resolved, the integrated flux density was taken and corrected to determine the true sky flux density; for the unresolved sources, the peak flux density was used. All three flux densities are provided for each source in Table 1.
Morphological parameters of each source were determined using jfmit: for the sources brighter than Jy the higher angular resolution uniformly weighted map was used for this, with the lower resolution higher sensitivity map being used for the weaker sources. The deconvolved angular size of each source was determined, or an upper limit set thereon, after correction for radial smearing due to the non-zero bandwidth. Each source was classified as either: (i) unresolved (U), if only an upper limit could be set to its angular size; (ii) possibly resolved (R/U) if an angular size was determined but the one sigma lower limit was below zero; (iii) resolved (R), if the source was clearly resolved; or (iv) extended (E), if the intensity distribution could not be fit using a single Gaussian profile. In the later case, some indication of the nature of the radio source is also provided in the table. It should be noted here that no attempt has been made to correct for any overestimation of the angular sizes that may occur due to the presence of noise when fitting small radio sources detected at only the few sigma level (e.g. Windhorst et al. 1984). This effect is negligible for the brighter sources, but could be for the weakest sources: as a guide, the angular sizes of the fainter sources in the sample are typically about 15% higher if determined from the 5 arcsec resolution image than from the 4 arcsec resolution image used.
4 The Jy radio source population
4.1 Comparison with background counts
Numerous field surveys have been carried out of the Jy radio source population to determine the differential radio source counts at different radio frequencies (see introduction). Fomalont et al. [1991] have derived a parameterisation for the integral source count at 5 GHz of: , where is the number of sources per square arcmin with a total flux density greater than , measured in Jy. This formula can be used to predict the mean number of background sources that is expected in a 400 arcsec radius circle reaching a flux density limit of Jy at the centre, taking into account the variation in the sensitivity with radius due to primary beam attenuation. That gives a background prediction of about 25 () sources which, compared to the 34 sources observed, suggests that of order a quarter of the detected sources are likely to be associated with the cluster.
This analysis can be taken a step further by investigating the radial distribution of radio source counts in the cluster. In Figure 2 the number of detected sources is compared to the expected number of background sources as a function of distance from the centre of the cluster. A clear (% significant) excess of sources is detected in the inner 2 arcmin radius, corresponding to about 700 kpc at the redshift of the cluster. Beyond this radius, the number counts of detected sources are fully consistent with background predictions. These results are also provided numerically in a number of radial annuli in Table 2.

| Radius | |||||
|---|---|---|---|---|---|
| [′′] | [′′] | [Jy] | [arcmin-2] | ||
| (1) | (2) | (3) | (4) | (5) | (6) |
| 0 – 60 | 42 | 32.0 | 0.389 | 5 | |
| 60 – 120 | 95 | 33.9 | 0.363 | 7 | |
| 120 – 180 | 153 | 38.7 | 0.310 | 6 | |
| 180 – 240 | 212 | 48.0 | 0.241 | 3 | |
| 240 – 300 | 272 | 63.0 | 0.175 | 6 | |
| 300 – 360 | 331 | 87.7 | 0.118 | 4 | |
| 360 – 400 | 381 | 129.1 | 0.075 | 3 |
4.2 Radio–optical comparisons: the optical data
As discussed in Section 2, an HST WFPC2 mosaic of the MS105403 cluster has been made covering an area of 5 by 5 arcminutes for an exposure time of 6500 second per pointing per filter in each of the F606W () and F814W () filters. This reaches a depth in the band of for a point source. VLT observations using FORS in the , and wavebands have also been taken, covering a sky area of 6.8 by 6.8 arcmins and reaching a point source limiting depth (3) in the band of (Franx et al. in preparation).
To compare the radio and optical data, the two datasets must be placed in the same astrometric frames. Radio observations are automatically in the International Celestial Reference Frame (ICRF), with positional errors significantly below 0.1 arcsec, but the absolute positions of optical images can be uncertain at the arcsec level. Initial astrometry of the optical frames was taken from the HST astrometric headers, after correction for geometric distortions [2000]. This astrometry was then improved by considering the relative radio and optical positions of those unresolved radio sources which had unambiguous optical counterparts and adjusting the optical astrometry to produce the minimum combined radio–optical offsets for these sources, taking into account the uncertainties on the optical and radio positions of each source. This improvement resulted in a small offset of the optical frames by 0.17 arcsec E and 0.13 arcsec N from the astrometry of van Dokkum et al., with the central cluster galaxy now having a position of 10 57 00.02, 3 37 36.0 (J2000). The resultant optical frame astrometry should be within 0.2 arcsec of the ICRF. The magnitudes and positions of the optical galaxies were obtained using SExtractor [1996] on the HST image mosaic [2000].
| Source | Radio Source | ………………Optical Galaxies within 2.5 arcsec……………… | ||||||||||
| Old Id. | New Id. | Offset | Type | F814W | F606WF814W | Note | ||||||
| MS1054-C1 | 6.4 | 8.3 | 1459 | 4705 | 6.1 | 8.3 | 0.3 | Sc | 20.66 | 1.71 | 0.8452 | C |
| MS1054-C2 | 30.1 | 4.6 | 1435 | 5442 | 29.7 | 4.5 | 0.4 | S0/a | 21.87 | 1.96 | 0.8195 | CP |
| 1431 | 5432 | 29.4 | 2.3 | 2.4 | Sa/b | 22.11 | 1.59 | 0.8148 | CP | |||
| 1433 | 5465 | 32.3 | 5.7 | 2.5 | — | 22.63 | 1.91 | 1.0760 | ||||
| MS1054-C3 | 38.6 | 32.4 | 1656 | 5529 | 37.8 | 31.2 | 1.4 | E/S0 | 21.06 | 2.09 | 0.8216 | CP |
| 1655 | 5534 | 37.9 | 34.1 | 1.9 | E | 20.94 | 1.86 | 0.8397 | CP | |||
| MS1054-C4 | 50.7 | 12.4 | — | — | — | — | — | — | — | — | — | |
| MS1054-C5 | 56.6 | 6.7 | 1403 | 5599 | 56.8 | 5.5 | 1.2 | Sc | 20.14 | 1.31 | 0.8113 | C |
| MS1054-C6 | 61.0 | 28.2 | 1584 | 6038 | 61.5 | 28.3 | 0.5 | E | 20.76 | 2.13 | 0.8311 | CP |
| 99 | 6143 | 59.4 | 27.2 | 1.9 | — | 23.49 | 0.55 | — | ||||
| 99 | 6164 | 63.2 | 28.3 | 2.2 | E | 21.49 | 2.11 | — | P | |||
| 99 | 6145 | 59.6 | 30.2 | 2.5 | — | 22.80 | 0.65 | — | ||||
| MS1054-C7 | 17.4 | 75.4 | 735 | 4362 | 17.4 | 74.9 | 0.5 | — | 21.82 | 0.88 | — | |
| MS1054-C8 | 31.2 | 82.0 | 99 | 4012 | 31.0 | 82.8 | 0.8 | S0/a | 21.50 | 1.98 | 0.8297 | CP |
| 710 | 3995 | 30.5 | 81.0 | 1.2 | E | 20.78 | 2.14 | 0.8342 | CP | |||
| MS1054-C9 | 47.3 | 80.0 | 1865 | 3456 | 49.5 | 79.0 | 2.4 | Star | 17.82 | 1.85 | — | |
| MS1054-C10 | 60.6 | 79.3 | 1851 | 3104 | 60.8 | 78.9 | 0.4 | — | 23.53 | 0.78 | — | |
| 1851 | 3070 | 60.0 | 79.6 | 0.6 | — | 23.44 | 1.07 | — | ||||
| MS1054-C11 | 67.5 | 87.6 | 1895 | 2847 | 67.8 | 87.7 | 0.3 | — | 23.30 | 0.71 | — | |
| 99 | 2825 | 67.9 | 85.2 | 2.5 | — | 24.62 | 0.56 | — | ||||
| MS1054-C12 | 59.4 | 97.9 | 1942 | 5756 | 59.3 | 97.9 | 0.1 | E | 20.98 | 2.09 | 0.8309 | C |
| MS1054-C13 | 94.6 | 82.0 | 99 | 2036 | 94.1 | 82.2 | 0.5 | Sa/b | 21.92 | 1.63 | — | |
| 99 | 1943 | 96.3 | 80.2 | 2.5 | — | 23.87 | 0.76 | — | ||||
| MS1054-C14 | 40.6 | 127.2 | 99 | 564 | 41.1 | 127.5 | 0.6 | — | — | — | 0.8321 | C |
| MS1054-C15 | 0.1 | 142.5 | 2132 | 4416 | 0.6 | 142.9 | 0.7 | Sc | 17.96 | 1.23 | 0.2499 | |
| MS1054-C16 | 87.3 | 123.6 | — | — | — | — | — | — | — | — | — | |
| MS1054-C17 | 118.7 | 101.2 | 99 | 7702 | 118.3 | 101.7 | 0.6 | — | 25.91 | — | — | |
| MS1054-C18 | 166.5 | 9.1 | 1592 | 1 | 166.6 | 9.7 | 0.6 | E | 16.54 | 0.85 | 0.1830 | |
| MS1054-C19 | 96.4 | 153.8 | 2151 | — | 95.9 | 154.0 | 0.5 | — | — | — | — | |
| MS1054-C20 | 171.1 | 151.2 | 519 | — | 171.2 | 152.8 | 1.6 | — | — | — | — | |
| MS1054-C21 | 221.1 | 86.2 | 99 | 8 | 221.6 | 85.4 | 0.9 | E/S0 | 18.56 | 1.21 | 0.3740 | |
| MS1054-C22 | 246.8 | 33.4 | 99 | — | 246.7 | 32.7 | 0.7 | — | — | — | — | |
| MS1054-C23 | 246.7 | 54.3 | ……………………..Outside optical fields…………………….. | |||||||||
| MS1054-C24 | 247.1 | 69.1 | ……………………..Outside optical fields…………………….. | |||||||||
| MS1054-C25 | 104.8 | 241.4 | — | — | — | — | — | — | — | — | — | |
| MS1054-C26 | 121.9 | -235.4 | ……………………..Outside optical fields…………………….. | |||||||||
| MS1054-C27 | 146.6 | 233.1 | 99 | — | 147.4 | 232.2 | 1.2 | — | — | — | — | |
| MS1054-C28 | 208.5 | 236.7 | ……………………..Outside optical fields…………………….. | |||||||||
| MS1054-C29 | 309.1 | 73.3 | 99 | — | 308.7 | 73.1 | 0.5 | — | — | — | — | |
| MS1054-C30 | 225.3 | 225.2 | ……………………..Outside optical fields…………………….. | |||||||||
| MS1054-C31 | 230.7 | 247.3 | ……………………..Outside optical fields…………………….. | |||||||||
| MS1054-C32 | 5.1 | 360.0 | ……………………..Outside optical fields…………………….. | |||||||||
| MS1054-C33 | 267.4 | 248.9 | ……………………..Outside optical fields…………………….. | |||||||||
| MS1054-C34 | 344.0 | 141.0 | ……………………..Outside optical fields…………………….. | |||||||||
4.3 Radio–optical correlations
The location of each radio source relative to the centre of the cluster is given in Table 3, together with details of any optical galaxies with , that lie within 2.5 arcsec of the radio source. If multiple optical candidates are found, only those within 3 magnitudes of the brightest galaxy are listed, to minimise potential galaxy deblending problems. The 2.5 arcsec radius considered is larger than the 0.2 arcsec uncertainty in the astrometric frame discussed above, primarily due to uncertainties in both the radio and optical positions.
Contour plots of the 34 radio sources are displayed in Figure 7 in the appendix, overlaid where possible upon an optical image of the field. The nature of each individual source is also discussed there. From these results it is seen that of the 34 radio sources, 25 lie within the fields of the optical imaging. All but four (MS1054C4, C9, C16, C25) of these sources have optical counterparts which are very probably associated with the radio source. 10 radio sources are associated with optical galaxies with magnitudes typical of the bright cluster galaxies (), and a further 11 associated with galaxies whose magnitudes are either unmeasured or fall outside of this range. It should be noted that although towards the very centre of the cluster the sky density of detected sources is high, with of order 200 galaxies with detected in the centre-most square arcmin (1 galaxy per 18 square arcsec), in this region all of the radio–optical coincidences are with bright optical galaxies (). At these magnitudes the probability of an optical galaxy being at the observed radio–optical offsets is very low (%; from , where is the sky density of optical sources); however, even in the cluster outskirts the probability of chance coincidence with an optical galaxy of is as high as %. It should also not be forgotten that any true radio source hosts with may lie within 2.5 arcsec of a brighter galaxy, and so be misidentified.
5 The cluster radio source population
Of the 21 sources with optical identifications, spectroscopic redshifts are available for 11 of the host galaxies, and 8 (assuming here that MS1054C2 is associated with one or both of the cluster galaxies; see appendix) of these lie at the redshift of the cluster. This section concentrates upon these 8 cluster radio sources. Figure 3 provides a detailed picture of the radio–optical correlations and optical morphologies of these galaxies.
![[Uncaptioned image]](/html/astro-ph/0110122/assets/x3.png)
It should be noted that although only 8 of the 34 radio sources are confirmed to be associated with the cluster, these eight galaxies are likely to comprise the majority of the cluster radio population brighter than 32Jy: the confirmed cluster galaxies stand out from the background population not only through the excess radio source counts and their location in the inner 700 kpc radius from the cluster centre, but also by their association with galaxies of magnitudes and red () colours (see Table 3); only two of the radio sources without redshifts (MS1054C7 and C13) are associated with galaxies with measured magnitudes in this range, of which only C13 is red. Therefore conclusions based upon the properties of these 8 can be interpreted more generally.
A approximate comparison between the radio luminosities and star formation rates of (non-AGN) cluster galaxies can be made by converting between the type II supernova rate and the radio emission, since star–forming regions are transparent at radio wavelengths: W Hz-1, where is measured in GHz, is the radio spectral index and is the supernova rate per year [1990]333For reference, the Milky Way has yr-1 [1982] and M82 has yr-1 [1992].. Andersen & Owen [1995] showed that radio sources in nearby clusters are offset from the radio–far–infrared relationship of field galaxies by typically a factor of two, and suggest that this is due to a boosting of the radio emission of cluster galaxies (for a given star formation rate) due to compression of the magnetic field due to the motion of the galaxy through the intracluster medium; a more detailed study by Miller & Owen [2001] indicates that this applies only for a subsample of star-forming galaxies, is more prevalent in the richest clusters, and that the radio enhancement is typically a factor of 2 to 3. Based upon these results we include an extra factor of two into the above equation to account for this effect.
For a Salpeter initial mass function with upper and lower mass cut-offs of 125 and 0.15 respectively, and assuming that all stars more massive than 8 produce supernovae, there is approximately one supernova for each 120 of star formation. Putting these together gives a relationship between the radio luminosity and the mean star formation rate over the past yrs (the lifetime of the relativistic synchrotron electrons), , of:
| (1) |
In the following subsections this relation will be used to compare the radio source population with various other classes of cluster galaxies. In subsection 5.1 the comparison between the cluster radio sources and the Butcher–Oemler population is considered. The correlation of the cluster radio sources with interacting and merging galaxies is investigated in subsection 5.2, and the correlation with emission line strengths is discussed in subsection 5.3. The cluster radio source radio luminosity distribution is discussed in subsection 5.4.
5.1 Correlations with galaxy colours
As discussed in the introduction, an increased proportion of bluer ‘Butcher Oemler’ galaxies, which are believed to have on–going or recently terminated star formation, are found in high redshift clusters. To investigate the radio emission from this ‘Butcher Oemler’ population in MS105403, the 10 cluster galaxies with colours bluer than (excluding the blue Sc galaxy MS1054C5 which already lies within the radio source sample) were selected from the colour–magnitude diagrams of van Dokkum et al. [2000], and the mean radio emission from these was calculated. Only one of the galaxies was individually detected above the level, and that only at ; the combined flux density from all ten galaxies was Jy, again only a 1.5 level detection. The measured mean radio flux density corresponds to yr-1, which is consistent with the star formation rates necessary to bluen the galaxy colours by this amount. The current radio observations are not deep enough to detect typical star–forming galaxies, but only extreme starbursts or AGN activity.

Approaching this issue from the other side, in Figure 4 is presented an F814WF606W () vs F814W () colour–magnitude diagram for all of the early–type confirmed cluster galaxies, with the radio galaxies indicated as filled triangles, and the close pairs further indicated by a large circle. Excepting galaxy 5534 (one of the close pair of galaxies associated with MS1054C3) all of the galaxies associated with the radio sources have colours consistent with the colour–magnitude relation of the other early–types in the cluster. This suggests that their radio emission is not due to starburst activity, which would tend to bluen the galaxy colours, but rather with hidden AGN activity.
5.2 Correlations with galaxy–galaxy interactions
Of the 8 cluster radio sources, 4 are associated with pairs of cluster galaxies with projected separations of 10–25 kpc (1–2.5 arcsec), that are plausibly undergoing interactions (although in the case of MS1054C3 it must be noted that the velocity difference between the two galaxies in the pair is over 5000 km s-1, and so this must either be a chance projection or, if an interaction, the galaxy pair is unbound; for MS1054C6 although the second galaxy is not a spectroscopically confirmed cluster member, its magnitude and colour are very strongly indicative that it is). The galaxies comprising these pairs are of type S0/a or earlier in 7 of the 8 cases, and are within one magnitude of each other in luminosity. The probability of a chance projection at these magnitudes and separations is %, as discussed above.
Despite the apparent high proportion of ‘interaction–driven’ radio sources in the cluster, and the fact that the cluster is known to contain a very high proportion of confirmed binary galaxies and on–going mergers (galaxy nuclei separated by kpc), not a single one of the radio sources is associated with any of the 13 cluster objects classified ‘merger / peculiar’ by van Dokkum et al. [2000]. Indeed, none of these merging galaxies is detected above the 2 level in the radio map. This sets interesting limits on the radio luminosity associated with the cluster merger events: to provide tighter constraints, the radio emission was averaged across the locations of the 13 confirmed on-going mergers in the cluster, giving a mean flux density of Jy, only a 1.5 detection. Realistically then, the upper limit to the radio emission of the merger events is of order 5Jy which, at the redshift of the cluster, corresponds to a rest–frame 5 GHz radio luminosity of about W Hz-1. From equation 1, this sets a limit to any starburst accompanying the merger events in the MS1054 cluster, to a mean of order 10 yr-1. This suggests that the very red colours generally seen for the merging galaxies [1999] are simply the intrinsic colours of the galaxies, rather than being caused by a massive starburst heavily obscured by dust.
The high proportion of galaxy pairs among radio sources in the cluster and the absence of radio emission from on-going mergers implies that galaxy interactions may be more efficient than mergers at inducing radio activity. It is interesting to compare this result with that of Roche & Eales [2000] who found that the majority of a sample of powerful low redshift 3CR radio galaxies were visibly interacting, but that the mean projected separation of the interacting pairs was kpc. This is about three times larger than that of interacting ultraluminous infrared galaxies. From this they concluded that radio bursts occurred at a much earlier stage of an interaction / merger than the peak of the starburst activity.
5.3 Correlations with emission line luminosity
5.3.1 Line emission from star formation or AGN activity
In the absence of high resolution radio observations or radio spectral indices to distinguish starbursting galaxies from AGN, a separation between the two classes can still be made based upon to ratio of the radio to the emission line luminosity of the host galaxies. When combined with optical morphologies and optical spectral properties this division can be made with a fair degree of accuracy (e.g. Owen et al 1999).
Very massive stars emit photons with high enough energy to ionise their surrounding gas, leading to a theoretical correlation [1997] between the [OII] 3727 emission line luminosity and the mean star formation rate over the past years (the approximate lifetime of such massive stars):
| (2) |
In practice, however, use of the [OII] 3727 emission line as an estimator of star formation is fraught with problems (e.g. Hopkins et al 2001, Adelberger & Steidel 2000, Kennicutt 1998 and references therein), the most important of which is dust extinction which causes the star formation rate to be underestimated. These problems can, however, be mostly ignored if the level of accuracy required is only that to separate radio sources into starbursting galaxies or AGN. The above conversion is therefore adopted, but with an allowance for optical extinction. Assuming that the average star formation rate over the past years (sampled by the radio emission due to the synchrotron lifetime) is the same as that over the past years (sampled by the [OII] line emission), then equations 1 and 2 give a crude relationship between the observed 5 GHz radio flux density and the observed [OII] 3727 emission line flux for a star forming galaxy at redshift 0.83:
| (3) |
where is the fraction of light transmitted (not extincted) at 3727Å. The scatter in both of the line luminosity to star formation rate and radio luminosity to star formation rate relations, and the different star formation timescales that the two relations sample, will provide further scatter around this relation.
No comparable relation is known between the [OII] 3727 and radio luminosities for AGN at these radio luminosities, although the two properties are well correlated over several orders of magnitude, albeit with up to an order of magnitude of scatter, for more powerful radio galaxies (see Figure 3 of Willott et al. 1999); if this relation can be extrapolated down in luminosity then, converting the 151 MHz radio luminosity to a 5 GHz radio luminosity assuming a spectral index of 0.8:
| (4) |
It is not clear whether such an extrapolation is valid; for example, Gruppioni et al [1999] find that a significant proportion of sub-mJy radio sources show only absorption lines and no emission lines. Irrespective of the precise details, however, the critical point is that for a given radio flux density the expected emission line flux if the radio emission is produced by an AGN is at least 100–1000 times lower than if it is associated with star formation. A radio source with Jy will only have detectable [OII] 3727 line emission if at least some of the radio emission is due to star formation.
5.3.2 The nature of the cluster radio sources
Only three of the eight cluster radio sources (MS1054C1, C5, C14) are emission line galaxies (defined as [OII] equivalent width Å; van Dokkum et al. 2000): MS1054C1 has an [OII] 3727 equivalent width of Å, MS1054C5 has Å and MS1054C14 has Å. Using the continuum magnitudes and colours from the HST observations to provide continuum calibration of the spectra, the [OII] 3727 fluxes of these three sources are compared to their radio fluxes in Figure 5. The other five radio galaxies are similarly plotted, taking upper limits to the [OII] 3727 equivalent width of 5Å. Also indicated on the figure is the relation for starburst galaxies derived in Equation 3, with the shaded region representing the effect of up to two magnitudes of optical extinction. The extrapolated relation for AGN is also indicated, although once again it must be stressed that this relation is only indicative.
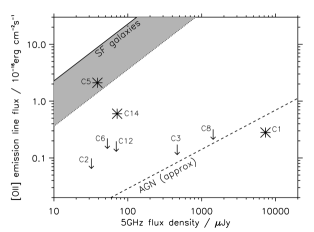
It is clear from Figure 5 that MS1054C1 is an AGN, as would be expected from its extreme radio luminosity. Equally, MS1054C5 lies well within the region of the plot predicted for star forming galaxies. Its radio flux density corresponds to a star formation rate of nearly yr-1; its morphology and colour are consistent with a high current star–formation rate. MS1054C14 lies between the AGN and starburst regions, and so the origin of its radio emission is less clear. This is likely either a heavily extincted starburst or a combination of AGN and star formation. The other five cluster galaxies all have upper limits to their emission line luminosity which place them well below the star formation region. The spectra of all five of these galaxies appear as typical elliptical galaxies. In two cases an extended radio source has been produced, so these must be AGN; for the other three, although a heavily obscured nuclear starburst cannot be excluded from these sources, similar low luminosity radio sources in red ellipticals are found in low redshift clusters and are seen to be weak AGN [1999]. We conclude that these 5 sources are all likely to be weak AGN.
Summarising, of the four radio sources associated with isolated galaxies, 2 are AGN, 1 is a starburst, and 1 is unclear. This is consistent with the % starburst contribution at these luminosities which has been both predicted on the basis of radio source count modelling (e.g. Wall and Jackson 1997, Hopkins et al. 2000), and observed in deep observations of the Hubble Deep Field [1998]. However, all four of the radio sources associated with galaxy pairs appear to be AGN, and if confirmed then the overall AGN fraction amongst the cluster sources would be %, inconsistent with field observations at these flux density levels. The most likely explanation for this is that the isolated cluster radio sources discussed above are essentially an extension of the field population, but that the galaxy pair radio sources represent a different population: interactions between early–type galaxies, inducing weak AGN activity, are unlikely to occur at a high rate in the field simply because of the sparsity of early–types, and so this population may be fairly unique to high redshift cluster environments.
5.3.3 Cluster emission line galaxies
None of the sources that van Dokkum et al. [2000] classified as emission line galaxies (many of which also fall within the merger or blue galaxy categories) are detected above the level in the radio map apart from the three sources discussed above (C1, C5 and C14). The most emission line luminous cluster galaxy, 1801, has ([OII]) erg cm-2s-1, predicting a Jy (3) radio flux density, although this is not detected in the radio maps. The mean radio emission of the emission line galaxies, Jy, corresponds to an upper limit of about yr-1 which is comparable to the mean star formation rate of these galaxies determined using Equation 2.
It is clear from these observations that radio surveys directly seek out both AGN and star–forming galaxies. A comparison with optical techniques demonstrates that at the current depth these observations are picking out the extreme end of the optically selected star–forming galaxies together with a population of low luminosity active galaxies that are not found using optical techniques. Still deeper observations will be required if typical star–forming galaxies are to be observed.
5.4 Cluster radio source luminosity distribution
Although the number of confirmed cluster radio sources in MS105403 is very small, it is still instructive to perform some simple comparisons with cluster radio populations at low redshift. Ledlow & Owen [1996] have determined the univariate and bivariate luminosity functions of radio sources in a sample of low redshift () clusters, from which can be determined the percentage of all elliptical galaxies brighter than absolute R–magnitude which host radio sources more luminous than a given radio luminosity. For a galaxy with the colour of a typical early–type galaxy at , and taking into account also the –magnitude change due to passive evolution of the stellar populations, this optical magnitude limit corresponds to an apparent magnitude through the HST F814W filter of .
Within 1 Mpc (168 arcsec) of the centre of MS105403 there are 23 early–type galaxies (no separation is made here between ellipticals and S0 morphologies, and 3 of the 6 galaxies classified as “S0/a”, ie uncertain S0 or Sa, are included) with magnitudes that are confirmed to be members of the cluster; the spectroscopic observations are currently over 80% complete to this magnitude limit. Of these cluster early–type galaxies, 5 show radio emission with a rest–frame 1.4 GHz luminosity above 23.1 W Hz-1 (again, including only 1 of the 2 S0/a classifications, and counting only one galaxy from each close pair). Given that the spectroscopic observations were taken prior to the radio observations, there is no reason to suspect that the spectroscopic targets in any way favour those with radio emission, and hence the fraction should be a fair estimate of proportion of radio loud early–type galaxies in the cluster. By comparison, Ledlow & Owen [1996] found that only 5.8% of elliptical galaxies (and hence an even lower percentage of all early–type galaxies since very few of their S0’s were radio emitting) in low redshift clusters have radio luminosities above this level. Clearly there is an excess of radio sources in this high redshift cluster compared to low redshift clusters. However, this increase is only comparable to that found in the field: Hammer et al [1995] found that the corresponding fraction for field ellipticals is of order a third.
Studying the Virgo cluster, Gavazzi & Boselli [1999] have shown that late type galaxies of all Hubble types are equally likely to develop radio sources, with a probability proportional to the optical luminosity of the galaxy. Only two of the radio sources are unambiguously identified with late–type cluster galaxies (MS1054C1 and C5), but it is instructive that these are indeed two of the most luminous late–type galaxies in the cluster (cf. van Dokkum et al. 2000).
As was discussed in the introduction, a deep radio survey of two Abell clusters revealed a bimodality in the distribution of radio source luminosities in that cluster (see Figure 6a), with the prevalence of the weaker radio source population providing a measure of the state of activity of the cluster [1999]. Those galaxies classified as AGN by Owen et al [1999] have been shaded in the histogram: the more luminous radio source population is comprised entirely of AGN, whilst the weaker population provides a mixture of AGN and starbursts. Smail et al. [1999] studied the cluster CL0939+4713 at , and their results are similarly plotted in Figure 6b. In Figure 6c is reproduced the histogram of radio luminosities of radio sources in the MS105403 cluster, converted from 5 GHz to 1.4 GHz rest–frame assuming a spectral index of 0.8. The radio detection limit of each of the three clusters is indicated.
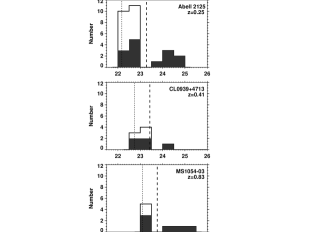
Whilst it cannot be over-stressed that these latter two clusters contain very small numbers of confirmed cluster galaxies, it is of note that both are consistent with the Abell 2125 distribution in the sense of being plausibly bimodal, with the more luminous population consisting entirely of AGN and the less luminous population being both AGN and starburst galaxies. Further the break in luminosity between the two populations may evolve to higher luminosities as we move to higher redshifts: certainly the starburst galaxies detected in MS105403 are of higher radio luminosity than any detected in the low redshift cluster. There are far too few cluster radio sources to attempt to quantify whether, and how quickly, any such evolution occurs. However, it is intriguing that the luminosity evolution which matches the evolution of the luminosity functions of many different types of active galaxies (e.g. radio sources – Dunlop & Peacock 1993; optically–selected quasars – Maloney & Petrosian 1999; X-ray sources – Boyle et al. 1993) fits the observations rather well.
6 Conclusions
Deep radio imaging of the cluster MS105403 has revealed a population of cluster radio sources. Eight radio sources are associated with galaxies that are already spectroscopically confirmed cluster members. This corresponds to approximately 22% of early–type confirmed cluster galaxies with within 1 Mpc of the cluster centre having rest–frame 1.4 GHz luminosity above 23.1 W Hz-1. The cluster radio sources fall into two distinct categories. 4 sources are hosted by isolated galaxies which have a range of morphologies from ellipticals to Sc galaxies; the radio emission appears to be associated with a starburst in at least one case, and AGN activity in two. The other four cluster radio sources are associated with close pairs of galaxies, possibly interacting, although not all bound systems. 7 of the 8 galaxies comprising these pairs are of type S0/a or earlier, and the radio emission from these galaxy pairs is almost certainly nuclear in origin. This % proportion of AGN in the cluster is in contrast to the field, where % of radio sources at this flux density level are associated with starburst galaxies. Considering the isolated cluster radio galaxies alone, these are consistent with the field distribution and may essentially be an extension of it, with the radio sources associated with galaxy pairs being a new AGN population, driven by early–type galaxy interactions, and thus fairly unique to high redshift cluster environments.
MS105403 is a cluster which contains a high proportion of on–going mergers. However, although up to 50% of the confirmed cluster radio sources appear to be interaction driven, none are associated with the confirmed merger events, and the upper limit to the mean radio luminosity of these merger events is of order W Hz-1, comparable to that of M82. It appears that galaxy–galaxy interactions may be more efficient than direct mergers at inducing radio emission.
Although the sample of confirmed cluster radio sources is small (8), the cluster radio luminosity function shows a hint of bimodality, mirroring that observed in the low redshift cluster Abell 2125, with a possible increase in the break luminosity with redshift.
Clearly to investigate these issues further, spectroscopic redshifts for the remainder of the radio sources in the sample will be required, together with deep radio surveys of a larger sample of distant clusters to improve the statistics and confirm the results suggested here.
Acknowledgements
The National Radio Astronomy Observatory is operated by Associated Universities Inc., under co-operative agreement with the National Science Foundation. PNB would like to thank the Royal Society for generous financial support through its University Research Fellowship scheme. PGvD acknowledges support by NASA through Hubble Fellowship grant HF-01126.01-99A awarded by the Space Telescope Science Institute, which is operated by the Association of Universities for Research in Astronomy, Inc., for NASA under contract NAS 5-26555. We thank the referee for useful comments.
References
- [1995] Andersen V., Owen F. N., 1995, AJ, 109, 1582
- [1977] Baars J. W. M., Genzel R., Pauliny-Toth I. I. K., Witzel A., 1977, A&A, 61, 99
- [1997] Barbaro G., Poggianti B. M., 1997, A&A, 324, 490
- [1996] Bertin E., Arnouts S., 1996, A&A Supp., 117, 393
- [1993] Boyle B. J., Griffiths R. E., Shanks T., Stewart G. C., Georgantopoulos I., 1993, MNRAS, 260, 49
- [1978] Butcher H. R., Oemler A., 1978, ApJ, 219, 18
- [1992] Condon J. J., 1992, ARA&A, 30, 575
- [1990] Condon J. J., Yin Q. F., 1990, ApJ, 357, 97
- [1987] Djorgovski S., Davies M., 1987, ApJ, 313, 59
- [1998] Donahue M., Voit G. M., I G., Lupino G., Hughes J. P., Stocke J. T., 1998, ApJ, 502, 550
- [1987] Donnelly R. H., Partridge R. B., Windhorst R. A., 1987, ApJ, 321, 94
- [1984] Dressler A., 1984, ARA&A, 22, 185
- [1987] Dressler A., Lyndon-Bell D., Burstein D., Davies R. L., Faber S. M., Terlevich R., Wegner G., 1987, ApJ, 313, 42
- [1997] Dressler A., Oemler A., Couch W. J., Smail I., Ellis R. S., Barger A., Butcher H., Poggianti B. M., Sharples R. M., 1997, ApJ, 490, 577
- [1999] Dressler A., Smail I., Poggianti B. M., Butcher H., Couch W. J., Ellis R. S., Oemler A., 1999, ApJ Supp., 122, 51
- [1993] Dunlop J. S., Peacock J., 1993, MNRAS, 263, 936
- [1999] Dwarakanath K. S., Owen F. N., 1999, ApJ, 118, 625
- [1974] Fanaroff B. L., Riley J. M., 1974, MNRAS, 167, 31P
- [1991] Fomalont E. B., Windhorst R. A., Kristian J. A., Kellerman K. I., 1991, AJ, 102, 1258
- [2000] Garrett M. A., de Bruyn A. G., Giroletti M., Baan W. A., Schilizzi R. T., 2000, A&A, 361, 41
- [1999] Gavazzi G., Boselli A., 1999, A&A, 343, 86
- [1990] Gioia I. M., Maccacaro T., Schild R. E., Wolter A., Stocke J. T., Morris S. L., Henry J. P., 1990, ApJ Supp., 72, 567
- [1999] Giovannini G., Tordi M., Feretti L., 1999, New Astronomy, 4, 141
- [1999] Gruppioni C., Mignoli M., Zamorani G., 1999, MNRAS, 304, 199
- [1972] Gunn J. E., Gott J. R., 1972, ApJ, 176, 1
- [2001] Haarsma D. B., Partridge R. B., Windhorst R. A., Richards E. A., 2001, ApJ, 544, 641
- [1995] Hammer F., Crampton D., Lilly S. J., Le Fèvre O., Kenet T., 1995, MNRAS, 276, 1085
- [2000] Hopkins A., Windhorst R., Cram L., Ekers R., 2000, Experimental Astronomy, 10, 419
- [2001] Jeltema T. E., Canizares C. R., Bautz M. W., Malm M. R., Donahue M., Garmire G. P., 2001, ApJ, in press; astro-ph/0107314
- [1996] Ledlow M. J., Owen F. N., 1996, AJ, 112, 9
- [1998] Madau P., Pozzetti L., Dickinson M., 1998, ApJ, 498, 106
- [1999] Maloney A., Petrosian V., 1999, ApJ, 518, 32
- [2001] Miller N. A., Owen F. N., 2001, AJ, 121, 1903
- [1999] Muxlow T. W. B., Wilkinson P. N., Richards A. M. S., Kellerman K. I., Richards E. A., Garrett M. A., 1999, New Astron. Rev., 43, 623
- [1999] Owen F. N., Ledlow M. J., Keel W. C., Morrison G. E., 1999, AJ, 118, 633
- [1998] Pascarelle S. M., Lanzetta K. M., Fernández-Soto A., 1998, ApJ, 508, L1
- [2000] Poggianti B. M., Smail I., Dressler A., Couch W. J., Barger A. J., Butcher H., Ellis R. S., Oemler A., 2000, ApJ, 518, 576
- [1998] Richards E. A., Kellermann K. I., Formalont E. B., Windhorst R. A., Partridge R. B., 1998, AJ, 116, 1039
- [2000] Roche N., Eales S. A., 2000, MNRAS, 317, 120
- [1997] Schade D., Barrientos L. F., Lopez-Cruz O., 1997, ApJ, 477, L17
- [1999] Smail I., Morrison G., Gray M. E., Owen F. N., Ivison R. J., Kneib J.-P., Ellis R. S., 1999, ApJ, 525, 609
- [1998] Stanford S. A., Eisenhardt P. R., Dickinson M., 1998, ApJ, 492, 461
- [1999] Stocke J. T., Perlman E. S., Gioia I. M., Harvanek M., 1999, AJ, 117, 1967
- [1982] Tammann G. A., 1982, in rees M. J., Stoneham R. J., eds, Supernovae: a survey of current research. Dordrecht: Reidel, p. 371
- [2000] van Dokkum P. G., Franx M., Fabricant D., Illingworth G. D., Kelson D. D., 2000, ApJ, 541, 95
- [1999] van Dokkum P. G., Franx M., Fabricant D., Kelson D. D., Illingworth G. D., 1999, ApJ, 520, L95
- [1998a] van Dokkum P. G., Franx M., Kelson D. D., Illingworth G. D., 1998a, ApJ, 504, L17
- [1998b] van Dokkum P. G., Franx M., Kelson D. D., Illingworth G. D., Fisher D., Fabricant D., 1998b, ApJ, 500, 714
- [1997] Wall J. V., Jackson C. A., 1997, MNRAS, 290, L22
- [1999] Willott C. J., Rawlings S., m. Blundell K., Lacy M., 1999, MNRAS, 309, 1017
- [1995] Windhorst R. A., Formalont E. B., Kellermann K. I., Partridge R. B., Richards E., Franklin B. E., Pascarelle S. M., Griffiths R. E., 1995, Nat, 375, 471
- [1993] Windhorst R. A., Formalont E. B., Partridge R. B., Lowenthal J. D., 1993, ApJ, 405, 498
- [1985] Windhorst R. A., Miley G. K., Owen F. N., Kron R. G., Koo D. C., 1985, ApJ, 289, 494
- [1984] Windhorst R. A., van Heerde G., Katgert P., 1984, A&A Supp., 58, 1
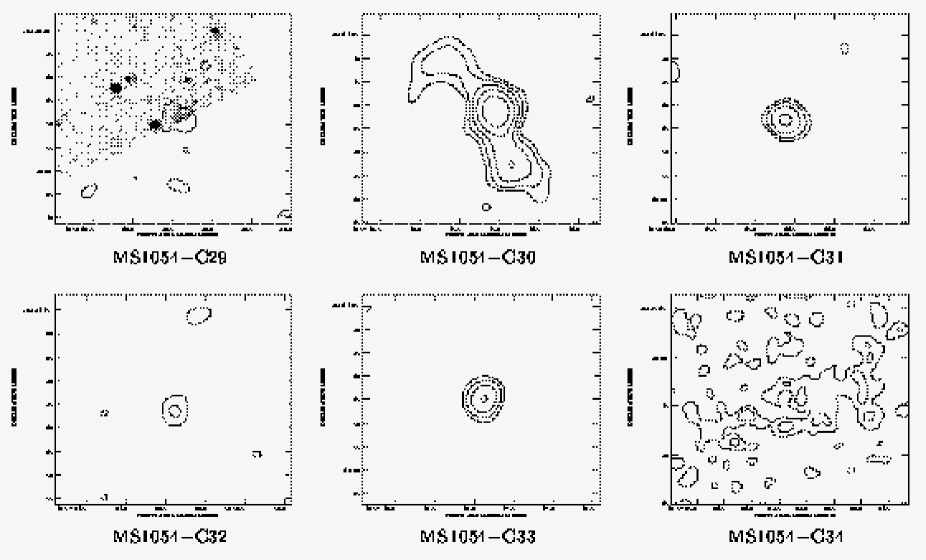
Appendix A The individual sources
In this appendix the nature of each individual source is discussed, ordered by radial distance from the centre of the cluster, and radio contour maps of the field of each source are displayed in Figure 7. For those radio sources which lie within sky area of the HST mosaic, the radio sources are shown overlaid upon a greyscale representation of the F814W () image. In each case the greyscale range is exactly the same, so the relative brightness of the objects can be compared to that of the brightest cluster galaxy, visible in the MS1054C1 field. Those radio sources which lie outside of the HST mosaic but within the larger field of the FORS imaging are shown overlaid upon the band image, the greyscale range of the latter being adjusted to be at comparable levels to that of the F814W image greyscales. The remaining 9 sources which lie outside of the FORS fields are simply displayed as radio contour plots.
Details of the individual sources are as follows:
MS1054–C1: First detected in the shallower imaging of Stocke et al. [1999], this bright radio source is associated with a confirmed cluster Sc galaxy. This galaxy is projected close to the cluster centre (the elliptical galaxy visible 6.4 arcsec east and 8.3 arcsec south of this galaxy is the central cluster galaxy) although offset in velocity by over 2000 km s -1. Its high radio luminosity ( W Hz-1) indicates that the radio emission must be associated with AGN activity, and the radio to emission line flux density ratio confirms this (Figure 5).
MS1054–C2: The most tenuous radio detection in the sample, this radio emission arises from the vicinity of three optically detected galaxies, two of which are confirmed cluster members projected less than 20 kpc apart, and the third of which lies at higher redshift (). It is unclear whether the emission is associated with just one of the galaxies, or with more, perhaps from a combination of two cluster galaxies due to an interaction.
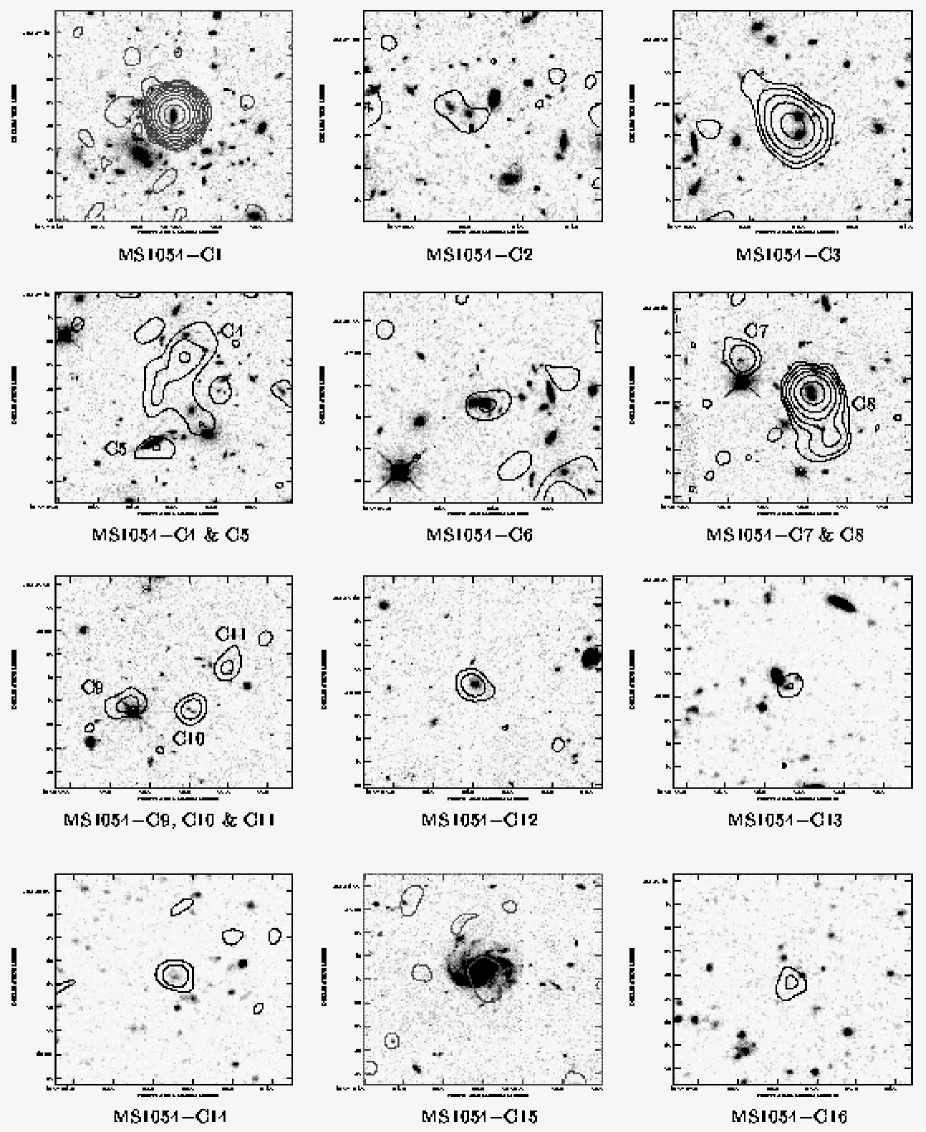
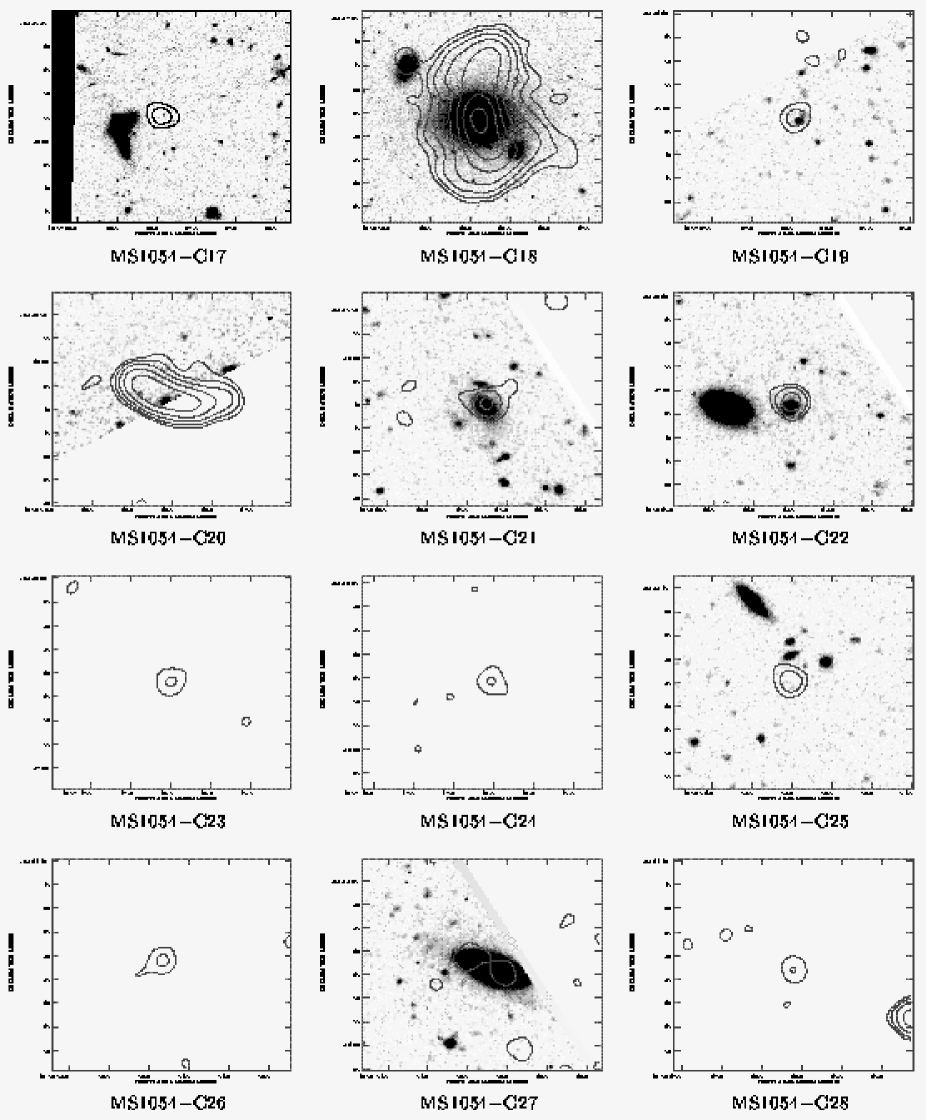
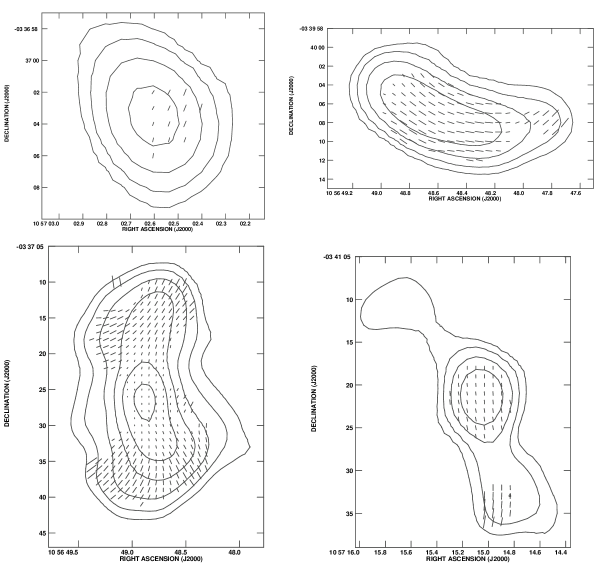
MS1054–C3: This relatively bright radio source was also detected in the shallower observations of Stocke et al. [1999]. It lies between two confirmed cluster galaxies, not especially consistent with the location of either (though note that the position determined by Stocke et al. places it closer to the southern galaxy). The two galaxies may be interacting, separated by a projected distance of only 17 kpc, although the colours of both galaxies are red: one galaxy lies on the ‘passive–evolution’ colour–magnitude relation and the other is about 0.2 magnitudes bluer than this (Figure 4). The radio source is extended by of order the separation of the two galaxies, and shows a marginal detection of polarisation (see Figure 8), indicating that the radio emission is likely to have an AGN origin.
MS1054–C4: This extended region of radio emission has no obvious optical counterpart in the deep HST images. Its nature is unclear, although its luminosity and radial offset from the cluster centre are both consistent with it being a cluster relic radio source: these are diffuse radio sources found occasionally in clusters, associated with no particular parent galaxy (e.g. Giovannini et al 1999 and references therein). Their origin is still uncertain.
MS1054–C5: This region of weak radio emission appears to be separate from the extended source MS1054C4, although it cannot be ruled out that these form part of the same source. Far more likely is that this emission is associated with starbursting activity in the cluster Sc galaxy projected only 1.2 arcsec away: as shown in Section 5.3, the radio luminosity of the source is very close to that which would be predicted on the basis of the emission line luminosity of this Sc galaxy, assuming both to be associated with on–going star formation.
MS1054–C6: This radio emission is associated with a confirmed cluster elliptical galaxy, whose isophotes overlap with a second elliptical galaxy of comparable magnitude and colour (but unknown redshift). Other fainter galaxies are observed close-by. If the second elliptical galaxy is also a cluster member, then the radio emission is likely to have been induced by galaxy–galaxy interaction.
MS1054–C7: Although there is a small possibility that this radio emission forms part of the extended radio source MS1054C8, it appears to be a separate radio source associated with a 22nd magnitude galaxy, whose redshift is currently unknown.
MS1054–C8: This bright radio source was first detected by Stocke et al. [1999] and is associated with two galaxies both of which are confirmed cluster members with a projected separation of 11 kpc. These galaxies may be interacting, but do not show any features that would cause them to have been classified as a merger by van Dokkum et al. [1999]. The extended structure of this AGN is consistent with a core–jet source. A core–dominated (ie. beamed) quasar is unlikely since neither of the associated galaxies has magnitudes or colours indicating a strong nuclear component.
MS1054–C9: This unresolved weak radio source has no obvious optical identification on the deep HST mosaic, although the location of the source, on the diffraction spike of a nearby 19th magnitude star, may have precluded any faint optical galaxy from being identified on the HST image. This star provides the entry in Table 3, but is unlikely be the true radio source host given the radio–optical offset.
MS1054–C10: A pair of very faint () blue galaxies is seen at the location of this radio source, although redshifts are not available for either of them.
MS1054–C11: The 23rd magnitude galaxy which lies within half an arcsecond of the position of this weak radio source has no measured redshift.
MS1054–C12: This unresolved radio source is unambiguously identified with an early type galaxy at the redshift of the cluster.
MS1054–C13: This radio source corresponds to a 22nd magnitude Sab galaxy of unknown redshift. The brighter galaxy a few arcsec to the north–east of the radio source has a redshift of , and is unlikely to be related.
MS1054–C14: This radio source is associated with a diffuse optical galaxy at the cluster redshift.
MS1054–C15: This weak extended radio emission appears to be associated with a bright spiral galaxy at redshift 0.25. The measured flux density corresponds to a radio luminosity of W Hz-1, similar to that of M82.
MS1054–C16: No optical counterpart brighter than is seen associated with this unresolved radio source.
MS1054–C17: At the location of this radio source there is only a marginal detection of an extremely faint galaxy ().
MS1054–C18: This luminous extended radio source, which has an edge–darkened structure compatible with being an FR I type source [1974] is associated with a low redshift () elliptical galaxy which has a second galaxy projected 3 arcsec away to the NNE (within the saturated region of the presented greyscale), almost certainly undergoing an interaction. The radio source is quite strongly polarised (see Figure 8) with a well–ordered polarisation structure along the source axis in the central regions but perpendicular to this at the extremities.
MS1054–C19: An optical galaxy lies within half an arcsecond of the position of this possibly resolved radio source, but its redshift is unknown.
MS1054–C20: This extended source could have either FR I or head–tail structure and shows strong polarisation throughout, parallel to the extended radio structure (Figure 8). It lies at the very edge of the optical frame, but appears to have an associated optical counterpart.
MS1054–C21: A galaxy at redshift lies roughly coincident with this weak unresolved radio source. The corresponding rest–frame 5 GHz radio luminosity is W Hz-1, consistent with the radio emission being associated with star formation activity.
MS1054–C22: This unresolved radio source has a relatively unambiguous optical counterpart which has not been observed spectroscopically.
MS1054–C23: This unresolved radio source lies outside the field of the optical images.
MS1054–C24: This unresolved radio source lies outside the field of the optical images.
MS1054–C25: No optical counterpart is seen at the location of this radio source.
MS1054–C26: This unresolved radio source lies outside the field of the optical images.
MS1054–C27: A low redshift spiral galaxy is clearly the source of this extended radio emission. Although the galaxy has not been observed spectroscopically, its bright magnitude suggests a low redshift, implying that the radio emission is likely to be associated with on-going star formation.
MS1054–C28: This unresolved radio source lies outside the field of the optical images.
MS1054–C29: This radio source is possibly resolved and lies at the very edge of the optical image. An optical galaxy partially seen at the edge of the image appears to be associated with it.
MS1054–C30: Extending nearly half an arcminute on the sky, this radio source is clearly brightest at its centre and probably has FR I structure, although an FR II structure with a bright radio core cannot be excluded. The central radio region is highly polarised, with the electric field vectors lying parallel to the extended radio structure. The radio source lies outside the field of the optical images.
MS1054–C31: This unresolved radio source lies outside the field of the optical images.
MS1054–C32: This unresolved radio source lies outside the field of the optical images.
MS1054–C33: This unresolved radio source lies outside the field of the optical images.
MS1054–C34: A large diffuse area of radio emission, extending an arcminute or more, is detected at this location. It lies outside of the optical frames, and no luminous nearby galaxies are seen in the digitized sky catalogues at this location, so its nature remains unclear. One possibility again is that this is associated with a cluster relic radio source; although it is found much further from the centre of the cluster (2.2 Mpc) than is typical for these sources, such large radii relics have been observed before (e.g. in Abell 2345; Giovannini et al. 1999).