Abstract
We present preliminary results from an ongoing program devoted to a study of small scale structure in the spatial distribution of molecular gas. Our work is based on multi-epoch FUSE and visible observations of HD34078. A detailed comparison of H2, CH and CH+ absorption lines is performed. No short term variations are seen (except for highly excited H2) but long-term changes in N(CH) are clearly detected when comparing our data to spectra taken about 10 years ago.
Small scale structure in diffuse molecular gas
from repeated FUSE and visible spectra of HD 34078
1
Ecole Normale Supérieure/Observatoire de Paris, France
2I.A.P., 98 bis Bd Arago, Paris
3DAEC, Observatoire de Paris-Meudon
4Laboratoire d’Astronomie Spatiale, Marseille, France
5John Hopkins University, Baltimore, USA
1 Introduction
The small scale distribution of molecular species in translucent and opaque clouds is still poorly characterized as compared to structure in the atomic phase (see the paper by J. Lauroesch in these proceedings). To complement the scarce data available on minor tracers like H2CO, OH, HCO+ ([6], [4]), we have undertaken an observational program devoted to a simultaneous study of small scale variations in the column density of various molecular and atomic species, including the major ones, H2 and HI.
A bright, large proper motion star, HD 34078, has been selected for repeated observations in the far-UV with FUSE, and in the visible range, at the Observatoire de Haute-Provence. Due to the large transverse velocity of this target (100km/s), the line of sight is drifting through the foreground material (E(B-V) = 0.52) at a velocity of about 17 AU/yr. Thus, observations separated by an interval ranging from about one month to a few years provide information on structure at scales 1 - 50 AU. Further, HD 34078 has been the subject of detailed studies in the past and several high S/N and resolution spectra have been obtained ([1], [2], [3]). By comparison with our recent ones, scales as large as 200 AU can then be probed for species like CH and CH+.
The main properties of the absorbing material along the sightline towards HD 34078 are discussed in Le Petit et al. (these proceedings). In this paper, we focus on absorption line and present a preliminary analysis of H2 features in the three FUSE cycle 1 spectra and of the variations of visible CH and CH+ absorption lines.
2 Observations and data analysis
The FUSE spectra were obtained in january 2000, october 2000 and february 2001. The data have been processed using the FUSE pipeline software. Individual exposures were co-added in a standard manner. For each epoch, the total integration time is about 6500s; the S/N ratio reached in the LiF1A data that we will use here is about 30 per 15 mÅ pixel. Seven visible spectra were obtained between november 1999 and february 2001 at the Observatoire de Haute Provence (O.H.P.) with the echelle spectrometer, ELODIE, mounted on the 1.93m telescope. The spectral resolution is about 10km/s; the typical S/N ratio is 150 per .03 Å pixel. A spacing of about one month was adopted first but since CH and CH+ lines looked quite stable, only two spectra were taken next winter.
In FUSE spectra, a large number of transitions are available to study column density variations but in fact, only a few of them are suitable for a sensitive search for variations. Indeed, since profiles are not resolved by FUSE, the equivalent width of lines falling on the flat part of the curve of growth are insensitive to N variations. The situation is favorable in two cases: a) marginally thin lines (0.5 3 where is the opacity at line center) and b) damped lines. For species which are likely to display the same b value as CH (about 3 km/s), case a) corresponds to lines with W ranging from roughly 10 to 50 mÅ. H2 lines from high excitation levels, CH and CH+ lines fall into this category. Case b) corresponds to Ly or the strongest J = 0, 1, 2 H2 lines. It can be shown easily that the difference between two damped profiles is maximum where the normalised intensity equals 0.36; typically, for a 10% N variation, the expected difference is 0.04. Thus, a definite signature is expected for such lines, which should be easily detectable in good quality spectra if N is large enough. Obviously, some care has to be taken concerning instrumental effects which might induce apparent line variations but using several transitions from the same species or data from different FUSE segments can be used to solve these potential difficulties.
3 Results
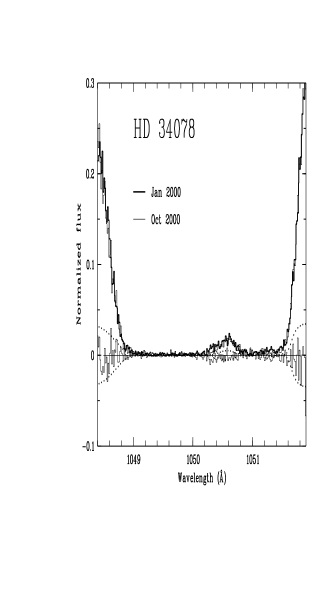
H2: the first goal of our project is to estimate the fluctuations of the total H2 column density. We thus need to study lines from the J = 0, 1 and 2 states. Several damped lines originating from these levels and with good S/N profiles are present in our spectra. These features appear blended in systems but generally, the blue or red wing is primarily due to one specific transition (for instance, in the system around 1050Å shown in Fig. 1, the blue wing is due mostly to the J = 0 transition); blends with other lines also restricts the range to be used. Before comparing profiles from distinct epochs, we first adjust the wavelength scales by applying a uniform shift. Second, we adjust the flux level in intervals free of absorption using one single multiplicative factor. As can be seen in Fig. 1 profiles look extremely similar; their difference shows no significant deviation from zero. For comparison, we show in Fig. 1 the difference expected if N(J = 0, 1 and 2) are varied by 10%. Our residuals are clearly well smaller ! We conclude that over the three epochs considered, a 2.5 upper limit on variations in N(J=0 and J=2) is 7%. This result suggests that N(H2) variations are smaller than those reported for H2CO and OH.
.
For the highest excitation H2 levels detected, lines become close to optically thin and we recover a good sensitivity to variations. We find some evidence for variations with W(oct. 2000) W(feb. 2001) W(jan. 2000). For instance, in the region around 1046 Å, large variations are seen for a feature at 1046.45 Å that we tentatively assign to H2(v=4, J=2); similarly, two features from H2 J=11 apparently show in the 2d and 3rd spectra a blueshift of about 10 km/s and a broader profile. By cross-correlating the behaviour of various lines from each level, we should be able to reach firm conclusions on the reality and magnitude of these variations. As discussed by Le Petit et al. in this volume, variable excited H2 lines could be due to instabilities in the shocked gas at the HD34078’s wind - ambient medium interface.
CH and CH+: no small scale variations are detected in our homogeneous set of OHP spectra. The excellent S/N reached on the CH4300 line allows us to set a 3 limit on relative column density fluctuations N/N 6% for scales in the range 1 - 20AU. Thus, we do not find evidence for the kind of ubiquitous structure seen for OH and H2CO [6].
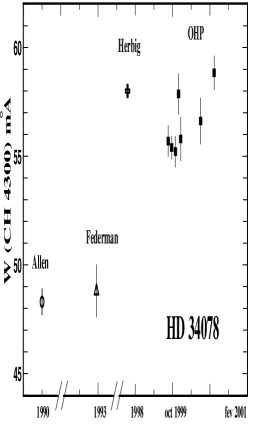
However, comparing our results with those obtained several years ago ([1], Federman, private communication, [3]), we find that W(CH4300) has increased by about 18% between 1993 and 1998 as illustrated by Fig. 2 (this interval corresponds to about 100 AU). It is noteworthy that, from the analysis of the damped Ly profile (blended with H2 lines), we get an estimate of the HI column density, N(HI) = 2.51 1021 cm-2, which is 38% higher than the value derived from 1979 IUE data, N(HI) = 1.82 1021 cm-2 ([5]; the time interval corresponds to about 300 AU).
Regarding CH+, we get a less stringent limit on small scale variations N/N 15% and do not find evidence for a similar large scale variation.
Let us conclude with a few prospects. The coming cycle 2 and 3 FUSE spectra will clearly allow us to improve the sampling and to extend the range of scales probed. Thus, we will be more sensitive to a small regular variation (i.e. of N(H2, J=0 or 1)). Additional spectra will also help to establish the reality of variations suspected for the weak lines of highly excited H2, and quantify the magnitude of these changes. Finally, we note that HST/STIS spectra would complement these FUSE data in a very useful way because a) the HST range comprises a lot of vibrationally excited H2 transitions; b) given the spectral resolution of STIS, most of these lines would appear unblended; c) changes in the kinematics of the excited H2 would be much more apparent.
Acknowledgments: We are grateful to Steve Federman for communicating his 1993 W(CH4300) measurement and to Jim Lauroesch who kindly provided us with a co-added Copernicus Oph spectrum.
References
- [1] Allen M. M. 1994, ApJ, 424, 754
- [2] Federman S. R., Strom C. J., Lambert D. L., Cardelli J. A., Smith, V. V., Joseph, C. L. 1994, ApJ, 424, 772
- [3] Herbig G. H. 1999, PASP, 111, 809
- [4] Liszt H. & Lucas R. 2000, A&A 355,333
- [5] McLachlan A., Nandy K. 1984, MNRAS, 207, 355L
- [6] Marscher A. P., Moore E.M., Bania T.M. 1993, ApJ 419, L101