XMM-Newton First Observation in the Pleiades
Abstract
We present the first results from a 40 ks Guaranteed Time XMM-Newton pointing in the Pleiades. We detect almost all early–mid dM members in the field and several very low mass (VLM) stars – including the brown dwarf (BD) candidate Roque 9 – and investigate the variation of X-ray activity levels, hardness ratios and flare frequency with spectral type down to the BD regime.
X-ray Astronomy Group, Department of Physics and Astronomy, University of Leicester, Leicester, LE1 7RH, UK
1. Introduction
The Pleiades is key to our understanding of stellar activity and its evolution, being the closest rich sample of stars at Myr old. The core of the cluster was surveyed by ROSAT PSPC (Stauffer et al. 1994; Hodgkin, Jameson, & Steele 1995: HJS95; Gagne, Caillaut & Stauffer 1995: GCS95; Micela et al. 1996) and HRI (Micela et al. 1999: M99), studying the X-ray characteristics of members down to the mid-M dwarfs (). The non-detection of fainter Pleiads suggested such fully-convective stars, thought unable to harbour a solar-like magnetic dynamo, have lower activity levels.
Our single pointing covers a smaller area, but XMM-Newton (Jansen et al. 2001) enables us to probe deeper, over a wider energy range, with better angular and energy resolution than the PSPC, and with continuous time coverage. In addition, recent infrared CCD surveys (e.g. Pinfield et al. 2000) have extended membership lists to substellar objects. Here, we pursue the X-ray properties of Pleiads into the fully-convective regime.
2. Data Analysis and Membership Catalogue
Our observation was centred on the BD Teide 1 (03 47 18 +24 22 31 J2000) and performed on 1st September 2001 with the Thick filter in place in each telescope. The data were processed using SAS v5.0 and filtered for hot pixels and background flaring events, yielding 39.9 and 32.7 ks of good data in the EPIC PN and each MOS detector respectively. Images were extracted with binsize 4′′ in three energy bands (A: 0.3–0.8; B: 0.8–1.5; C: 1.5–4.5 keV) for each EPIC instrument.
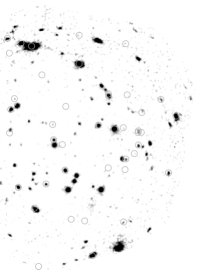
We constructed a list of members in the EPIC field of view from the catalogues of Belikov et al. (1998; B98) and Pinfield et al. (2000; P00), that are reckoned to be ‘complete’ to and respectively (Fig. 1). For each instrument, the triad of images was searched at the optical positions of these members using the Maximum Likelihood (ML) PSF-fitting routine EMLDETECT (v4.2.2) with a ML threshold of 12 (). Simulations yielded an estimate of false detection among our 51 members using this procedure. For the undetected Pleiads in each image, upper limits were estimated from the background counts at the appropriate positions. Source counts were converted to on-axis count rates before X-ray luminosities were estimated assuming a distance of 127 pc, and conversion factors for each band consistent with a ‘Mekal’ plasma at keV with cm-2. Temperatures in the range 0.4–1.0 keV cause changes of and in PN and MOS conversion factors respectively. Henceforth, all luminosities are unabsorbed, in units of erg s-1.

3. Results and Discussion
The PN detection threshold varies from on-axis to near the field edge. The detection rates as a function of spectral type are summarised in Table 1. If we exclude four B98 dM stars discounted by P00, we detect almost all early–mid dM stars. We detect several late dM stars: in particular there is a PN B-band-only detection from the BD candidate Roque 9. The chance of alignment with one of the faint hard sources (probably background AGN) visible in the X-ray image (Fig. 1) is . The of 27.7 is factor more than Neuhauser et al.’s (1999) upper limit on Teide 1, and the of is higher than the peak for Chandra’s detection of a flare on the 500 Myr old BD LP 944-20 (Rutledge et al. 2000). Roque 9 is poorly studied and the validity of both its X-ray detection and its membership need confirmation.
PN lightcurves in the 0.3–4.5 keV range were extracted at the position of each detected Pleiad using a radius of 20′′ and a binsize of 1 ks, and binned up to an average of counts per bin. A lightcurve was also extracted of the full, source-excluded field and scaled to the background level of each source position. Flares were defined as peaking at factor 2 above the quiescent level and non-flare-like variability was searched for using a test against constancy at the 95% confidence level (Fig. 2). Large flares occurred on the bright sources HII 1032 and HII 1100. Table 1 shows the variability and flaring rates as a function of spectral type. K stars appear to have the highest frequency of variability and flares, although we have lower sensitivity to variability for the low count rates of the dM stars.
| Spectral type | B/A | F/G | K | M0-M5 | M5 |
|---|---|---|---|---|---|
| Mag. range | & | ||||
| Number in field | 5 | 3 | 5 | 19 | 15 |
| Number confused | 0 | 0 | 0 | 2 | 2 |
| Number detected | 3 | 3 | 5 | 16 | 5 |
| Number variable | 1 | 1 | 3 | 8 | 0 |
| Number flaring | 0 | 1 | 3 | 4 | 0 |
Fig. 3a shows a general decrease of with absolute bolometric magnitude, , mainly due to smaller surface area, and hence available volume of X-ray-emitting plasma, with lower mass. Five flaring sources sit well above the general trend. It is clear that the ROSAT PSPC threshold of 28.5 prevented the detection of Pleiads with and lower-mass stars are capable of supporting hot coronae. There is a smaller scatter in than seen in the ROSAT results, but this is symptomatic of our smaller sample.


Fig. 3b demonstrates that although the X-ray luminosity decreases to later types, the activity level as measured by increases. SHJ95 found continued increasing to at the limit of their survey, and the majority of detected low-mass stars were above the canonical saturation level of , although a large number of upper limits caused the mean activity level to fall for . Fig. 3b shows our observation reaches the level for all bar the faintest stars in our membership list and very few objects stand above the saturation ceiling. The detections in the range and upper limits for indicate the mean activity level turns over and falls toward later types.


Fig. 4 indicates the variation of coronal temperature with through PN hardness ratios (HR): (a) HR1= and (b) HR2=, where , and are the counts in the bands A, B and C respectively. Gagne, Caillaut & Stauffer (1995) found coronal temperatures to be generally hotter for higher activity levels. In their Chandra pointing, Krishnamurthi et al (2001) saw a slight tendency for lower-mass members to be harder. We find a suggestion that HR1 (a good tracer of temperature for a single-component Mekal plasma in the range 0.2–1.0 keV) decreases toward later types while HR2 (a good tracer of temperatures 1.5 keV) increases, explicable if the coronal spectra of later types are flatter while those of earlier types are strongly peaked in the 0.8–1.5 keV band, although the effect is small and at the mercy of small number statistics. Twelve of our Pleiads have sufficient counts () to perform EPIC PN spectroscopy.
4. Summary and future work
In a 40 ks XMM-Newton observation in the Pleiades, we:
(a) detect almost all members from F to M5, and several later than M5
(b) possibly detect the BD Roque 9: the X-ray detection must be
confirmed and optical spectroscopy is required to verify its membership
(c) find typical activity level turns over near :
a wider, and deeper, X-ray survey is necessary to establish the mean
quiescent levels of VLM and substellar Pleiads
(d) see tentative evidence through hardness ratios that the coronae of
dM stars have flatter spectra than those of A-G stars: twelve of
the brightest sources have sufficient counts for EPIC X-ray
spectroscopy, and a deeper, wider survey is required to explore this further
(e) see variable behaviour across the full range of spectral
types, most frequently among K stars, although our sensitivity to
variability among dM stars is lower: large flares on HII 1032 and
HII 1100 deserve detailed analysis
(f) seek to investigate the effect of rotation rates – an important
factor in coronal activity (e.g. M99) – on this study.
References
Belikov, A., Hirte, S., Meusinger, H., Piskunov, A., Schilbach, E. 1998, A&A, 332, 575 (B98)
Gagne, M., Caillaut, J.-P., Stauffer, J. 1995, ApJ, 450, 217 (GCS95)
Hodgkin, S., Jameson, R., Steele, I. 1995, MNRAS, 274, 869 (HJS95)
Jansen, et al. 2001, A&A, 365, 1
Krishnamurthi, A., Reynolds, C., Linsky, J., Martín, E., Gagne, M. 2001, AJ, 121, 337
Micela, G., Sciortino, S., Kashyap, V., Harnden, F., Rosner, R. 1996, ApJS, 102, 75
Micela, G., et al. 1999, A&A, 341, 751 (M99)
Neuhauser, R., et al. 1999, A&A, 343, 883
Pinfield, D., Hodgkin, S., Jameson, R., Cossburn, M., Hambly, N., Devereux, N. 2000, MNRAS, 313, 347 (P00)
Rutledge, R., Basri, G., Martín, E., Bildsten, L. 2000, ApJ, 538, 141
Stauffer, J., Caillaut, J.-P., Gagne, M., Prosser, C., Hartmann, L. 1994, ApJS, 91, 625