UV Imaging Polarimetry of the Seyfert 2 Galaxy Mrk 3
Abstract
We present UV imaging polarimetry data of the Seyfert 2 galaxy Mrk 3 taken by the Hubble Space Telescope. The polarized flux is found to be extended to 1 kpc from the nucleus, and the position angles of polarization are centrosymmetric, confirming that the polarization is caused by scattering. We determine the location of the hidden nucleus as the center of this centrosymmetric pattern. From the polarization images taken in two broad bands, we have obtained the color distribution of the polarized flux. Some regions have blue polarized flux, consistent with optically-thin dust scattering, but some bright knots have a color similar to that of Seyfert 1 nucleus. Also, the recent Chandra X-ray observation suggests that the ratio of scattered UV flux to scattered X-ray flux is rather similar to the intrinsic UV/X-ray ratio in a Seyfert 1 nucleus, if the observed extended X-ray continuum is scattered light. While the scattered X-ray would be essentially from electron scattering, the UV slope and UV/X-ray ratio both being similar to Seyfert 1’s would lead to two possibilities as to the nature of the UV scatterers. One is that the UV may also be scattered by electrons, in which case the scattering gas is somehow dust-free. The other is that the UV is scattered by dust grains, but the wavelength-independent UV scattering with low efficiency indicated by the UV slope and UV/X-ray ratio would suggest that the grains reside in UV-opaque clouds, or the dust might be mainly composed of large grains and lacks small-grain population.
1 Introduction
Mrk 3 is one of the Seyfert 2 galaxies which have been shown to harbor Seyfert 1 nuclei through the presence of polarized broad lines by optical spectropolarimetry (Antonucci & Miller 1985; Miller & Goodrich 1990; Tran, Miller & Kay 1992; Tran 1995; Kay and Moran 1998; Moran et al 2000). The polarized broad lines and featureless continuum observed are thought to be from a hidden broad-line region and continuum source scattered into the line of sight. Therefore, a scattering region should exist somewhere off-nucleus in these Seyfert 2 galaxies. High-resolution imaging polarimetry is a powerful tool to locate this scattering region by spatially resolving the polarized flux distribution. Also, we can directly locate the position of the nucleus in the HST images, which is otherwise unclear since it is obscured. The nuclear position is obtained from the distribution of the polarization position angles, which is expected to be centrosymmetric if the nuclear source is small enough compared to the resolved scattering mirror (e.g. Capetti et al. 1995; Kishimoto 1999). The exploration of the nuclear vicinity is much easier in these type 2 objects than in type 1 objects where the nucleus is too bright and hides the surrounding regions by the wing of its point spread function. However, this is true only if the hidden nucleus location is robustly determined. Imaging polarimetry provides the direct method for this determination.
Mrk 3 has an old stellar population (González Delgado, Heckman, & Leitherer, 2001), thus polarimetry is highly efficient in the ultraviolet (UV) since we can avoid much of the dilution by the unpolarized old stellar light from the host galaxy. Thus we have implemented UV imaging polarimetry by the Hubble Space Telescope (HST). Also, we obtained data with two different filters to map out the color distribution of the polarized flux. This can potentially tell us the nature of the scatterers. We describe our observations in §2 and the results in §3. The implication of the results are discussed in §4 and our conclusions are summarized in §5. We adopt km sec-1 Mpc-1 throughout this paper. Mrk 3 is at , so the distance is 65 Mpc and corresponds to 310 pc.
2 Observation and data reduction
Mrk 3 was observed on December 10, 1998 by the Faint Object Camera (FOC) onboard the HST. The filters F275W (Å) and F342W (Å) were used with three polarizers POL0/POL60/POL120. The F342W images were taken in the normal pixel mode, where the pixel size is , giving a field of view of . The F275W images were taken in the zoomed mode, resulting in a larger field of view with pixels, . The data are summarized in Table 1. All of these were taken after the installation of COSTAR, i.e., after the refurbishment of the HST.
The FOC suffers from nonlinearity when count rates are large, and the nonlinearity depends on the distribution of the illumination over the detector. It exhibits nonlinearity at the 10% level when the count rate is 0.08 and 0.15 cts s-1 pix-1 for the and format, respectively, for uniform illumination. For a point-source, the 10% nonlinearity occurs for a peak count rate of 0.5 and 1.0 cts s-1 pix-1, respectively. The bright regions in the images of Mrk 3 are clumpy, so the detector behavior is expected to be somewhere between these two illumination cases. The maximum count rate in our images was 0.03 cts s-1 pix-1 with the F275W filter ( format) and 0.11 cts s-1 pix-1 with the F342W filter ( format). Therefore, the nonlinearity in these images is expected to be very small. Its effect on the measurement should be concentrated only at the positions of the few brightest clumps. Even in these clumps, a conservative upper limit of the effect is found to be about 1/20 and 1/10 of the measured in the F275W and F342W images, respectively, utilizing the nonlinearity relation for uniform illumination (Nota et al. 1996; Jedrzejewski 1992).
The data were processed in the standard manner to correct for geometric distortion and flat-field response. The reseau marks were removed using neighboring pixels. The three images with three polarizers are known to be slightly shifted relative to one another. In our FOC images of Mrk 3, there are no point sources we can use for the image registration. Therefore, we used the image shift calibration results from Hodge(1993,1995) which are accurate to pixel. The background was subtracted using the outer region of the images. Before combining the three images, each image was scaled in order to allow for the different transmittances of the three polarizers. We have estimated the effective transmittances of each polarizer plus filter, using large-aperture spectra from the HST/FOS data (Cohen et al. 2001) and the ground-based data (Kay 1994). Then the three images through the three polarizers were scaled accordingly, and combined to produce the Stokes images. The polarized flux and polarization are calculated as and , respectively, and debiased following Simmons and Stewart (1985).
Using the same large-aperture spectra, we also estimated the narrow emission line contamination in these filters to be % for both of the filters. The F275W filter is primarily affected by the MgII 2800Å line and the F342W filter by [OII] 3727Å, [NeV]3426, and [NeV]3346 lines. This affects the absolute flux measurement of the continuum accordingly. For small spatial bins, the line contamination could be different from this estimation. In terms of measurement, the line contamination simply results in diluting , since the narrow lines are not strongly polarized [essentially only containing the foreground interstellar polarization in our Galaxy (see below; Schmidt & Miller 1985, Goodrich 1992), although they could be slightly polarized intrinsically (Tran 1995)]. The contamination by unpolarized lines essentially will not affect the and measurements (though the small spatial scale variation of the effective transmittance would slightly affect the and measurements: the resulting uncertainty in is estimated to be less than 1%).
However, our two filters are on the so-called 3000Å bump, which consists of broad FeII lines and Balmer continuum plus high-order Balmer emission lines. The relative polarized flux color measurement between different locations would not be affected by these contaminations, since the incident spectrum from the hidden nucleus is the same, but the absolute color measurement will be slightly affected. We will discuss this in §4.
The optical interstellar polarization in our Galaxy toward Mrk 3 has been estimated to be 1.2% at PA = 132°, from the polarization of the nearby foreground stars (Schmidt & Miller 1985). We have corrected our polarization maps for this foreground polarization, using the Serkowski curve (Serkowski, Mathewson, & Ford 1975) with the parameters adopted by Tran (1995) which are based on the measurement of Schmidt & Miller.
The images through the F275W and F342W filters are also shifted to each other. We have registered them by taking cross-correlation of the central region of the images produced above, since both images are dominated by the same clumpy structure in the central region. The uncertainty in this registration is estimated be pixel.
There are various error sources in the FOC imaging polarimetry. These are described in detail in Kishimoto (1999). Briefly, there are four major sources : (1) statistical error (2) uncertainty in the image registrations of the three polarizer images (3) uncertainty in the polarizer axes direction (4) uncertainty in the relative intensities through each polarizer, mainly from the differences in the shape of the point spread function (PSF) through each polarizer. The source (4) becomes a major error source when the synthetic aperture or binning size for measuring polarization is small. For many cases, the error sources (1) and (4) are larger than others. For (1), Poisson noise is assumed. The source (4) depends on the binning size in the polarization calculations. In this paper, we mainly use a 10 pixel bin () and a 40 pixel bin (), and adopt uncertainties of 5% and 2% for the error source (4) in these bins, respectively (the former is the same value as in Kishimoto 1999, and the latter is an extrapolation from the value for the 10 pixel bin and the 20 pixel bin). In addition to these error sources, we also added in quadrature 5% of the background subtraction amount as an error in the counts in each binned image, in order to evaluate the polarization measurement uncertainty in the diffuse outer regions.
3 Results
3.1 Extended scattering region
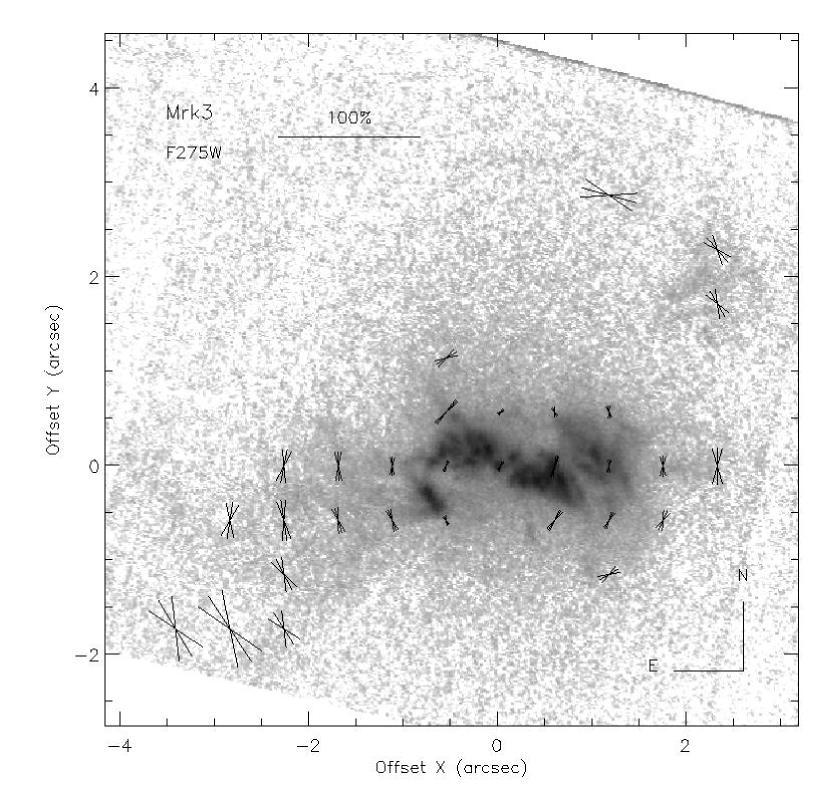
Figure 1 shows the polarization map of Mrk 3 with the F275W filter. The polarizations are calculated in 40 pixel () bins, and the regions with statistical S/N in larger than 5 are shown. The position angle errors indicated in the figure are the total sum in quadrature of all the error sources described in the previous section. The position angle (PA) distribution is centrosymmetric, supporting the idea that the polarization is caused by the scattering of the radiation from a compact nuclear source. The lengths of the lines at each position in the figure indicate the degrees of polarization. We note that in the outermost regions where uncertainty from the background subtraction dominates, the polarization degree is highly uncertain accordingly. However, at least the PA directions are consistent with the ones in the inner regions, suggesting that we have detected the polarization even out to from the center.
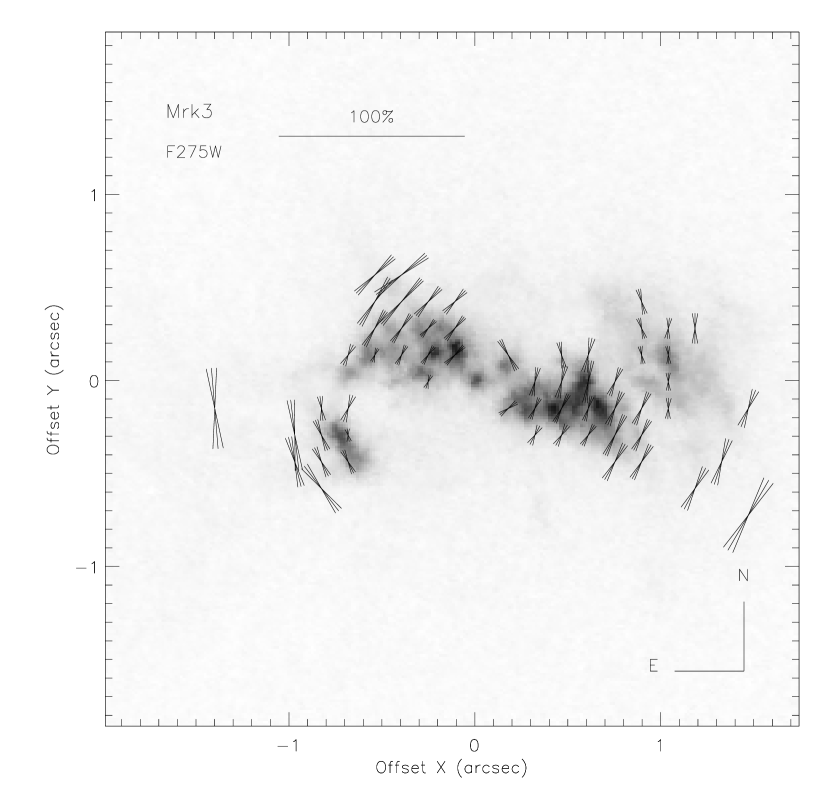
We also show the polarization map on a smaller scale in Figures 2 and 3. The polarizations are calculated in 10 pixel bins (), and only the regions with statistical S/N in larger than 5 are shown. The lengths of the lines are proportional to the polarization degrees also in these figures. The central radius region is very clumpy, and the PA pattern is centrosymmetric down to this central region, where is % and % level in the F275W and F342W filter, respectively (though note the dilution of by the narrow line contamination; see §2).
3.2 Centrosymmetric pattern and the location of hidden nucleus
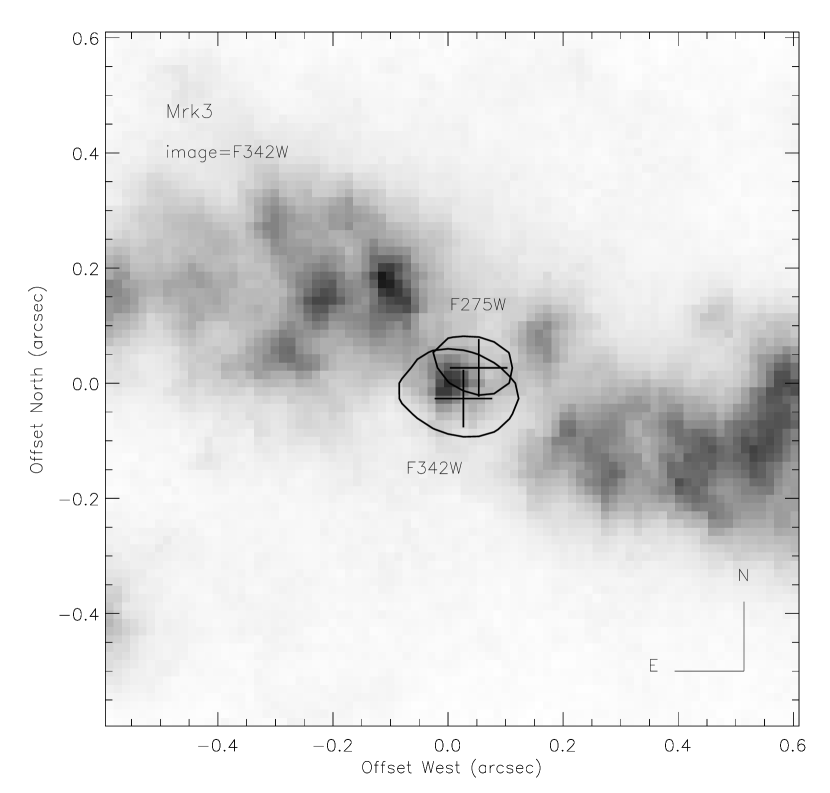
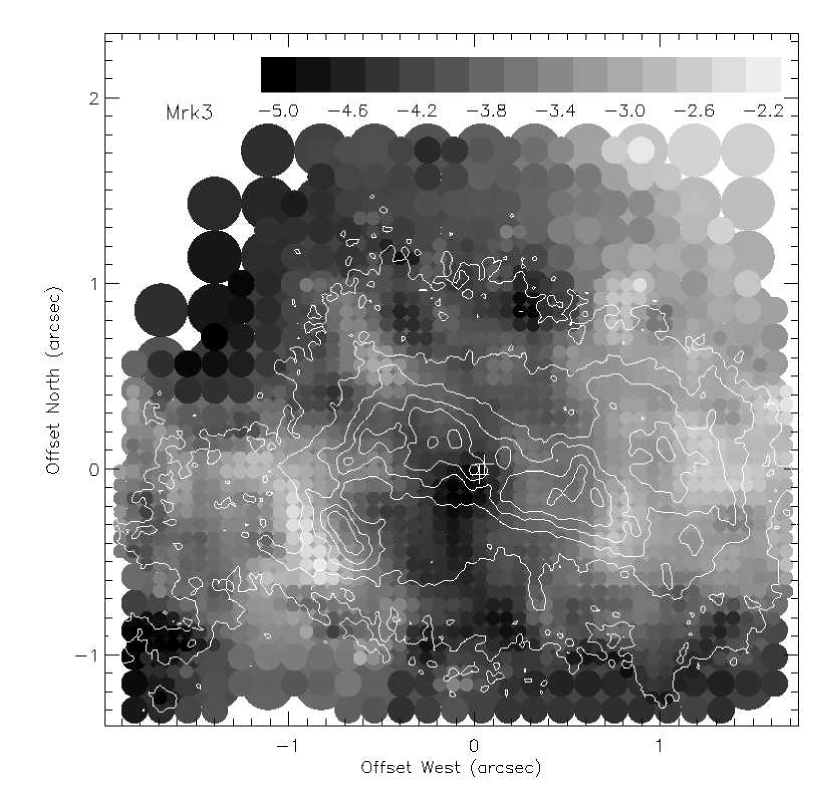
From the observed centrosymmetric pattern, we can robustly determine the position of the hidden nucleus as a symmetric center of this pattern. Specifically, assuming a centrosymmetric model of the PA distribution, a least square fit is implemented using the PA measurements with given errors at each point of the image. The only parameters are the position of the symmetric center. The most probable location of the nucleus is determined as the point of the minimum , with an error circle defined by a certain confidence level. The method is described in detail in Kishimoto (1999). We have implemented this fit to the data shown in Figure 2 and 3. The reduced was found to be and for the F275W and F342W data, respectively. The minimum point is shown as a plus sign in Figure 4 together with the error circle of 99% confidence level, for each of the filters. The two results are slightly different, though they are not inconsistent with each other.
The central of the UV image of Mrk 3 consists of several resolved clouds. There is no unresolved, overwhelmingly bright point source in the image, as expected from the unified model. However, the error circle for the nuclear location includes (or marginally includes) a rather bright cloud. The nucleus is thought to be hidden from direct view in this wavelength region, so we would not expect the radiation of this cloud to be the direct nuclear light. The FOC data rather prefer that the nucleus resides at the western side (SW or NW) of the cloud, but the data do not strongly constrain which side the nucleus is on, and do not even exclude the possibility that the nucleus is within the cloud. The size of this cloud is about (pc) in FWHM in both of the F275W and F342W images, where the diffraction limit of the HST at this wavelength is about .
The total flux color of this cloud is very red : the synthetic photometry with a circular aperture of diameter gives (2800Å)/(3400Å) = , which corresponds to where . The measured flux is (2800Å) = erg cm-2 s-1 Å-1 and (3400Å) = erg cm-2 s-1 Å-1 (but note the emission line contamination; see previous section). These are after the correction for the Galactic reddening, using the reddening curve of Cardelli, Clayton, & Mathis (1989) with (NED; Schlegel et al. 1998).
The calculated polarization for this cloud is not much larger than the uncertainty of the FOC polarization measurement with small apertures. The synthetic circular aperture polarimetry with diameter for this blob, after the interstellar polarization correction (see §2), gives % (statistical error 1.4%) and (statistical error ) at F275W, % (statistical error 1.1%) and (statistical error ) at F342W. Therefore, the polarization detection is marginal, but the blob could be polarized with the % level, since our error estimation would be conservative, as discussed in Kishimoto (1999).
3.3 The color map of polarized flux
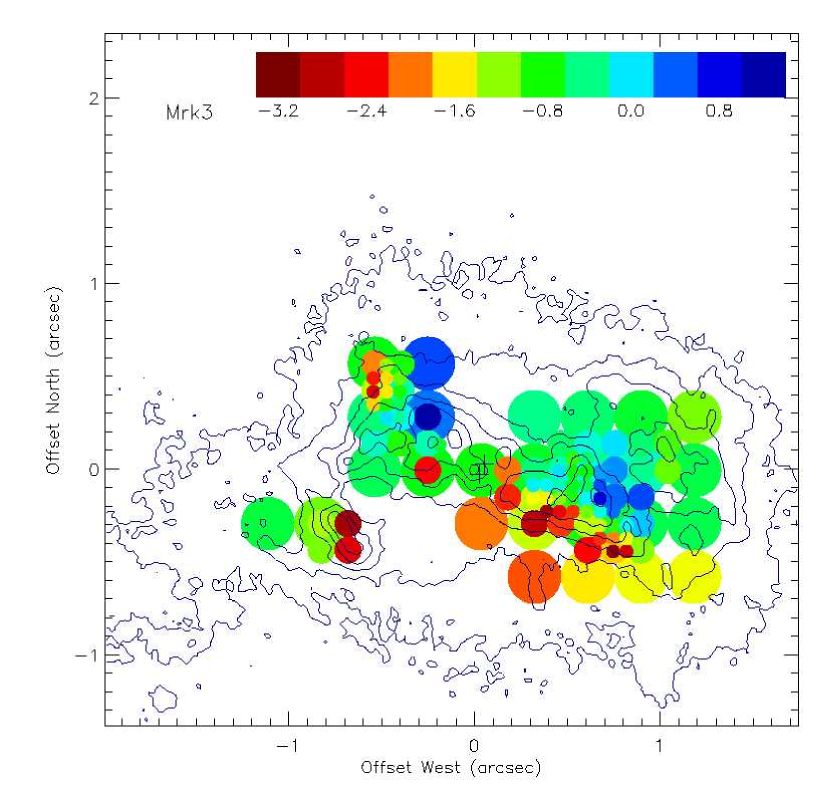
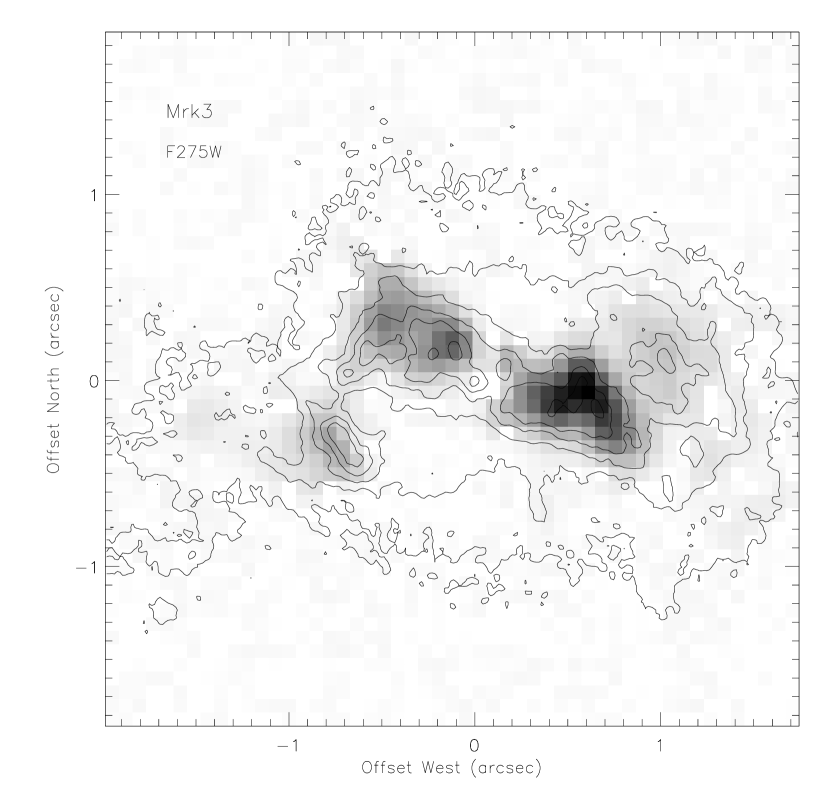
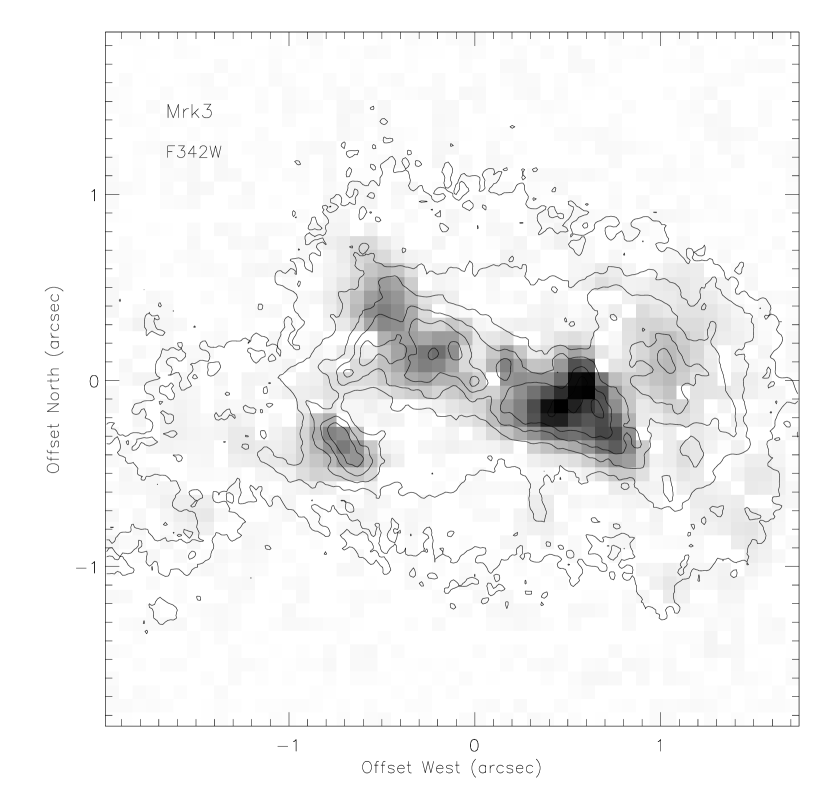
Figures 5 and 6 show the polarized flux distribution through the F275W and F342W filter, respectively. The three polarizer images for each filter were smoothed by a Gaussian with a FWHM of 10 pixels (), and polarized flux was calculated with a 5 pixel bin. The polarized flux has been debiased following Simmons & Stewart (1985); namely corrected by a factor of ( is a statistical error, is an observed polarization). The regions with are masked out. The contours of the image with the F342W filter are drawn in both of the figures, to make the comparison of the two polarized flux distribution easier. The grayscale is linear in both images, with a peak at the same pixel []. The peak polarized flux in the F342W filter is lower by a factor of 0.75 than that in the F275W filter (after the Galactic reddening correction with ). Most of the polarized flux (roughly %) is coming from the region within ( 300 pc) from the nucleus, and the polarized flux is greater on the west side than the east side.
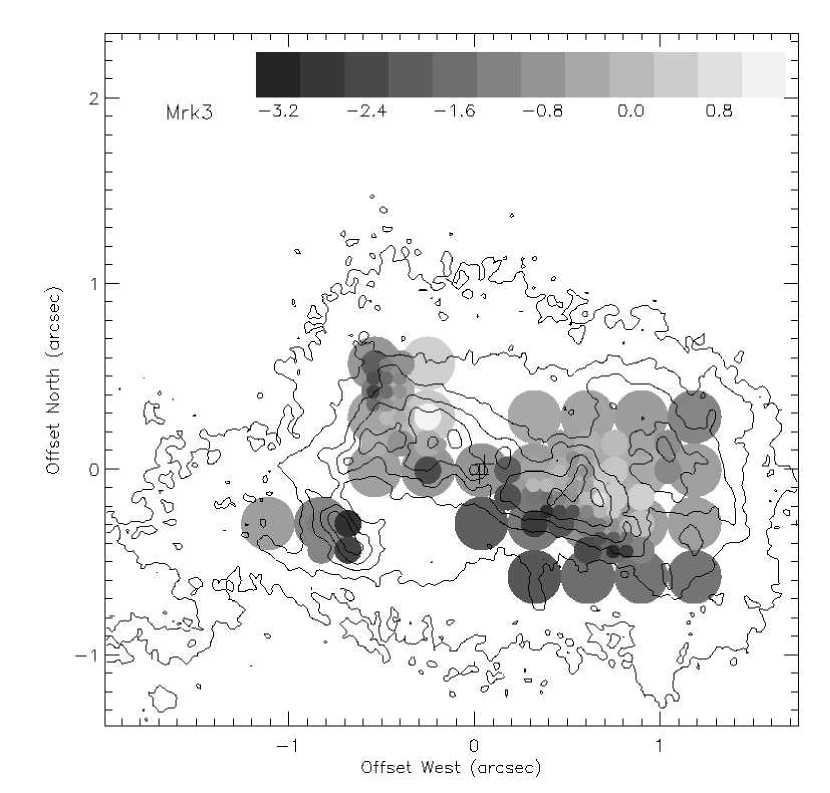
The polarized flux distribution is different in these two filters. From the images with these two filters, we can derive the color distributions of the polarized flux, which is shown in Figure 7. The ratio of the polarized flux in the F275W filter to that in the F342W filter has been converted to the spectral index (). The spectral index has been corrected for the Galactic reddening of (NED; Schlegel et al. 1998). The resulting index range shown in the figure is from to . This color map is a composite of three different bins with three different smoothing. We have convolved three polarizer images for each filter with a Gaussian of FWHM 40, 20, 10 pixel and generated the color map with 20, 10, 5 pixel bins, respectively, and stacked them into one plot. For each bin case, the regions with the formal 1- uncertainty (calculated using the smoothed image counts) in the spectral index smaller than 2 are shown, but the actual uncertainty for the regions shown is estimated to be less than by binning the images with the smoothing FWHM size. For the error calculation, we have neglected the error source (4) described in §2, because of the rather heavy smoothing. The caveat is that the color at the regions with large intensity gradient should be taken with caution, since it would have influence from the spatial blurring of the bright region. We also made the color map without any smoothing and obtained a consistent map, though the features are much clearer in the map from smoothed images. Therefore we only show the latter.
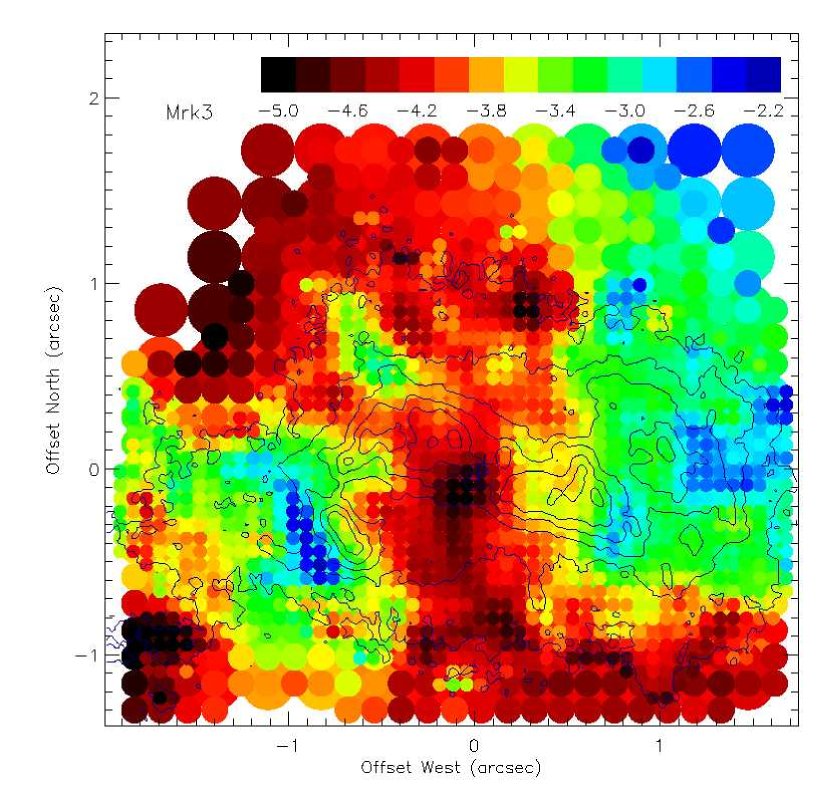
We also generated the total flux color map, which is shown in Figure 8. The color has been corrected for the Galactic reddening. The same procedure as for the polarized flux color map was taken, except the threshold for the formal 1- uncertainty in the index which was set to 1. In the central radius region, the actual uncertainty is estimated to be less than 0.3. The spectral index range is found to be , significantly redder than the polarized flux. The color is very red at around the location of the hidden nucleus (; see the previous subsection), and this red color is extended to the south. This is probably due to an enhanced extinction. The red color seems to be also extended along the north-south direction. On the other hand, the color tends to be bluer at the regions adjacent to some bright clouds, on the opposite side of the direction to the nucleus : especially the east side of the southeastern blob and the west side of the western bright blob. However, the interpretation of the total flux color in general is uncertain : while the overall red color could be partly due to the contribution from old stellar population in the host galaxy, the small-spatial-scale color variation could be caused by the narrow-line contamination in our two filters (see §2). Therefore we will not attempt to interpret the total flux color map in this paper. We will discuss the polarized flux color map in §4.
4 Discussion
4.1 The nuclear location and extended scattered flux
Mrk 3 shows a linear jet-like structure in the radio at PA 84°, consisting of several knots. One central knot remains unresolved even with a high spatial resolution of at 5GHz, and this is thought to be the nuclear location (Kukula et al. 1993). Therefore, to register the radio map on to the HST image, which typically has uncertainties of , this radio core should fall within the error circle of the polarization center as determined above. The registration adopted by Capetti et al. (1996) is consistent with this (while the registration in Capetti et al. 1995 is slightly different).
The spatial distribution of the polarized flux provides a constraint on the opening angle of the nuclear anisotropic radiation. From Figures 2 and 3, the projected full opening angle is , from PA 25° to PA 135°. Obviously, the region illuminated by the nucleus is not filled with bright narrow-line emitting gas. The morphology of the narrow-line emitting cloud distribution is not determined in detail by the anisotropic radiation pattern. Instead, it is suggested to be closely related to the radio jet (Capetti et al. 1995, 1996, 1999). We note that the larger scale biconical radiation morphology (Pogge & De Robertis 1993), extended out to from the nucleus, is at PA 114° with a full opening angle of 74°, and thus slightly shifted from the small scale radiation structure.
4.2 Polarized flux color and a Seyfert 1 color
The color map of the polarized flux can potentially tell us the nature of the scatterers. The obtained color map (Fig.7) seems to suggest that the scattering mechanism is rather non-uniform and complicated. As described in §2, our two filters are on the 3000Å bump: the polarized flux through the F275W filter includes the broad FeII and MgII lines, and the F342W filter contains the Balmer continuum. The relative color measurement at different spatial locations is not affected by these contaminations, since the incident spectrum for the scattering region is the same — the one from the hidden nucleus. The interpretation of the absolute value, however, needs a reference value for a Seyfert 1 nucleus.
For this purpose, we have collected archival HST/FOS spectra of 14 Seyfert 1 galaxies () in this wavelength range, taken with small apertures ( diameter, and for a nearest one). The color between the F275W and F342W filters was derived by synthetic photometry, and converted to the spectral index (). For a few objects for which forbidden lines such as [OII]3727 and [NeV]3426 seemed significant, we have removed these lines, but their effect was found to be only less than %. Combined effect of FeII and MgII lines at F275W would be slightly larger than the effect of the Balmer continuum at F342W (contamination by MgII alone is about 5%), so this color may be slightly bluer than the true continuum. We denote the obtained spectral index as .
The obtained values range from to where the UV luminosity at 2800Å is in the range of erg s-1, but there is a tendency for low-luminosity ones to have redder colors, similar to the correlation found in Mushotzky & Wandel (1989). The host galaxy contamination would make the color redder, but in our case, this is perhaps avoided by the small apertures used. Mrk 3 is estimated to have, if unobscured, at 2800Å around erg s-1 from the direct hard X-ray component, assuming a fiducial UV/X-ray ratio of 10 for a Seyfert 1 galaxy (see below). We also get a consistent, approximate upper limit for this UV to be erg s-1 from the IRAS measurement at 25 µm, assuming the ratio of at 2800Å to 25 µm to be 2 (Sanders et al. 1989). Therefore, as a reference value of , we take the average for the five objects with erg s-1 erg s-1 , which is .
4.3 Color map interpretation and constraints from the Chandra observation
One obvious feature in our polarized flux color map is that the color is significantly redder than the Seyfert 1 color in the southern edge of the bright knotty regions. This red color is probably due to foreground extinction in this southern edge region, where a dust lane feature is seen in the HST optical continuum image (Capetti et al. 1996). In contrast, the polarized flux color seems to be bluened in some regions : the west region of the west bright knots ( at west of the nucleus), and the north region of the east bright knots ( at north-east of the nucleus). This blue color suggests that the polarized flux in these regions could be from optically-thin dust scattering, though the spatial extent of the blue regions at the edges of the bright regions should be taken with caution, because of the spatial blurring by smoothing. The spectral index change expected for Galactic type dust scattering is (see e.g. Kishimoto et al. 2001 and references therein), and this seems to be roughly consistent with the blue color seen in Figure 7, considering the typical Seyfert 1 color quoted above. However, scattered light in the whole nuclear region is not dominated by this blue radiation. In the central brightest regions, the color of some bright knots, e.g. the west brightest knots (), is similar to the Seyfert 1 color, which would suggest gray scattering. Synthetic photometry with a aperture on the west brightest knotty region gives , while the same photometry on the east knotty region yields a little bluer color, . The central region, which includes the whole bright region, has (the error is dominated by the background subtraction uncertainty).
One interpretation for this polarized flux color range would be that the scatterers are dominated by dust grains and the color distribution is all from reddening. The reddening could be foreground or intermingled within the scattering region itself. While the red color found in the southern edge region would be from a foreground reddening, the whole reddening would not be dominated by a foreground reddening, since the FOS UV polarized flux (taken with aperture, 2200-3200Å; Cohen et al. 2001) does not show an exponential decrease toward shorter wavelengths. On the other hand, scattering intermingled with reddening tends to make the scattering wavelength dependence rather gray, without an exponential decrease. Independent spatially-resolved reddening maps, such as an H/H ratio map, would be able to test this reddening explanation, though such a map is not yet available.
The recent Chandra X-ray observation of Mrk 3 (Sako et al. 2000) found a spatially extended soft X-ray continuum component. Its size is (pc), and its spatial extent seems to coincide with that of the dominant polarized flux in our UV image. Sako et al. find the flux of this extended continuum to be erg cm-2 s-1 (converted from the quoted luminosity with their adopted value of 65 km s-1 Mpc-1), integrated between 1 and 1000 Ryd assuming the photon index of . This converts to erg cm-2 s-1. If this is considered to be scattered light, as suggested by Sako et al., we can combine it with the UV scattered flux to see how this scattered flux shape between UV and X-ray matches that of a typical Seyfert 1 spectrum. Note that the scattered X-ray is considered to be from electron scattering, since X-ray scattering by dust is so forwardly concentrated (scattering angle is very small) that dust-scattered X-ray will not get into our line of sight in the case of type 2 objects such as Seyfert 2 galaxies. From the F275W filter image, we deduce a total flux of erg cm-2 s-1, and a polarized flux erg cm-2 s-1 at 2800Å (within the central region). The UV scattered flux should be somewhere between these two. Therefore, the ratio of the UV to X-ray scattered flux in is , whereas the typical ratio seen in radio-quiet quasars with luminosity less than is roughly 10 (ratio of at Å to 1keV; Sanders et al. 1989).
This ratio is apparently consistent with electron scattering, since the Thomson scattering cross section does not change with wavelength and the spectral shape will not be changed in this case, although the data do allow the possibility that the UV/X-ray scattered light ratio is a little larger than in most Seyfert 1s. On the other hand, in order to explain this ratio by having Galactic-type dust scattering in the UV, the UV scattered light needs to have been suppressed somehow considerably. This is because the UV scattering cross section of the Galactic dust grains per H atom is much larger than (roughly 500 in our UV range, though of course it depends on the sight lines), while in X-ray, the scattering cross section is essentially .
The suppression could come from the possible opaqueness of the scattering region. The X-ray observation suggests a rather high column density for the scattering region. In Mrk 3, the direct light from the nucleus dominates in the hard X-ray, which gives us the intrinsic nuclear X-ray luminosity. Comparing this direct flux ( erg cm-2 s-1 at 1 keV, absorption corrected) with the scattered X-ray luminosity quoted above, Sako et al. estimate the scattering optical depth in X-rays to be (assuming conical scattering region of half opening angle 50°; this corresponds to the average column density of cm-2 using : note the typo in Sako et al. 2000). This would mean that the average UV extinction optical thickness is 10 for Galactic-type dust of the normal dust-to-gas ratio (scattering optical thickness of with albedo ). In the HST images, the scattering region is not filled uniformly, but instead it is clumpy and the covering factor could be small, so the column density through each cloud would be even larger than this average column density.
Once the clouds become opaque at the UV, the amount of the UV scattered light will not essentially depend on the column density of each cloud, but will approximately saturate at the amount for the extinction optical thickness around unity. Then the scattered light amount will essentially be proportional to the covering factor. Therefore, given the same average column density, if we consider a case of smaller covering factor (e.g. the case that the resolved clouds consist of smaller unresolved clouds) with each cloud having larger column density, the scattered light will be reduced in the UV, but not in the X-ray, as long as the clouds do not get also opaque in the X-ray.
Thus, scattering by clumpy UV-opaque clouds, as well as electron scattering, would be consistent with the observed UV/X-ray scattered flux ratio. However, the extreme case of a very small covering factor, with the clouds being X-ray opaque, i.e. Compton-thick (covering factor of 1% makes the column density already of order cm-2), seems to be ruled out, since in this case the X-ray scattered continuum from such clumps would be flatter (photon index or bluer at keV for matter that is not too highly ionized; e.g. Miller, Goodrich, & Mathews 1991; Ross & Fabian 1993) than observed ( for the extended scattered component is larger than 1.2; M. Sako, private communication 2001; the CCD spectrum from the zeroth order X-ray image is also consistent with this). On the other hand, electron scattering might give a simple explanation for the UV to X-ray scattered flux ratio and the gray color in the bright knots. If this is the case, the gas in these regions should have lost its dust content almost completely. This could imply that this electron scattering gas came as a wind from the nucleus, where the dust equilibrium temperature is above the sublimation temperature, though it might be odd that the gas from a wind apparently resides in knotty regions.
4.4 Other explanations
A rather simple alternative explanation is that the low UV scattering efficiency and gray scattering described above could be the intrinsic properties of the dust grain population in the circumnuclear region of active galactic nuclei (AGNs). Anomalous properties of dust grains in the AGN vicinity have been reported by several authors, and these properties have been summarized recently by Maiolino et al. (2001a). They have shown that the dust grains in the circumnuclear region of 16 AGNs have a lower reddening than the standard Galactic dust has for the column density obtained from the X-ray photoelectric absorption. They also pointed out that in many cases the optical absorption is also lower than expected from , compared with the Galactic case. The lower leads to relatively gray scattering, and lower leads to lower UV/optical scattering efficiency.
These low and can be explained by a dust size distribution dominated by large grains (Laor & Draine 1993; Maiolino et al. 2001b). This anomalous distribution could be caused by the formation of large grains through coagulation in a high-density environment (Maiolino et al. 2001b), and/or single-photon destruction of small grains in the strong high-energy radiation field (Laor & Draine 1993). In the extended scattering region seen in our images, the latter would be conceivable, though the former might not be the case. It is possible that X-ray charging and heating of dust grains by the AGN continuum is able to selectively destroy parts of the dust population (Krolik & Rhoads 2001).
5 Conclusions
We have presented HST imaging polarimetry data of the Seyfert 2 galaxy Mrk 3. The UV and near-UV radiation is highly polarized, and the polarization position angle distribution is centrosymmetric, consistent with scattering of radiation from a compact source. We have determined the location of the hidden nucleus as the center of this centrosymmetric pattern. The polarized flux is extended out to over ( kpc) from the nucleus, but most of it is from the region within ( pc) from the nucleus.
The polarized flux distributions in the two broad band filters are found to be different, and from these two images we have obtained the color map of the polarized flux. In the southern edge region, the color is significantly redder than a Seyfert 1 color, indicating reddening. In contrast, the color seems to be bluened in some regions, suggesting optically-thin dust scattering. However, some bright knots have a color similar to that of a Seyfert 1 nucleus, which would imply gray scattering. The recent Chandra observation suggests rather large amount of extended X-ray scattered continuum. The ratio of the UV scattered flux to this X-ray scattered flux is similar to that of Seyfert 1s. This indicates rather low scattering efficiency in the UV, much lower than the optically-thin scattering by Galactic dust. These two properties, namely the gray scattering and low UV scattering efficiency, might be explained by clumpy opaque dust scattering, or alternatively these could be intrinsic to nuclear dust grains which might have a size distribution dominated by large grains. However, a simple explanation by electron scattering is also viable.
References
- Antonucci & Miller (1985) Antonucci, R. J., & Miller, J. S. 1985, ApJ, 297, 621
- Capetti et al. (1995) Capetti, A., Macchetto, F., Axon, D. J., Sparks, W. B., & Boksenberg, A. 1995, ApJ, 452, L87
- Capetti et al. (1996) Capetti, A., Axon, D. J., Macchetto, F. D., Sparks, W. B., & Boksenberg, A. 1996, ApJ, 469, 554
- Capetti et al. (1999) Capetti, A., Axon, D. J., Macchetto, F. D., Marconi, A., & Winge, C. 1999, ApJ, 516, 187
- Cappi et al. (1999) Cappi, M., et al. 1999, A&A, 344, 857
- Cardelli, Clayton, & Mathis (1989) Cardelli, J. A., Clayton, G. C., & Mathis, J. S. 1989, ApJ, 345, 245
- Cohen et al. (2001) Cohen, R. D., Antonucci, R. R. J., Kishimoto, M., Hurt, T. W., Kay, L. E., Krolik, J. H., & Allen, R. G. 2001, in preparation
- González Delgado, Heckman, & Leitherer (2001) González Delgado, R. M., Heckman, T., & Leitherer, C. 2001, ApJ, 546, 845
- Goodrich (1992) Goodrich, R. W. 1992, ApJ, 399, 50
- Hodge (1993) Hodge, P. E. 1993, FOC Instrument Science Report, 69
- Hodge (1995) Hodge, P. E. 1995, FOC Instrument Science Report, 89
- Jedrzejewski (1992) Jedrzejewski, R. I. 1992, FOC Instrument Science Report, 62
- Kay (1994) Kay, L. E. 1994, ApJ, 430, 196
- Kay & Moran (1998) Kay, L. E., & Moran, E. C. 1998, PASP, 110, 1003
- Kishimoto (1999) Kishimoto, M. 1999, ApJ, 518, 676
- Kishimoto et al. (2001) Kishimoto, M., Antonucci, R., Cimatti, A., Hurt, T., Dey, A., van Breugel, W., & Spinrad, H. 2001, ApJ, 547, 667
- Krolik & Rhoads (2001) Krolik, J. H. & Rhoads, J. E. 2001, in preparation
- Kukula et al. (1993) Kukula, M. J., Ghosh, T., Pedlar, A., Schilizzi, R. T., Miley, G. K., Xe Bruyn, A. G., & Saikia, D. J. 1993, MNRAS, 264, 893
- Laor & Draine (1993) Laor, A. & Draine, B. T. 1993, ApJ, 402, 441
- Maiolino et al. (2001) Maiolino, R. et al. 2001a, A&A, 365, 28
- Maiolino, Marconi, & Oliva (2001) Maiolino, R., Marconi, A., & Oliva, E. 2001b, A&A, 365, 37
- Miller & Goodrich (1990) Miller, J. S., & Goodrich, R. W. 1990, ApJ, 355, 456
- Miller, Goodrich, & Mathews (1991) Miller, J. S., Goodrich, R. W., & Mathews, W. G. 1991, ApJ, 378, 47
- Moran et al. (2000) Moran, E. C., Barth, A. J., Kay, L. E., & Filippenko, A. V. 2000, ApJ, 540, L73
- Mushotzky & Wandel (1989) Mushotzky, R. F., & Wandel, A. 1989, ApJ, 339, 674
- Nota et al. (1996) Nota, A., et al. 1996, FOC Instrument Handbook Version 7.0 (Baltimore : STScI)
- Pogge & De Robertis (1993) Pogge, P. W., & De Robertis, M. M. 1993, ApJ, 404, 563
- Ross & Fabian (1993) Ross, R. R., & Fabian, A. C. 1993, MNRAS, 261, 74
- Sako et al. (2000) Sako, M., Kahn, S. M., Paerels, F., & Liedahl, D. A. 2000, ApJ, 543, L115
- Sanders et al. (1989) Sanders, D. B., Phinney, E. S., Neugebauer, G., Soifer, B. T., & Matthews, K. 1989, ApJ, 347, 29
- Schlegel et al. (1998) Schlegel, D. J., Finkbeiner, D. P., & Davis, M. 1998, ApJ, 500, 525
- Schmidt & Miller (1985) Schmidt, G. D., & Miller, J. S. 1985, ApJ, 290, 517
- Serkowski, Mathewson, & Ford (1975) Serkowski, K., Mathewson, D. E., & Ford, V. 1975, ApJ, 196, 261
- Simmons & Stewart (1985) Simmons, J. F. L., & Stewart, B. G. 1985, A&A, 142, 100
- Tran (1995) Tran, H. D. 1995, ApJ, 440, 565
- Tran, Miller, & Kay (1992) Tran, H. D., Miller, J. S., & Kay, L. E. 1992, ApJ, 397, 452

| Rootname | Obs Date | Filter | Exp Time (sec) | |
|---|---|---|---|---|
| x3md0101r | Dec 10, 1998 | F275W+POL0 | ||
| x3md0102r | Dec 10, 1998 | F275W+POL60 | ||
| x3md0103r | Dec 10, 1998 | F275W+POL120 | ||
| x3md0104r | Dec 10, 1998 | F342W+POL120 | ||
| x3md0105r | Dec 10, 1998 | F342W+POL60 | ||
| x3md0106r | Dec 10, 1998 | F342W+POL0 |