High resolution observations and mass modelling of the CLASS gravitational lens B1152+199
Abstract
We present a series of high resolution radio and optical observations of the CLASS gravitational lens system B1152+199 obtained with the Multi-Element Radio-Linked Interferometer Network (MERLIN), Very Long Baseline Array (VLBA) and Hubble Space Telescope (HST). Based on the milliarcsecond-scale substructure of the lensed radio components and precise optical astrometry for the lensing galaxy, we construct models for the system and place constraints on the galaxy mass profile. For a single galaxy model with surface mass density , we find that at confidence. Including a second deflector to represent a possible satellite galaxy of the primary lens leads to slightly steeper mass profiles.
keywords:
gravitational lensing – galaxies: structure1 Introduction
Multiple-image gravitational lens systems are potent tools for investigating a wide range of astrophysical and cosmological issues. One promising application of strong lensing is the determination of the Hubble parameter through the measurement of differential time delays (Refsdal 1964; Schechter et al. 1997; Kundić et al. 1997; Lovell et al. 1998; Wisotzki et al. 1998; Biggs et al. 1999; Fassnacht et al. 1999; Koopmans et al. 2000; Patnaik & Narasimha 2001). In addition, lenses can directly constrain the inner several kiloparsecs of galaxy mass distributions (e.g., Kochanek 1991, 1995; Rusin & Ma 2001; Cohn et al. 2001; Muñoz, Kochanek & Keeton 2001). Much of the recent interest in finding arcsecond-scale gravitational lenses through systematic searches such as the Cosmic Lens All-Sky Survey (e.g., Myers et al. 1995, 1999) and the southern survey of Winn et al. (2000) has been driven by these goals.
High resolution observations are the essential step in transforming lens systems from mere novelties into useful tools. For example, optical or near-infrared imaging with the Hubble Space Telescope (HST) is necessary to pinpoint the centre of the lensing galaxy, determine its shape and orientation, and search for nearby objects that may be perturbing the potential. This is complemented by observations with high resolution radio arrays such as the Multi-Element Radio-Linked Interferometer Network (MERLIN) and the Very Long Baseline Array (VLBA), which offer precision astrometry and search for milliarcsecond-scale substructure in the lensed radio components. Taken together, these data provide the raw material for developing models of the gravitational potential, from which the structure of the lensing galaxy is investigated and time delays are predicted for use in Hubble constant determination.
B1152+199 (Myers et al. 1999) was identified as a gravitational lens candidate in the third phase of the CLASS survey observations. The source consists of two compact radio components with a flux density ratio of 3:1, separated by . Follow-up observations with the Very Large Array (VLA) demonstrated that the components have nearly identical two-point spectral indices between and GHz, as expected for images of a single lensed source. The lensing hypothesis was definitively confirmed via follow-up spectroscopy obtained with the Keck II telescope, which detected lines from a background quasar at and a foreground galaxy at . Imaging of the system with the Palomar 5-m telescope revealed a bright (, in Gunn magnitudes) stellar-like object at the radio position. The lack of structure suggested that the fainter of the images may be attenuated by dust extinction in the lensing galaxy. Subsequent observations with the Nordic Optical Telescope (Toft, Hjorth & Burud 2000) detected a weak counterpart to the secondary lensed image. The large optical flux ratio between the images ( 60:1 at V band) points to significant differential extinction by the lensing galaxy, which was detected following the subtraction of scaled point-spread functions (PSFs).
This paper presents vastly improved radio and optical observations of B1152+199, and constructs models for the lensing mass distribution based on the high resolution data. Section 2 analyses the radio properties of B1152+199, including expanded VLA radio spectra and deep observations with MERLIN and the VLBA. Section 3 presents optical imaging obtained with HST. In section 4 we investigate models for the system and constrain the lensing galaxy mass profile. Section 5 summarises our findings and outlines additional work.
2 Radio Imaging
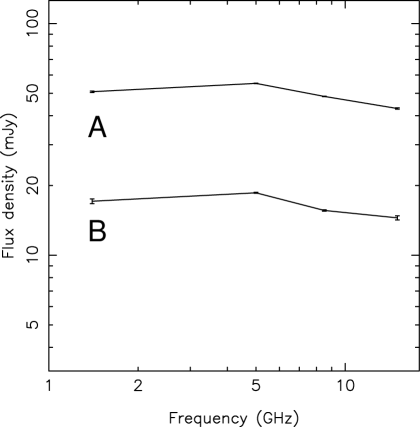
B1152+199 consists of two radio components with a flux density ratio of 3:1 and a separation of (Myers et al. 1999). Each of the components is unresolved by the VLA. To investigate the spectral properties of the components over a wide range of frequencies, the system was observed at 1.4, 5, 8.4 and 15 GHz using the VLA in A configuration on 1999 July 15. The phase calibrator was J1150+242, and observations of 3C286 were used to set the flux density scale. The VLA data sets were calibrated in the Astronomical Image Processing System (AIPS) using the standard procedure and analysed in DIFMAP (Shepherd 1997). In each case the visibility data were fitted to a pair of compact Gaussian components using several iterations of model-fitting and phase-only self-calibration, with a solution interval of 0.5 min. The component flux densities are given in Table 1, and the radio spectra are plotted in Figure 1. The spectra are nearly identical, as expected for lensed images of a single background source. The overall spectral indices between 1.4 and 15 GHz are (A) and (B), respectively. The flatness of the radio spectra suggests that the source may exhibit sufficient variability to allow for the measurement of a differential time delay. However, trial monitoring observations using the VLA at 8.4 GHz have thus far failed to detect any significant variability () in the lensed components.
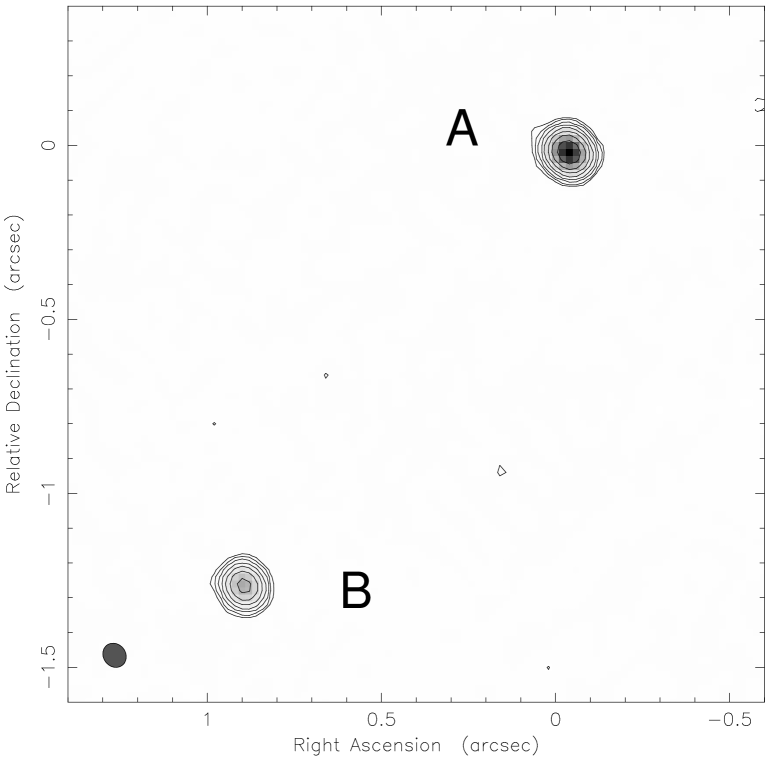
MERLIN 5 GHz observations of B1152+199 were performed on 1999 January 2 for 7 hr and again on 1999 January 5 for 14 hr. The flux density scale was determined by 15 min observations of 3C286 and the point source calibrator OQ208. Alternate observations of the target source (8 min) and a nearby phase reference source J1148+186 (2 min) were iterated. The combined data were calibrated in AIPS and imaged in DIFMAP by repeating a cycle of cleaning and phase-only self-calibration, starting with long solution intervals ( min) and gradually decreasing to a minimum interval of min. Once the model had sufficiently converged, an amplitude self-calibration was performed using a solution interval of 30 min. The final map has an rms noise of Jy/beam and is shown in Figure 2. The data were modelled by two compact Gaussian components with flux densities of mJy (A) and mJy (B). No further emission was detected down to the level of the residual map.
| Comp | ||||
|---|---|---|---|---|
| A | ||||
| B |
| Comp | (mJy) | |||
|---|---|---|---|---|
VLBA 5 GHz observations of B1152+199 were obtained on 2001 February 27 and March 18. The observing time was three hours per epoch, which was divided among three widely spaced hour angles to maximise the coverage. The data were recorded in two IFs, each of which was split into 16 0.5-MHz channels giving a total bandwidth of 16 MHz. The data were digitized using two-bit sampling and both the Stokes L and R polarizations were recorded. The integration time per visibility was 2 seconds. A five minute scan of the bright source 4C39.25 was included for fringe-finding purposes. Alternate observations of the target source (3 min) and the nearby phase reference source J1148+186 (1.5 min) were then iterated.
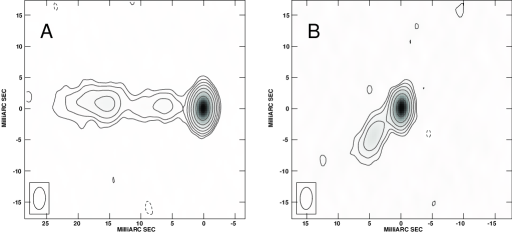
Data reduction was carried out in AIPS on the combined epochs. The data were first flagged and amplitude calibrated using recorded system temperatures and known telescope gain curves. Next the data were fringe-fitted, using 4C39.25 to derive an initial delay correction. The phase calibrator was then used to find the residual rate, phase and delay solutions as a function of time. This was initially fringe-fitted assuming that it was a point source and later mapped and self-calibrated to produce a model that included the effects of resolved structure. The solutions so found were then applied to B1152+199. The data were mapped using the IMAGR task. As the correlation centre of the data was a position close (50 mas) to component A, the data were not averaged in time or frequency so as to avoid any smearing in the final images. Maps were made of two fields at the positions of the lensed radio components. Several iterations of mapping and phase-only self-calibration were performed until the CLEAN model converged. The data were then amplitude self-calibrated using a long solution interval (80 min). The resulting maps are displayed in Figure 3 and have an rms noise of Jy/beam. Each of the components is resolved into a compact core and extended jet structure. Finally, the data were model-fitted using the OMFIT task. For each image, two components were used to crudely describe the observed structure: a delta function for the core and a Gaussian for the jet. The positions, flux densities and orientations of these components are listed in Table 2.
Note the apparent peculiarity of the B1152+192 radio substructure. In component A the jet is quite straight. Specifically, the position angle of the Gaussian jet component () is nearly identical to that of an axis drawn between the centre of that component and the core. The jet in B, however, appears to be slightly bent. Here the position angle of the Gaussian jet () is significantly larger than that of an axis passing through the centres of the core and jet model components (). The bending of B could be produced by substructure in the lensing mass distribution (e.g., Metcalf & Madau 2001). Deeper imaging at higher resolution will be essential for confirming this discrepancy and evaluating possible solutions.
3 Hubble Space Telescope Imaging
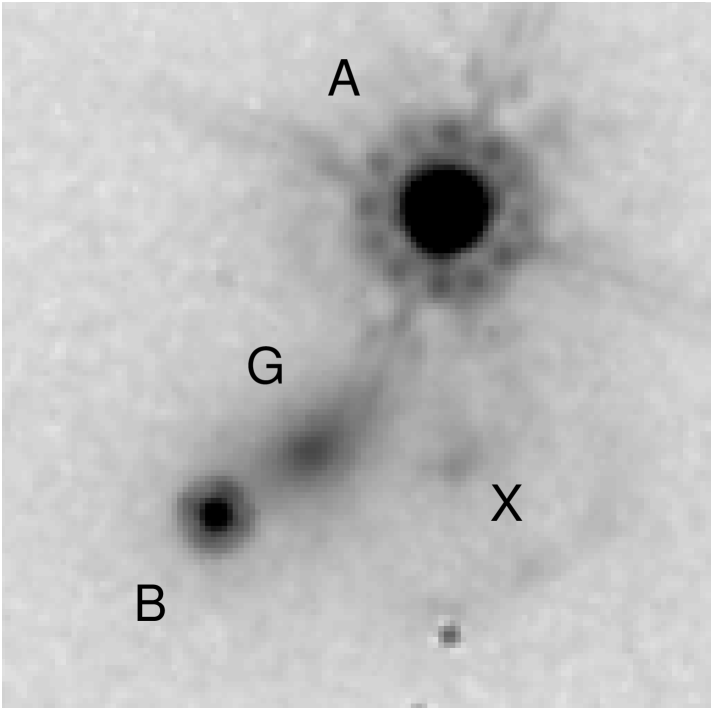
HST observations of B1152+199 were obtained on 2000 March 28 with the Wide Field and Planetary Camera 2 (WFPC2). The F555W (“V-band”) and F814W (“I-band”) filters were used. For each filter, four dithered exposures of 500 sec duration were obtained. A standard reduction was performed on the data sets using the Image Reduction and Analysis Facility (IRAF). The resulting I-band image is displayed in Figure 4. The V-band image detected all the same features but at a lower signal-to-noise, and is not shown. The lensing galaxy (G) and counterparts to the lensed quasar components (A B) are clearly detected. In addition, a faint extended emission feature (X) is seen to the west of G. Component X certainly cannot be an additional lensed image, as it has no radio counterpart. It may therefore be a satellite galaxy of the primary lens. In addition, evidence of a diffuse arc is seen to the west of image B. This may be lensed extended emission from the quasar host galaxy. Its position would require that part of the host galaxy resides in the region enclosed by the tangential caustic curve, inside of which sources are lensed into four images.
| Comp | ||||
| A | ||||
| B | ||||
| G | ||||
| X |
Photometry and relative astrometry were performed on the HST data. The positions and magnitudes of the components are listed in Table 3. There were difficulties in subtracting PSFs because image A is probably saturated. Consequently, the errors in the magnitudes are quite large (). The relative optical and radio positions of A and B are consistent to within the HST error bars ( mas). The position of G differs from the ground-based measurement of Toft, Hjorth & Burud (2000) by more than mas, which demonstrates the importance of HST observations for investigating lens systems. Finally, elliptical isophotes were fit to G. At a distance of mas from the galaxy centre we find a surface brightness axial ratio of and a position angle of . Closer to the galaxy centre, the isophotes tend to have smaller axial ratios and somewhat more vertical orientations.
4 Mass Modelling
We now investigate simple models for the B1152+199 lensing potential. The models were constrained using the positions (, ) of the two lensed core components from the VLBA data and the flux density ratio. The consistency of the measured flux density ratio among the various radio data sets strongly suggests that the value has been affected very little by variability and is therefore close to the true magnification ratio. We thus set and assumed an uncertainty of (5%) to account for possible effects from low-level variability or model-fitting errors. We set mas, and the lens and source redshifts to their measured values of 0.439 and 1.019, respectively (Myers et al. 1999). A flat cosmology with was assumed for all calculations.
Because the lensing mass in B1152+199 is dominated by a single galaxy, we modelled the system using a singular power-law ellipsoid (SPLE) mass distribution (e.g., Barkana 1998), with scaled surface density
| (1) |
where is the power-law slope, is the normalisation and is the projected axial ratio. Current constraints on the inner several kiloparcsecs of elliptical galaxies (e.g., Cohn et al. 2001; Grogin & Narayan 1996; Kochanek 1995; Koopmans & Fassnacht 1999; Rix et al. 1997; Rusin & Ma 2001) favour mass distributions that are close to isothermal (), but a range of slopes () is also consistent with the data. We considered various values of in this regime. Our calculations made use of the rapidly converging series solutions for the deflection angles and magnification matrices of power-law mass profiles derived by Barkana (1998) and implemented in the “FASTELL” software package.
Lens modelling was performed with an image plane minimisation (Kochanek 1991), which optimised the fit statistic
| (2) |
where primed quantities are model-predicted and unprimed quantities are observed. To reduce the number of free parameters and ensure a constrained model, the position of the galaxy was fixed at (, ) relative to A. With the profile slope also fixed, the model has five parameters: the normalisation, axial ratio and position angle of the SPLE, and two coordinates for the unlensed source. The number of degrees of freedom (NDF) is zero, so the best-fitting model should be described by , regardless of the assumed uncertainties. Monte Carlo simulations were performed to examine the stability of the models. Gaussian-distributed errors accounting for observational uncertainties were added simultaneously to the galaxy position ( mas in each coordinate) and flux density ratio (). The models were optimised for each of 10000 trials. The uncertainties in the parameters were found from the ranges enclosing of the results.
The optimised model parameters and time delays for various values of are listed in Table 4. The differential time delay for the isothermal () model is days in a flat cosmology. The delay varies linearly with the assumed profile slope, as predicted by Witt, Mao & Keeton (2001). Critical curves and caustics for the isothermal case are plotted in Figure 5.

The above models can be subjected to a pair of consistency checks. First, the mass distributions of ellipticals tend to be well-aligned with the light (Keeton, Kochanek & Falco 1998; Kochanek 2001), so it is useful to compare the position angles of the SPLEs with the surface brightness of the lensing galaxy. From Table 4 we see that the model-predicted position angles are generally compatible with the HST value, but the agreement diminishes as the profile is made steeper. The discrepancies are, however, broadly consistent with the range found by Kochanek (2001). Offsets between the mass and light position angles are often due to external shear fields, but we lack a sufficient number of constraints to unravel the distribution of internal and external shear in B1152+199 at this time.
Second, we considered the relative orientations of the B1152+199 radio components. An infinitesimal vector associated with image A is mapped to a vector associated with image B according to
| (3) |
where are the magnification matrices (e.g., Schneider, Ehlers & Falco 1992) at the image positions A and B, respectively, and represents a vector in the source plane. We define the position angles of the radio components using the axes passing through the centres of their respective core and jet subcomponents, as our experience indicates that this will be the cleanest indicator of orientation. Given the values in Table 2, and . Using eq. (4) and the recovered magnification matrices, we projected a vector with to a vector and calculated its position angle. The resulting values are listed in Table 4, with the uncertainties determined by the Monte Carlo. Note that steeper mass profiles lead to larger position angles for component B. A mass profile with provides the best fit to the observed orientations. The popular isothermal model is still compatible with the VLBA data, but shallower mass profiles fail to reproduce the substructure.
To better quantify constraints on the mass profile, we calculated a new fit parameter
| (4) |
that includes contributions from the position angle of component B () and the galaxy centre (), which was now allowed to vary in order to best reproduce the substructure. The galaxy position was constrained by the HST astrometry, with a fit tolerance of mas on each coordinate. The model-predicted position angle of B was again computed by fixing A at the observed value of . A fit tolerance of was assumed for the orientation of B. The models have NDF = 1. A plot of as a function of is presented in Figure 6. The value of is dominated by the contribution from . The data favour a lensing mass profile with at confidence (). The limits are changed only slightly when the rather arbitrary error assigned to the flux density ratio is set to 1% or 10%. Finally, the absence of additional components in the 5 GHz MERLIN map requires that any third lensed image have a flux density such that (see also Rusin & Ma 2001), where is the flux density of image A, and a conservative detection limit of 5 times the map rms noise level has been assumed. This condition is satisfied for all SPLE mass models with . Therefore, the lack of a detectable third image leads to no improvement in the profile constraints in this particular system, but is consistent with the bounds derived using the observed images.

We also investigated the expected perturbation due to the possible satellite galaxy X. Relative velocity dispersions can be estimated from the galaxy luminosities and Faber-Jackson (1976) relation . Because , using the V-band data and using the I-band data.111Note that these values assume spherical deflectors. Modifications would be required in the presence of ellipticity (e.g., Keeton, Kochanek & Seljak 1997). For this preliminary analysis, however, we ignore such issues. We fixed the position of X according to the HST astrometry and modelled it as a spherical deflector with the same power-law slope as G. We ran trials with , 4 and 5, and the results are listed in Table 5. The inclusion of X has a negligible effect on the position angle and axial ratio of G for each , but the time delay is decreased by relative to the single deflector case. In addition, the predicted value of is smaller for a given , making steeper mass profiles necessary to reproduce the data in the two deflector model (Table 5). Fixing , for example, implies that at confidence. For profiles steeper than isothermal, a third, negative-parity image can be formed near X. This image becomes brighter as is increased over the range of profile slopes investigated. The absence of the image tightens the upper bound on the profile for more massive secondary deflectors: for and for .
| bound I | bound II | ||
|---|---|---|---|
| 3 | 27.7 | ||
| 4 | 29.8 | ||
| 5 | 30.8 |
Finally, note that if we had used a larger position angle for B, steeper mass profiles would be required to fit the data. Assuming that , as derived from the orientation of the Gaussian model component in Table 2, the profile constraints become () for the single deflector case and () for the two deflector case with . The absence of a detectable third image is satisfied for the same range of profile slopes given in Table 5. This rules out virtually all for and 4.
5 Discussion
We have presented high resolution observations of the gravitational lens CLASS B1152+199 obtained with MERLIN, the VLBA and HST. Such data are vital if lens systems are to fulfill their potential for constraining galaxy mass distributions or determining the Hubble parameter. While previous spectroscopic (Myers et al. 1999) and ground-based optical (Toft, Hjorth & Burud 2000) observations were sufficient to confirm B1152+199 as a gravitational lens, they offered little detailed knowledge about the structure of the system. The motivation for this paper was therefore to provide the high resolution data necessary for more advanced astrophysical and cosmological investigations of this lens.
VLA and MERLIN observations of B1152+199 show two compact radio components separated by , with a flux density ratio of 3:1. Both components have nearly identical flat radio spectra between 1.4 and 15 GHz, as expected for lensed images of a single background source. VLBA 5 GHz observations resolved each of the components into a compact core and extended jet. HST observations with the WFPC2 camera detected optical counterparts to each of the quasar images. The flux density ratio is :1 at V band and :1 at I band, confirming the strong extinction of component B as it passes through the lens. In addition to clearly detecting the primary lensing mass (G), the images show a faint nearby emission (X) feature that may be a satellite galaxy.
We investigated mass models for B1152+199 based on the new radio and optical data. The predicted time delay for an ellipsoidal mass distribution with an isothermal profile is days, assuming a flat cosmology. The delay varies linearly with the assumed mass profile, as predicted by Witt, Mao & Keeton (2001). The inclusion of a second power-law deflector to represent the possible satellite galaxy X decreases the time delay by . The relative orientations of the lensed radio components were shown to be powerful probes of the mass profile. Assuming a surface mass distribution , the milliarcsecond-scale substructure requires that () for a single galaxy model, and slightly steeper profiles when X is included. The lower limit on is particularly secure, as an alternate definition of the component orientations, based on the model-fitted position angles of the Gaussian jets, would lead to steeper mass profiles. B1152+199 is the simplest gravitational lens system in which both upper and lower bounds on the lensing mass profile have been derived. This system demonstrates the power of VLBI data for the investigation of mass models.
Additional modelling insights are likely to be obtained from higher resolution VLBI observations of B1152+199. Note that the jet associated with image A appears to have a pair of hotspots (Figure 3). If corresponding features can be resolved in component B, it may be possible to construct models based on the detailed substructure of the jets, similar to the analysis performed on QSO 0957+561 (Barkana et al. 1999). Such observations should also determine whether the slight bend in the B jet suggested by the current VLBA 5 GHz data is real. Observations with the HST Near Infrared Camera and Multi-Object Spectrometer (NICMOS) will also be undertaken in an attempt to detect and map emission from the quasar host galaxy. The information provided by lensed extended emission is a vital ingredient for properly reconstructing the mass distributions of lenses (Kochanek, Keeton & McLeod 2001). Finally, future studies will focus on measuring the differential time delay. The system is currently being monitored at the VLA along with several other new CLASS gravitational lens systems.
Acknowledgements
We thank the MERLIN, VLBA and HST staffs for their assistance during our observing runs. We also thank the referee, Alok Patnaik, for insightful comments that helped us improve our initial draft. The National Radio Astronomy Observatory is a facility of the National Science Foundation operated under cooperative agreement by Associated Universities, Inc. MERLIN is operated as a National Facility by the University of Manchester, on behalf of the UK Particle Physics & Astronomy Research Council. This research used observations with the Hubble Space Telescope, obtained at the Space Telescope Science Institute, which is operated by Associated Universities for Research in Astronomy Inc. under NASA contract NAS5-26555. D.R. acknowledges funding from the Zaccheus Daniel Foundation. This work was supported in part by European Commission TMR Programme, Research Network Contract ERBFMRXCT96-0034 (“CERES”).
References
- [1] Barkana, R., 1998, ApJ, 502, 531
- [2] Barkana, R., Lehár, J., Falco, E.E., Grogin, N.A., Keeton, C.R., & Shapiro, I.I, 1999, ApJ, 520, 479
- [3] Biggs, A.D., Browne, I.W.A., Helbig, P., Koopmans, L.V.E., Wilkinson, P.N., & Perley, R.A., 1999, MNRAS, 304, 349
- [4] Cohn, J.D., Kochanek, C.S., McLeod, B.A., & Keeton, C.R., 2001, ApJ, 554, 1216
- [5] Faber, S.M., & Jackson, R.E., 1976, ApJ, 204, 668
- [6] Fassnacht, C.D., Pearson, T.J., Readhead, A.C.S., Browne, I.W.A., Koopmans, L.V.E., Myers, S.T., & Wilkinson, P.N., 1999, ApJ, 527, 498
- [7] Grogin, N.A., & Narayan, R., 1996, ApJ, 473, 570
- [8] Keeton, C.R., Kochanek, C.S., & Falco, E.E., 1998, ApJ, 509, 561
- [9] Keeton, C.R., Kochanek, C.S., & Seljak, U., 1997, ApJ, 482, 604
- [10] Kochanek, C.S., 1991, ApJ, 373, 354
- [11] Kochanek, C.S., 1995, ApJ, 445, 559
- [12] Kochanek, C.S., 2001, preprint, astro-ph/0106495
- [13] Kochanek, C.S., Keeton, C.R., & McLeod, B.A., 2001, ApJ, 547, 50
- [14] Koopmans, L.V.E., de Bruyn, A.G., Xanthopoulos, E., & Fassnacht, C.D., 2000, A&A, 356, 391
- [15] Koopmans, L.V.E., & Fassnacht, C.D., 1999, ApJ, 527, 513
- [16] Kundić, T., et al., 1997, ApJ, 482, 75
- [17] Lovell, J.E.J., Jauncey, D.L., Reynolds, J.E., Wieringa, M.H., King, E.A., Tzioumis, A.K., McCullough, P.M., & Edwards, P.G., 1998, ApJL, 508L, 51
- [18] Metcalf, R.B., & Madau, P., 2001, ApJ, in press (astro-ph/0108224)
- [19] Muñoz, J.A., Kochanek, C.S., & Keeton, C.R., 2001, ApJ, submitted (astro-ph/0103009)
- [20] Myers, S.T., et al., 1995, ApJL, 447L, 5
- [21] Myers, S.T., et al., 1999, AJ, 117, 2565
- [22] Patnaik, A.R., & Narasimha, D., 2001, MNRAS, 326, 1403
- [23] Refsdal, S., 1964, MNRAS, 128, 307
- [24] Rix, H.-W., de Zeeuw, P.T., Cretton, N., van der Marel, R.P., & Carollo, C.M., 1997, ApJ, 488, 702
- [25] Rusin, D., & Ma, C.-P., 2001, ApJL, 549L, 33
- [26] Schechter, P.L., et al., 1997, ApJL, 475L, 85
- [27] Schneider, P., Ehlers, J., & Falco, E.E., 1992, Gravitational Lenses (Berlin: Springer-Verlag)
- [28] Shepherd, M.C., 1997, in Astronomical Data Analysis Software and Systems IV, eds. G. Hunt & H. E. Payne, (ASP Conference Series, v125) 77
- [29] Toft, S., Hjorth, J., & Burud, I., 2000, A&A, 357, 115
- [30] Winn, J.N., et al., 2000, AJ, 120, 2868
- [31] Wisotzki, L., Wucknitz, O., Lopez, S., & Sorensen, A.N., 1998, A&A, 339L, 73
- [32] Witt, H.J., Mao, S., & Keeton, C.R., 2000, ApJ, 544, 98