Tracing the Cluster Internal Dynamics with Member Galaxies
Abstract
The analysis of the spatial distribution and kinematics of galaxies in clusters allows one to determine the cluster internal dynamics. In this paper, I review the state of the art of this topic. In particular, I summarize what we have learned so far about galaxy orbits in clusters, and about the cluster mass distribution. I then compare four methods that have recently been used in the literature, by applying them to the same data-set. The results stress the importance of reducing systematic besides random errors, for a reliable determination of cluster mass profiles.
INAF – Osservatorio Astronomico di Trieste, via G.B. Tiepolo 11, I-34131 Trieste, Italy – biviano@ts.astro.it
1. Introduction
Already in 1931, Hubble & Humason (1931) provided rough estimates of the velocity dispersions of three galaxy clusters, ranging from 500 to 1200 km s-1. This is more or less the range of values found for rich clusters nowadays. A few years later, Zwicky (1933, 1937) and Smith (1936), determined the total masses of the Coma and the Virgo cluster, respectively, by application of the virial theorem to the cluster galaxies. The cluster masses they determined111Throughout this paper I use a Hubble constant H0=70 km s-1 Mpc-1. Quoted values are scaled accordingly., (Coma), and (Virgo), are in reasonable good agreement with nowadays estimates. Of course, these early estimates used galaxies as unbiased tracers of the underlying mass distribution, but this was just a convenient assumption. Relaxing this assumption can have a large effect on the cluster mass estimate (see, e.g., Merritt 1987). In fact, galaxies are unlikely to be distributed like the mass, simply because different cluster galaxy populations have different distributions (e.g. emission-line galaxies, ELG hereafter, and non-ELG, see Biviano et al. 1997). That is why we need to determine the cluster mass distribution, if we want to determine its total mass. And if we use the cluster galaxies for this purpose, we must at the same time determine their orbital anisotropies.
In this contribution, I review our current understanding of the internal dynamics of clusters, as determined from the spatial and velocity distributions of cluster member galaxies. Due to space limitation, I focus my review on the determination of the cluster mass, and mass-to-light profiles, and on the orbital anisotropy of cluster galaxies. Readers interested in cluster substructures are referred to the recent review of Girardi & Biviano (2001), and those interested in a complete historical review of this topic are referred to Biviano (2000).
2. The Jeans approach
Here I briefly describe the traditional Jeans approach (see Binney & Tremaine 1987). For the sake of simplicity, I assume to deal with a non-rotating spherically symmetric system, in a steady-state. The Abel equations relate the projected density profile, , and projected velocity dispersion profile, (the observables), to the de-projected density profile, and, respectively, the radial and tangential components of the velocity dispersion profile, , and . and are the projected and 3D clustercentric radial distances, respectively. When , and are determined, the mass profile follows from the Jeans equation.
In principle, one should determine the de-projected profiles from the observed ones, but this is not simple, unless the anisotropy term, is zero. The general case requires solving an integro-diffential equation (eq.4-62 in Binney & Tremaine 1987; see Binney & Mamon 1982; Solanes & Salvador-Solé 1990). This “direct” approach is complicated when the data are noisy. Therefore, the simpler “inverse” route is usually chosen. One adopts suitable functional forms for the 3D profiles – , , , or the mass profile, –, projects them in 2D, and determines their best-fit parameters by comparison with the observables (see, e.g., Carlberg et al. 1997a, and Sect. 3.2).
The Jeans approach has several potential problems. First of all, one generally assumes the system to be spherically symmetric, but clusters are not. However, the number of available galaxies in each single cluster is limited, and it is often necessary to build a “composite” cluster by joining together the data for several clusters, after proper normalization (see, e.g., Biviano et al. 1992, 1997; Carlberg et al. 1997a). This composite cluster is spherically symmetric by construction.
Evidence for cluster rotation has been claimed for a couple of clusters (see, e.g., Biviano et al. 1996; Dupke & Bregman 2001) but in general we can safely assume that rotational motions are not important.
The assumption of steady-state is not always valid. E.g. galaxy groups are probably still in the phase of collapse (Giuricin et al. 1988). On the other hand, in a low-density Universe, clusters evolve quite rapidly, and their formation process should be over by now. Following Ellingson et al. (2001), we estimate that the infall rate of field galaxies in nearby clusters is % of the total cluster population per Gyr. Time-dependent terms in the Jeans equation could be needed in more distant clusters, or when galaxies are subject to tidal disruption (e.g. spirals in cluster centres, see Katgert et al. 2002).
The Jeans equation is derived from the collisionless Boltzmann equation, and its applicability is limited to collisionless fluids. Clusters of galaxies are not collisionless in their inner regions (e.g. Biviano et al. 1992; den Hartog & Katgert 1996), and dynamical friction and mergers could be important for very massive custer galaxies. It is then wise to exclude the brightest cluster members from the sample (Katgert et al. 2002).
Interlopers are not a serious problem, when one deals with a composite sample of several hundred galaxies. Different methods of interloper rejection give similar results (Fadda et al. 1996). Subclustering is a more serious issue, since galaxies in subclusters are distributed in a different way from the smooth cluster population (Biviano et al. 2001; see also Katgert’s contribution in these proceedings). It is better to identify galaxies belonging to subclusters, and to exclude them from the sample (Katgert et al. 2002).
Finally, the basic problem of the “Jeans” approach is that the solution is intrinsically degenerate; we can either assume and determine , or viceversa, but we cannot simultaneously constrain and from the observables (see, e.g., King 1972; Bailey 1982). A possible solution consists in modelling the whole velocity distribution of cluster galaxies, and not only its second moment (Merritt 1987; Merritt & Saha 1993). Another possibility is to break this degeneracy by the use of several different tracers of the same gravitational potential (Katgert et al. 2002; see Sect. 3.6).
3. Mass profiles and orbital anisotropies: results so far
Seven decades since its first application to Coma (Zwicky 1933) the virial theorem has not found simple alternatives yet (see Perea et al. 1990 and references therein). The main improvement over the classical virial method has been the introduction of the “surface-term” (The & White 1986; see also Sect. 3.4). The solutions to the direct Jeans approach provided by Binney & Mamon (1982) and Solanes & Salvador-Solé (1990), have never been applied to galaxy cluster data-sets so far, because these data are noisy. Most analyses therefore model the profiles instead of deriving them directly from the data. If the models are not general enough, this procedure can lead to biased results. That is why non-parametric approaches have been developed, mostly by Merritt and collaborators (Merritt & Saha 1993; Merritt & Tremblay 1994; Merritt & Gebhardt 1994; Gebhardt & Fisher 1995).
Despite these technical improvements, the question of whether or not the cluster mass is distributed like the galaxies has not received a definite answer yet. In clusters, as well as in groups, recent works provide evidence both in favour (Carlberg et al. 1997a; Mahdavi et al. 1999; van der Marel et al. 2000), and against (Koranyi et al. 1998; Rines et al. 2000; Carlberg et al. 2001) the hypothesis of a constant mass-to-light ratio with radius. Cluster mass density profiles are found to be in agreement with the ’universal’ profile of Navarro, Frenk & White (1997; NFW hereafter), but other models are acceptable as well (Carlberg et al. 1997b; van der Marel et al. 2000; Geller, Diaferio & Kurtz 1999). From a theoretical point of view, the situation is not much clearer. Both decreasing and increasing mass-to-light profiles are predicted, resulting from the processes of tidal stripping (Mamon 1999), or, respectively, of dynamical friction and merging (Fusco-Femiano & Menci 1998).
Numerical simulations show that dark matter particles are characterized by a moderate radial anisotropy, increasing out to (e.g. Diaferio 1999). However, the idea of shells of collapsing material around clusters has been around since the work of Gunn & Gott (1972). This work stimulated several investigations, and the evidence for the infall of spirals into clusters has been accumulating over the years. Indirect evidence comes from the larger velocity dispersion of spirals as compared to that of early-type galaxies (Moss & Dickens 1977; Sodré et al. 1989). More direct evidence is provided by the analyses of the Tully-Fisher distance-velocity diagram in nearby clusters (Tully & Shaya 1984; Gavazzi et al. 1991).
Additional constraints on the orbital anisotropy of cluster galaxies come from the analysis of their velocity distributions. Most studies conclude that the orbits of early-type galaxies are quasi-isotropic, and those of late-type galaxies moderately radial (Mohr et al. 1996; Biviano et al. 1997; Adami et al. 1998; van der Marel et al. 2000, see also Sect. 3.3), with the exception of Ramírez & de Souza (1998, see Sect. 3.1). Similar results are also found by the application of dynamical models (e.g. Natarajan & Kneib 1996; Carlberg et al. 1997c; Mahdavi et al. 1999).
Other methods for constraining the galaxy orbits include Pryor & Geller’s (1984) and Merrifield’s (1998). Pryor & Geller try to constrain the orbits of HI-deficient galaxies by noting that cluster core-crossing is a necessary condition for gas stripping. Merrifield suggests using the radio or X-ray trails of galaxies in order to constrain their orbits.
3.1. Ramírez & de Souza
Ramírez & de Souza (1998) propose to use as a robust shape estimator of the velocity distribution of cluster members. The value of the anisotropy of galaxy orbits is obtained by comparing the observed values of with those derived from a kinematical model. The model is rather over-simplified, and not very realistic: the velocity distribution is Gaussian at any radial distance, and both and are constant.
Van der Marel et al. (2000) point out that the assumption of Gaussianity is not acceptable for anisotropic models. Another problem is that Ramírez & de Souza (1998) do not compute and on the same sample. E.g., when they consider the subsample of ellipticals, is still computed on all cluster galaxies. This effectively makes the parameter a scale rather than a shape estimator. They find that ellipticals have a lower than spirals, but this is just a restatement of the finding of Moss & Dickens (1977; see also Adami et al. 1998), that ellipticals have a lower velocity dispersion than spirals, and do not support Ramírez & de Souza’s (1998) claim of radial anisotropy.
3.2. Carlberg et al.
Carlberg et al. (1997a,b) analyse the internal dynamics of galaxy clusters from CNOC, by the “inverse” Jeans approach (see Sect. 2). They adopt ad hoc functional forms for , , and , project them in 2D, and constrain their parameters via a comparison with the observables. The advantage of their approach is that the chosen functions are well behaved, and easy to invert, but the solution for is to some extent imposed a priori (Merritt & Gebhardt 1994).
Their results are based on galaxy members in a composite of 14 “regular” clusters. They find that galaxies trace the mass, to within %, and the anisotropy is null or at most mildly radial, . The mass profile is found to be consistent with a NFW profile, but other profiles (Hernquist 1990) provide equally acceptable, if not better, fits.
Carlberg et al. (2001) have recently applied the same technique on a composite sample of galaxies in groups from the CNOC2. They find a strongly increasing mass-to-light ratio with radius, at variance with the findings of Mahdavi et al. (1999). The construction of a composite group sample is anyway problematic, due to uncertainties in the mean velocity and velocity dispersions of individual groups. Moreover, removing interlopers in small galaxy groups is a difficult task. Finally, groups may be far from virialization (Giuricin et al. 1988). Therefore, I feel that Carlberg et al.’s result needs confirmation by independent analyses.
3.3. van der Marel et al.
The CNOC sample has recently been re-analysed by van der Marel et al. (2000) using the method developed by van der Marel (1994). They assume a three-parameter family of models for the mass density profile, , and a set of values for the anisotropy , taken to be a constant over radii, and determine the model parameters from the best-fit to . The galaxy density profile is derived via Abel-inversion from a parametric representation of . Their approach improves over Carlberg et al.’s, since both the adopted model for , and the function representing , are quite general. On the other hand, a constant is unlikely to be a realistic model.
In order to break the intrinsic degeneracy between and , van der Marel et al. take into account the shape of the whole velocity distribution of cluster members (following the idea of Merritt & Saha 1993). They are thus able to conclude that mass follows light to within %, ranges from to 0.1, and a NFW profile is an acceptable fit to – but not unique.
3.4. Girardi et al.
Girardi et al. (1998) work out the masses of 170 clusters, the largest sample analysed so far, using the virial theorem with the surface-term correction. In order to work out this correction, they first determine from the Abel inversion of a (simple) parametric representation of . Assuming , they then determine which of three -models provides the best-fit to . From and , and the surface-term correction are derived. In principle, it is then possible to compute the corrected virial mass at any radius, hence the mass profile, but the solution is certainly biased by the rather arbitrary assumptions.
They find that the surface-term correction is important, of order 20% at the virial radius (in agreement with The & White 1986, and Carlberg et al. 1997b). They find good agreement between their optically-determined cluster masses and those derived from the X-ray data. Using the same algorithm, Girardi & Mezzetti (2001) claim no evidence for the evolution of the internal cluster dynamics up to .
3.5. Diaferio & Geller
Based on the results of numerical simulations of structure formation, Diaferio & Geller (1997) and Diaferio (1999) have devised a new method for determining cluster mass profiles. They show that the velocity field of cluster surroundings is determined by the cluster mass distribution, via where is the amplitude of the caustics in the space, and is a function of the gravitational potential and of the anisotropy profile, assumed to be a constant. The caustics are determined by an adaptive kernel method.
The “caustic method” does not rely upon the hypothesis of virial equilibrium, and thus it allows estimating to large radii, where other methods fail. On the other hand, the choice of the caustic in the plane is rather subjective, and the approximation constant is valid only beyond 1–2 .
Using this method Geller et al. (1999) estimate of the Coma cluster out to 14 Mpc, and find it to be well fitted by a NFW profile. Rines et al. (2000) determine the mass-to-light profile of Abell 576 out to 6 Mpc, and find it to be decreasing with radius. A similar indication for little mass outside the virialized cluster region is found by Reisenegger et al. (2000) in the Shapley supercluster. However, the method can constrain only to within a factor two (Diaferio 1999), and a constant mass-to-light profile is probably still consistent with the data.
3.6. Katgert & Biviano
Peter Katgert and myself, we are currently analysing the internal dynamics of a composite data-set of galaxies in clusters from ENACS. We build directly from and , instead of modelling and with ad hoc chosen functions. In fact, “using ad hoc parametrized models severely bias the answer regardless of the quality of the data” (Merritt & Gebhardt 1994). Our approach is fully non-parametric; we use LOWESS (Gebhardt & Fisher 1995) to provide a smoothed representation of the observed profiles, which we invert to provide the mass profile in the isotropic case. Using several tracers of the gravitational potential (i.e. ellipticals and S0’s, early spirals, late spirals and ELG) we expect to break the intrinsic degeneracy of the problem, to constrain the orbits of cluster galaxies, and to test whether different galaxy populations are in equilibrium within the same gravitational potential.
The main problem of this method is numerical instability. This can be solved by smoothing the data, but excessive smoothing must be avoided, not to erase useful information in the observed profiles.
Preliminary results (Biviano et al. 1999; Mazure et al. 2000) indicate that different cluster galaxy populations are characterized by different anisotropy profiles.


4. Four new methods and one data-set
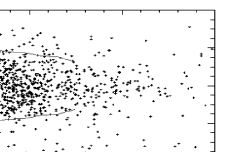
In this Section I compare the results obtained by four different methods on the same data-set. I consider 37 ENACS (Katgert et al. 1996, 1998) clusters with at least 45 galaxy redshifts, totalling 3365 galaxies. The observational data are shown in Fig. 1, where I also display the location of the caustics, determined with the method of Diaferio (1999). From these clusters I remove interlopers (following den Hartog & Katgert 1996), and galaxies with a significant probability of being in subclusters (following Biviano et al. 2001). I then build a composite cluster, in which galaxy velocities are scaled with the cluster ’s, and galaxy clustercentric distances are scaled with the cluster ’s. There are 1557 non-ELG and 217 ELG in this “cleaned” composite cluster. I apply the methods of Carlberg et al., Girardi et al., and van der Marel et al. to the sample of 1557 non-ELG. The last method is also applied to the sample of 217 ELG. Diaferio & Geller’s metod is instead applied on the uncleaned sample of 3365 galaxies, since it does not require preliminary removal of interlopers, or subclusters. Results of the method of Katgert & Biviano will be presented elsewhere (Katgert et al. 2002).
The advantage of using a composite cluster is that one reduces asymmetries in the galaxy distributions, thus effectively imposing the circular symmetry to the problem. But of course, the composite cluster is an artificial construction, and as such it may bear no resemblance to any real cluster. On the other hand, we may reasonably expect that results obtained for this composite cluster are representative of the average cluster population. It is important to use a homogeneous sample (like ENACS, or CNOC) for properly dealing with observational selection functions. This is particulary important for the determination of (for further details, see Biviano et al. 2001).
In Fig. 2a,b I plot the and for the 1557 non-ELG. Also shown are the three fits to these profiles, determined using the three different methods labelled in the Figure, and assuming . The most remarkable differences occur where the data are less constraining, i.e. at small and large radii. They are caused by different choices of the fitting functions.

The mass profiles determined with the four different methods (assuming where needed) are shown in Fig. 3. The mass scale is arbitrary and the different values of indicate that different effective values of are implied by the different methods. Approximate 1- confidence intervals are determined by splitting the sample in two, and independently computing on each subsample. The four different estimates of the mass profile are not in agreement. the mass at any given radius is uncertain by a factor two, and systematic errors dominate over random errors.
In Fig.s 4a,b I show the integrated mass-to-number and mass-to-luminosity ratios as a function of radius, computed with the four different methods. On average, light seems to trace mass to within %, at radii . In the central region, the mass seems to be more concentrated than the galaxies, but less than their light, an indication of luminosity segregation (see, e.g., Biviano et al. 1992).
The determination of the mass for the non-ELG is based on the assumption of isotropy. This assumption is supported by the analysis of the non-ELG velocity distribution, shown in Fig. 5a, alongwith its Gauss-Hermite representation. The Gauss-Hermite moments of this distribution clearly indicate that isotropy (or, at most, mild tangential anisotropy, ) is a valid assumption.
I then consider the sample of 217 ELG. I assume that the non-ELG mass profile, in the isotropic assumption, is the true cluster mass profile, and solve for of the ELG, using the method of van der Marel et al. I show in Fig. 5b the best-fit solution for a constant . For consistency, the solutions for non-ELG are also shown, where deviations from the expected solution are indicative of the accuracy of the method. The data indicate a moderate degree of radial anisotropy for the ELG, , at 68% confidence level. Zero anisotropy models for the ELG are rejected at % probability.


5. Conclusions
The use of member galaxies to determine the internal cluster dynamics is now reaching an unprecedented level of accuracy, thanks to the increasing amount of data (ENACS, Katgert et al. 1996, 1998; CNOC, Yee, Ellingson, & Carlberg 1996; Coma, Geller et al. 1999; Abell 576, Rines et al. 2000), and the development of new algorithms. The size of the data-sets must still be increased if we want to separately consider different cluster galaxy populations (e.g. early-types and late-types).
Whatever the sample size, it is difficult to discriminate among different models for the cluster mass density profile. This is because models either differ at large radii, where the cluster fades into the field, or near the centre, where one samples the cD rather than the cluster potential. The determination of cluster mass profiles appears to suffer from the systematics of different methods. Even on samples of galaxies, the total mass of a cluster can be uncertain by a factor two. Such an uncertainty also affects our current knowledge of the relative distributions of mass and light. Taking the data at face value, there are now some indications that mass is indeed roughly traced by light, at least outside the very central region (where there is evidence for luminosity segregation). Finally, independent analyses suggest that different cluster galaxy populations are characterized by different orbits. The currently best-buy model has (spectral or morphological) early-type galaxies on fairly isotropic orbits, and late-type galaxies on moderately radial orbits.


Ever since Zwicky (1937) we have been aware of the need for estimating cluster masses by different means. Different methods are affected by different biases, which are sometimes difficult to properly correct for. The perspective for improving upon the current situation is therefore clear. We need to constrain the cluster internal dynamics by the complementary analyses of the distribution of cluster members, as well as of X-ray and gravitational lensing data. For this, coordinated multi-wavelength surveys of galaxy clusters, using several instruments, are needed. Most promising, in this respect, is the upcoming XMM Large Scale Structure Survey222http://vela.astro.ulg.ac.be/themes/spatial/xmm/LSS/index_e.html, but a much more intensive spectroscopic follow-up than currently planned would be required to properly address the issue of internal cluster dynamics.
Acknowledgments.
I wish to thank Stefano Borgani, Marino Mezzetti and Riccardo Valdarnini for organizing such an interesting and entertaining workshop. I acknowledge useful discussions with Peter Katgert, Marisa Girardi and Alain Mazure.
This paper is dedicated to the memory of my parents, Angelo and Anita.
References
Adami, C., Biviano, A., & Mazure, A. 1998, A&A, 331, 439
Bailey, M.E. 1982, MNRAS, 201, 271
Binney, J., & Mamon, G. 1982, MNRAS, 200, 361
Binney, J., & Tremaine, S. 1987, “Galactic Dynamics” (Princeton: Princeton Univ. Press)
Biviano, A. 2000, in “Constructing the Universe with Clusters of Galaxies”, ed. F. Durret & D. Gerbal, http://www.iap.fr/Conferences/Colloque/coll2000/contributions/
Biviano, A., Durret, F., Gerbal, D. et al. 1996, A&A, 311, 95
Biviano, A., Girardi, M., Giuricin, G., Mardirossian, F., & Mezzetti, M. 1992, ApJ, 396, 35
Biviano, A., Katgert, P., Mazure, A. et al. 1997, A&A, 321, 84
Biviano, A., Katgert, P., Thomas, T., Mazure, A., & Adami, C. 1999,
1st workshop of the italian network
“Formazione ed evoluzione delle galassie”, eds.:
C. Chiosi, L. Portinari, & R. Tantalo, p.45,
http://www.brera.mi.astro.it/docB/galaxy/news.html
Biviano, A., Katgert, P., Thomas, T., Mazure, A., & Adami, C. 2001, A&A, submitted
Carlberg, R.G., Yee, H.K.C., Ellingson, E. 1997b, ApJ, 478, 462
Carlberg, R.G., Yee, H.K.C., Ellingson, E. et al. 1997c, ApJ, 476, L7
Carlberg, R.G., Yee, H.K.C., Ellingson, E. et al. 1997a, ApJ, 485, L13
Carlberg, R.G., Yee, H.K.C., Morris, S.L. et al. 2001, ApJ, 552, 427
den Hartog, R. & Katgert, P. 1996, MNRAS, 279, 349
Diaferio, A. 1999, MNRAS, 309, 610
Diaferio, A. & Geller, M.J. 1997, ApJ, 481, 633
Dupke, R.A., & Bregman, J.N. 2001, ApJ, 547, 705
Ellingson, E., Lin, H., Yee, H.K.C. & Carlberg, R.G. 2001, ApJ, 547, 609
Fadda, D., Girardi, M., Giuricin, G., Mardirossian, F., & Mezzetti, M. 1996, ApJ, 473, 670
Fusco-Femiano, R. & Menci, N. 1998, ApJ, 498, 95
Gavazzi, G., Scodeggio, M., Boselli, A. & Trinchieri, G. 1991, ApJ, 382, 19
Gebhardt, K. & Fischer, P. 1995, AJ, 109, 209
Geller, M.J., Diaferio, A., & Kurtz, M.J. 1999, ApJ, 517, L23
Girardi, M. & Biviano, A. 2002, to appear in “Merging Processes in Clusters of Galaxies”, ed. L. Feretti, I.M. Gioia, & G. Giovannini (Dordrecht: Kluwer)
Girardi, M., Giuricin, G., Mardirossian, F., Mezzetti, M., & Boschin, W. 1998, ApJ, 505, 74
Girardi, M. & Mezzetti, M. 2001, ApJ, 548, 79
Giuricin, G., Gondolo, P., Mardirossian, F., Mezzetti, M., & Ramella, M. 1988, A&A, 199, 85
Gunn, J.E. & Gott, J.R. III 1972, ApJ, 176, 1
Hernquist, L. 1990, ApJ, 356, 359
Hubble, E., & Humason, M.L. 1931, ApJ, 74, 43
Katgert, P., Biviano, A. et al. 2002, in preparation
Katgert, P., Mazure, A., den Hartog, R., Adami, C., Biviano, A., & Perea, J. 1998, A&AS, 129, 399
Katgert, P., Mazure, A., Perea, J. et al. 1996, A&A, 310, 8
King, I.R. 1972, ApJ, 174, L123
Koranyi, D.M., Geller, M.J., Mohr, J.J., & Wegner, G. 1998, AJ, 116, 2108
Mahdavi, A., Geller, M.J., Böhringer, H., Kurtz, M.J. & Ramella, M. 1999, ApJ, 518, 69
Mamon, G. A. 1999, in “Dynamics of Galaxies: from the Early Universe to the Present”, ASP Conf. Series 197, ed. F. Combes, G.A. Mamon, & V. Charmandaris, p.377
Mazure, A., Biviano, A., Katgert, P., Thomas, T. & Adami, C. 2000, in “Galaxy Dynamics: from the Early Universe to the Present”, ASP Conf. Series 197, ed. F. Combes, G.A. Mamon, & V. Charmandaris, p.373
Merrifield, M.R. 1998, MNRAS, 294, 347
Merritt, D. 1987, ApJ, 313, 121
Merritt, D. & Gebhardt, K. 1994, in “Clusters of Galaxies”, ed. F. Durret, A. Mazure & J. Tran Thanh Van (Gif-sur-Yvette: Editions Frontières)
Merritt, D. & Saha, P. 1993, ApJ, 409, 75
Merritt, D. & Tremblay, B. 1993, AJ, 106, 2229
Mohr, J.J., Geller, M.J., Fabricant, D.G., Wegner, G., & Thorstensen, J. 1996, ApJ, 470, 724
Moss, C. & Dickens, R.J. 1977, MNRAS, 178, 701
Natarajan, P. & Kneib, J.-P. 1996, MNRAS, 283, 1031
Navarro, J.F., Frenk, C.S. & White, S.D.M. 1997, ApJ, 490, 493 (NFW)
Perea, J., del Olmo, A., & Moles, M. 1990, A&A, 237, 319
Pryor, C., & Geller, M.J. 1984, ApJ, 278, 457
Ramírez, A.C. & de Souza, R.E. 1998, ApJ, 496, 693
Reisenegger, A., Quintana, H., Carrasco, E.R., & Maze, J. 2000, AJ, 120, 523
Rines, K., Geller, M.J., Diaferio, A., Mohr, J.J., & Wegner, G.A. 2000, AJ, 120, 2338
Smith, S. 1936, ApJ, 83, 23
Sodré, L.J., Capelato, H.V., Steiner, J.E. & Mazure, A. 1989, AJ, 97, 1279
Solanes, J.M. & Salvador-Solé 1990, A&A, 234, 93
The, L.S. & White, S.D.M. 1986, AJ, 92, 1248
Tully, R. B. & Shaya, E. J. 1984, ApJ, 281, 31
van der Marel, R. 1994, MNRAS, 270, 271
van der Marel, R., Magorrian, J., Carlberg, R.G., Yee, H.K.C., & Ellingson, E. 2000, AJ, 119, 2038
Yee, H.K.C., Ellingson, E. & Carlberg, R.G. 1996, ApJS, 102, 269
Zwicky, F. 1933, Helv. Phys. Acta, 6, 110
Zwicky, F. 1937, ApJ, 86, 217