Dust In I Zw 18 From Hubble Space Telescope111Based on
observations with the NASA/ESA Hubble Space Telescope, obtained at the
Space Telescope Science Institute, which is operated by the Association
of Universities for Research in Astronomy, Inc. under NASA contract No.
NAS5-26555.
Narrow Band Imaging
Abstract
We present new WFPC2 narrow band imaging of the blue compact dwarf galaxy I Zw 18, which is host to the lowest-metallicity H ii regions known. Images at H and H are combined with archival broad band images to allow the study of the ionized gas distribution and morphology. Analysis of the H/H flux ratio reveals significant enhancements in some areas of both the “Northwest” and “Southeast” regions of the galaxy, with ratios elevated to levels as high as 3.4. The H/H ratio varies considerably with position throughout the galaxy. Comparing this distribution with the stellar distribution indicates that the regions of enhanced H/H ratio are not due to the effects of either collisional excitation or underlying stellar absorption, and therefore are most likely interpreted as the presence of dust. This dust has an estimated mass of (2-5)103 M⊙, which is consistent with the IRAS far-IR non-detection. Under the assumption that dust traces the presence of molecular gas, these results suggest that the molecular component of the ISM of I Zw 18, which is needed to fuel its active star formation, is also very clumpy. Such a distribution would be consistent with the recent FUSE non-detections of diffuse H2.
1 Introduction
Since its discovery (Zwicky, 1966), the blue compact dwarf (BCD) galaxy I Zw 18 has been an exemplary low metallicity star forming galaxy and has undergone remarkable observational scrutiny. The galaxy hosts the lowest metallicity H ii regions known in the local universe, with oxygen abundances (O/H) 0.02 (O/H)⊙ (Skillman & Kennicutt, 1993, hereafter SK93). As such, the study of I Zw 18 is essential in various astrophysical arenas, including dwarf galaxy evolution, primordial helium abundance measurements, and star formation mechanisms.
With an H i heliocentric radial velocity of 749 km sec-1, a distance of 10 Mpc is usually assumed for I Zw 18 (e.g., van Zee et al., 1998). Östlin (2000) suggests a slightly larger value of 12.6 Mpc to account for Virgocentric infall. The precise distance determination of I Zw 18 is beyond the scope of this paper; we follow Östlin (2000) in adopting a distance of 12.6 Mpc, but note that this condition is uncertain and is worthy of extensive future study.
The low metallicity of the I Zw 18 system has led to the suggestion that it is undergoing its first burst of star formation (Kunth & Sargent, 1986). However, the uniformity of the nebular abundances derived by SK93 in the two main components of the system argues against this hypothesis. The evolutionary status of I Zw 18 is of paramount importance, since the system offers the closest known reproduction of pristine conditions and therefore the best low metallicity environment in which to study big bang nucleosynthesis at low redshift. Additional physical mechanisms have also been studied in detail in I Zw 18 to discern their behavior at very low metallicities (e.g., heating and cooling balance, Stasińska & Schaerer, 1999).
The nature of previous generations of star formation within I Zw 18 has not yet been fully characterized. Interestingly, the nebular C/O ratio was found to be elevated in I Zw 18 with respect to other comparably metal-poor irregular galaxies and above the predictions of massive star nucleosynthesis (Garnett et al., 1997, but see also Izotov & Thuan 1999). The implication of such an observation is that I Zw 18 may have undergone a previous episode of star formation; this conclusion is supported by the discovery of a population of 0.5-5 Gyr old Asymptotic Giant Branch (AGB) stars from HST/NICMOS imaging (Östlin, 2000). CMD analysis by Aloisi, Tosi, & Greggio (1999) also suggests the presence of evolved intermediate mass stars in the blue loop phase which may be as low as 3-4 M⊙, implying ages of 0.3-0.6 Gyr. Photometric investigations thus suggest that I Zw 18 has an (at least) intermediate age stellar population and is thus not evolutionarily young.
I Zw 18 has been the target of deep HST studies since the launch of the spacecraft, and numerous archival studies have also been executed. The present new images complement and, where possible, improve on, previous works. Imaging studies of the nebular emission (H, He ii) were carried out by Hunter & Thronson (1995, hereafter HT95) and DeMello et al. (1998). The former analyzed the stellar distribution and derived properties of the ionized gas distribution (H ii region characteristics, age arguments). The latter used He ii emission to characterize the population of Wolf-Rayet stars within the galaxy. This study adds to these works, in that we have deeper, higher resolution H imaging, and combine this with H imaging to derive reddening characteristics within the galaxy. This is the first imaging diagnostic of the internal extinction using HST data. Previous evidence for dust in I Zw 18 has come from several ground-based spectroscopic investigations wherein reddening is detected (SK93; Izotov & Thuan, 1998; Vílchez & Iglesias-Páramo, 1998; Legrand et al., 2000). The high spatial resolution afforded by these WFPC2 images allows us to explore the nature and spatial distribution of the dust and to address the possibility that the elevated H/H ratios arise from collisional excitation or underlying stellar absorption.
In this study, we seek to derive the dust properties of I Zw 18. The presence of dust at very low metallicities has implications both for the evolution of irregular and spiral galaxies, and also for cosmological models of structure formation in the present epoch. It is thus imperative that we understand all components of such systems. This paper is organized as follows. In § 2 we discuss the observations and their analysis. Presentation of the new H and H images, and their analysis and errors, are the topic of § 3. In § 4 we discuss the locations of areas rich in dust, the properties of that dust distribution, and the implications for the molecular gas content of the galaxy which this detection affords. We summarize our conclusions in § 5.
2 Observations and Data Reduction
Images were obtained with the Wide Field/Planetary Camera 2 (WFPC2) aboard the Hubble Space Telescope (HST) on 1998 April 4 and 1999 February 16. In addition, archival WFPC2 data from programs GO-5309 and GO-5434 were retrieved from the STScI archive222http://archive.stsci.edu to create a comprehensive dataset covering a large wavelength regime. Here, we discuss the H and H images, and their relevant continua from broad band images. A summary of the data used is presented in Table 1. Note that both H images were obtained using the F658N filter, because the redshift of the emission line gas in I Zw 18 (H heliocentric radial velocity range of 730-780 km sec-1, or z0.0025; Dufour, Esteban, & Castaneda, 1996) places the 6563 Å H line in the range of peak sensitivity of the F658N filter. All reductions and analysis were performed in the IRAF/STSDAS environment333IRAF is distributed by the by the National Optical Astronomy Observatories, which are operated by AURA, Inc., under cooperative agreement with the National Science Foundation..
2.1 Calibration and Registration
The data were initially processed through the standard HST pipeline. The pipeline-processed images were then corrected for geometric distortion, charge transfer efficiency, warm pixel effects, and cosmic ray contamination. The background level of each image was then removed manually. The archival broad band images were flux calibrated by multiplying by the image header keyword PHOTFLAM (erg sec-1 cm-2 Å-1), defined as the mean flux density that produces a count rate of 1 sec-1, and then dividing by the header keyword EXPTIME (length of exposure). The On-The-Fly Calibration scheme, implemented by STScI, ensures all header keywords contain the most appropriate values.
For the narrow band images, the PHOTFLAM keyword was replaced by a synthetic value obtained by applying the SYNPHOT package; here, the photometric parameters of an observation passband are calculated individually. Outputs which were used in the present analysis included the modified photometric calibration (output parameter URESP), the filter width, and a correction for emission features which appear away from the peak of a filter’s sensitivity curve. Table 2 contains URESP and PHOTFLAM values for narrow band images, as well as the system response efficiency corrections which were applied. Finally, all images were rotated and shifted into the orientation of the new WF3 H image. We find our registration to be accurate to within 0.05″ in the WF3 images (1 pixel = 0.0996″) and to within 0.03″ in the PC images (1 pixel = 0.0455″).
2.2 Continuum Subtraction
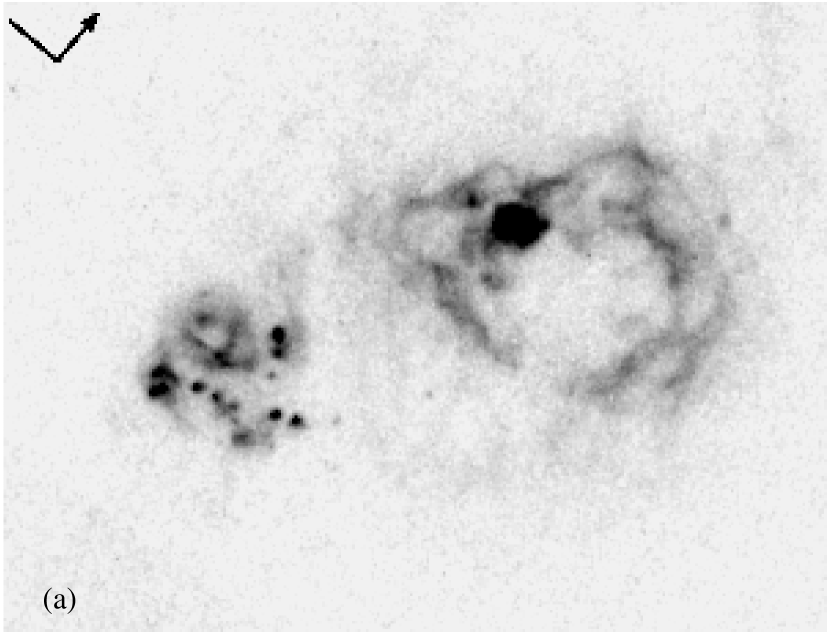
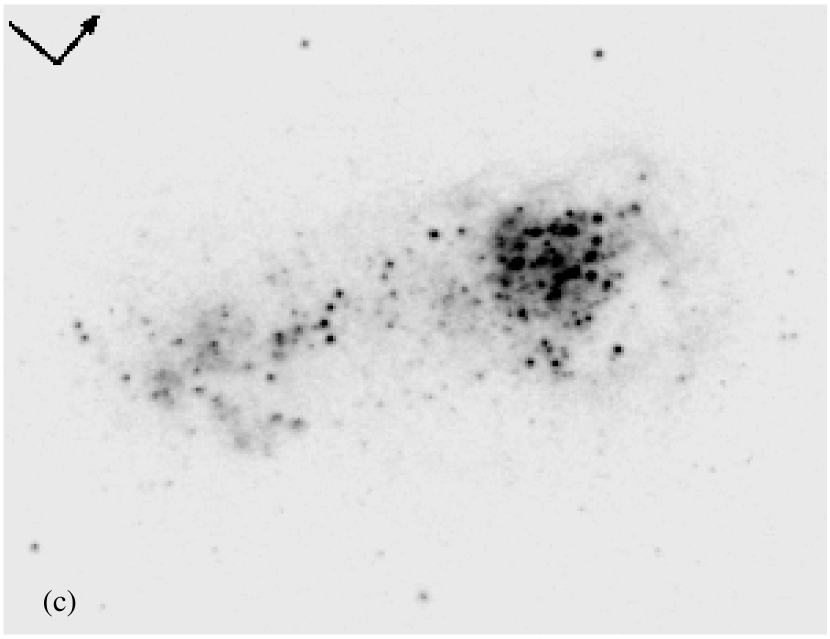
For narrow band photometry, the removal of the underlying stellar continuum is a crucial component of the data analysis. The contribution to the narrow band images from underlying continuum sources was found in a recursive manner. First, the narrow band image, which includes continuum contamination, was scaled by a factor roughly representative of the ratio of emission contained in the narrow bandpass to that contained in the total wide bandpass. Typically, this scaling factor was of the order of a few percent. The resultant scaled image was then subtracted from the wide band image whose filter response curve most closely isolated the redshifted emission features in question, and which contained the fewest number of other significant emission lines. Of course, this problem is unavoidable for certain of the emission line images, for example, [O III] and H. In such cases, the narrow band images were combined prior to the iterative subtraction process. This procedure was repeated by using different scaling factors until the wide band image no longer retained significant diffuse structure which is indicative of emission line radiation. Once this iterative procedure was completed, we were left with a pure continuum image, free from the line emission in question. This scaled continuum image was then subtracted from the original narrow band image(s) to produce a pure emission line (i.e., continuum-subtracted) map. In Figures 1a and 1c, we show the PC H image and the underlying stellar continuum which was removed from it.
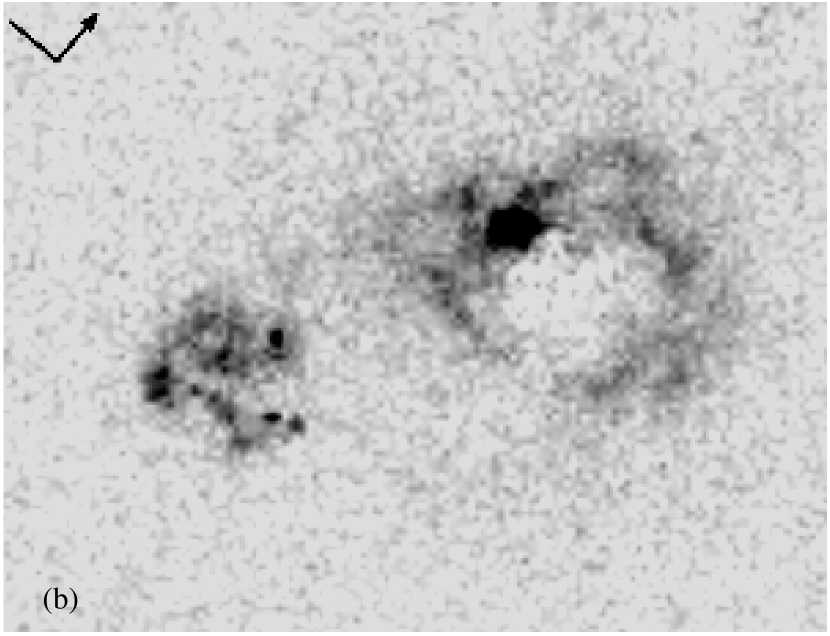
The continuum scaling fraction was independently calculated using the SYNPHOT package. The throughputs of the narrow band and wide filters were found at the wavelengths of the redshifted emission lines. The ratio of throughputs was then multiplied by the ratio of effective filter widths. The fractions found by these two methods agree to better than one percent for both emission line images. In order to obtain the total amount of line emission from I Zw 18, the pure emission line images were then multiplied by the FWHM of each filter, as calculated by SYNPHOT. We thus have an absolute calibration for the narrow band images. The continuum-subtracted images in H and H are compared in Figures 1a and 1b, respectively. The total H flux from I Zw 18 is found to be 3.2610-13 erg sec-1 cm-2, in excellent agreement with the value calculated by DeMello et al. (1998), 3.310-13 erg sec-1 cm-2.
3 Emission Line Images
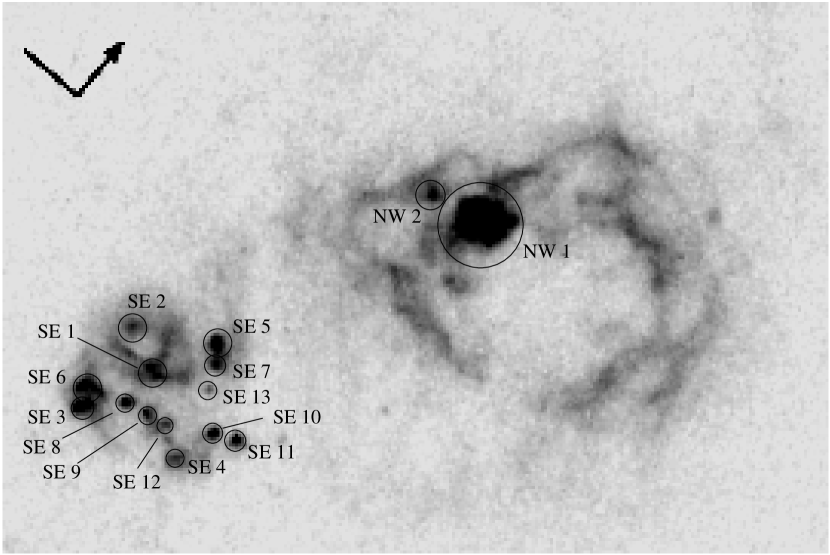
The ionized gas distribution of I Zw 18 is well-resolved in the PC H image (Figure 1a). A wispy, filamentary structure with prominent shells dominates the morphology of the galaxy in the light of H. The very bright H concentration in the NW region is slightly offset from the peak of continuum emission (compare Figures 1a and 1c). The Southeast (SE) region of the galaxy shows more bright knots in H than does the NW region, and less filamentary structure. We do detect a smaller shell in the SE region, however; as will be shown in § 4, this area is also coincident with a prominent dust concentration. The relative shell sizes in the NW and SE regions and the presence of more OB associations and less extended diffuse emission in the SE region is in good agreement with the observations by HT95 and Dufour et al. (1996) that this region contains younger stars than the NW component. The bright H ii regions in I Zw 18 as revealed in the PC image are shown in Figure 2 and detailed in Table 3 in order of decreasing H luminosity. Our catalog compares well with that of HT95; all of our features are also detected and cataloged therein, except for SE 13, the least-luminous H ii region detected, which was not visible in their F656N filter H image.
The continuum-subtracted H image (Figure 1b) shows a very similar structure to the H image. The signal-to-noise here is lower than in the H image (due to lower system throughput than the F658N filter (roughly a factor of 2 less), a shorter integration time, and the intrinsically fainter H emission line strength), and produces the limiting uncertainty in the calculated reddening values across the galaxy (see below). Note the general agreement in morphology of the two images; every filament of emission in H is also detected in H, down to the limit of the resolution in the latter image. Resolution of fainter H ii regions is lost in the H image (e.g., SE 13; see Figures 1b & 2, and Table 3).
3.1 Reddening in I Zw 18
Regions with high photon counts (i.e., large equivalent widths, hereafter denoted by EW(H) and EW(H) for H and H, respectively) in both H and H were next analyzed using aperture photometry to determine fluxes. Apertures were placed on identical regions in six different images: H and H fluxes, H and H photon counts, and continuum images used for each filter. To make sure that we were obtaining proper flux calibration of the H images, we performed this procedure for both the WF3 and PC F658N filter images, with continuum images selected to match the original resolution (i.e., PC continuum image used for PC H continuum subtraction, and likewise for the WF3 image). Table 2 (last two columns) contains data on the continuum subtraction values used to determine aperture flux ratios.
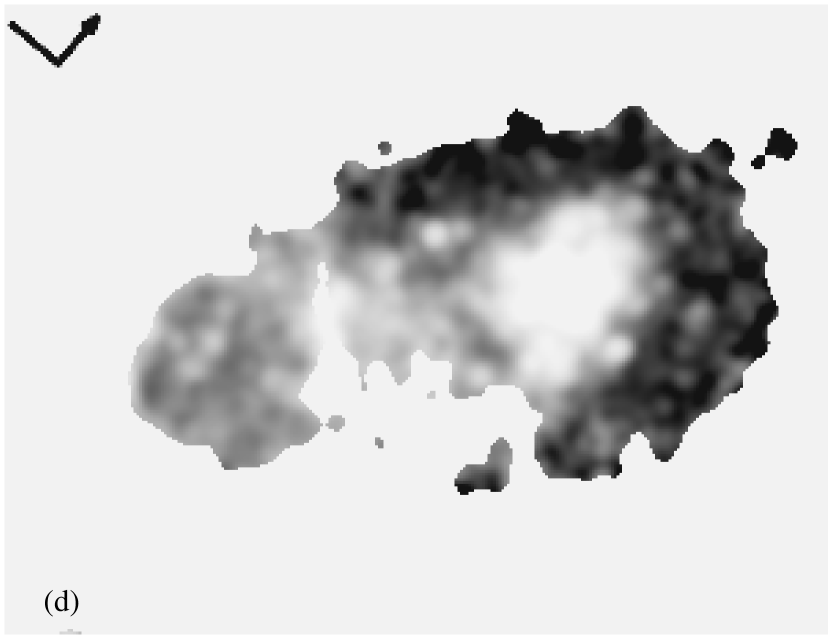
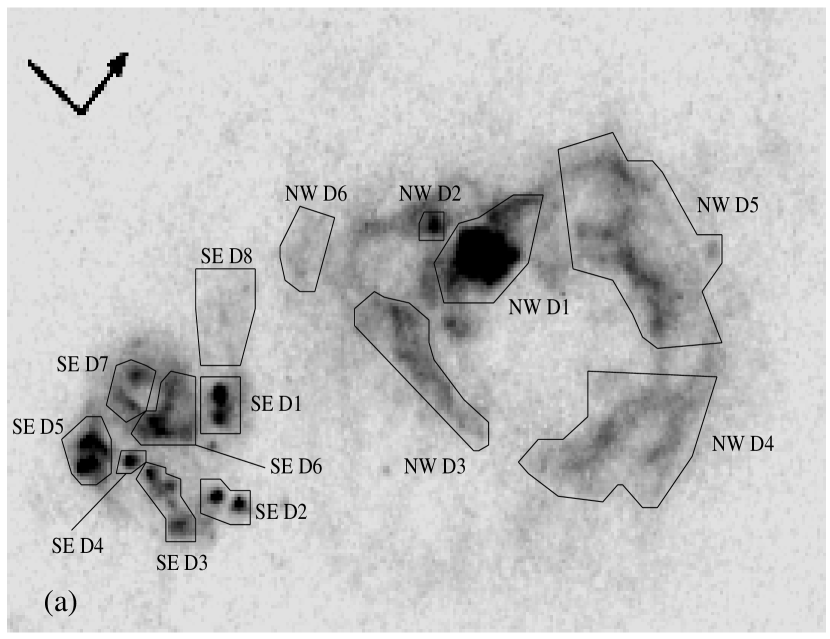
Upon preliminary analysis of the data, we found that using small circular apertures centered on the H ii regions (i.e., the apertures of the H ii regions as shown in Figure 2 and listed in Table 3) yielded unacceptably large errors for most of the catalogued H ii regions; the sources of these errors are discussed below. For this reason, we chose to expand the apertures to larger polygons which included the majority of visible flux when overlaid on each image, encircled areas of only high EW(H) and EW(H) (compare Figures 3a and 1d), and often contained multiple H ii regions in a single aperture. This technique minimizes potential errors caused by slight mis-registration of the images, and enhances the signal-to-noise ratio by increasing photon counts in each aperture (see below for further discussion). The locations of these larger polygonal apertures are shown in Figure 3a.
Flux ratios were then calculated by dividing H fluxes by H fluxes in each aperture. In the absence of dust, the H/H ratio is confined to a narrow range of values that is relatively insensitive to temperature and density. Following SK93, we adopt an electron temperature of 19,000 K for I Zw 18; we thus expect H/H = 2.76, based on the Balmer line ratios from Hummer & Storey (1987). Values that are elevated above this theoretical ratio are indicative of the presence of dust, which preferentially absorbs and scatters shorter wavelength radiation. We list in Table 4 the applied apertures, H and H fluxes, and flux ratios with errors. We note that all H/H ratios are consistent with the expected minimum theoretical value, and that the small errors make the detections of dust significant.
3.2 Error Sources
A potential major source of uncertainty in extragalactic reddening studies is the amount of foreground extinction due to gas and dust within the Galaxy. At a Galactic latitude of 45°, foreground extinction is expected to be low in I Zw 18. In the direction of I Zw 18, the (0306 resolution) maps of Burstein & Heiles (1982) indicate a foreground extinction of E(B-V) 0.01 magnitudes. The more recent, higher resolution ( 6′ FWHM) study of Schlegel, Finkbeiner, & Davis (1998) indicates that a marginally higher value of E(B-V) 0.03 magnitudes is applicable. Inspection of the extinction maps of this latter study indicates that there is no appreciable gradient in or fluctuation of E(B-V) across the luminous extent of I Zw 18; the average value applies over scales much larger than the field of view under study here (e.g., Figures 1(a)-(d)), and the foreground extinction is smooth on these scales.
For the purposes of this study, we seek to constrain the amount of internal extinction within I Zw 18. While there is a moderate amount of extinction between the observer and the galaxy, which we correct for in the following analysis, any variations in the H/H flux ratio observed are likely to be intrinsic to I Zw 18. Although we cannot rule out small-scale (i.e., arcsecond scales) local maxima in the foreground extinction which may affect our interpretation, we favor the hypothesis that searching for variations in the H/H flux ratio allows us to constrain the nature of dust within I Zw 18 itself. The studies by Burstein & Heiles (1982) and Schlegel et al. (1998) are consistent with values of 0 E(B-V) 0.03; we adopt an intermediate value of E(B-V) 0.02. Assuming RV 3.1, we then have a foreground extinction of 0.06 magnitudes, which is small compared to our regions of highest detected extinction. Following both of the aforementioned studies, we attach to this foreground value a 25% uncertainty, and propagate this through our final extinction values calculated in Section 4.1.1.
Uncertainties were calculated for the observed reddening values by applying Poisson statistics. We discuss other potential sources of error below; however, this should represent an accurate measure of the final error in the H/H ratio due to the lower signal-to-noise ratio of the H WF3 image compared to the H image. This dominant error term limits which sections of the image, and hence what physical conditions, may be sampled for the presence of dust. For example, the central region of the NW shell cannot be tested for the presence of dust, due to the fact that the number of detected H photons is too small to allow physically meaningful errors to be assigned.
Other sources of error in the flux calibration and image analysis procedures are discussed and deemed negligible as follows. We implicitly assume that removal of DC levels from images (e.g., background removal, scaling of images by numerical fractions) does not affect the standard deviation of the image, and therefore does not affect the error terms derived. Errors in continuum subtraction fractions were assessed by performing photometry on images with different continuum fractions than the final ones used. Changing the continuum subtraction fractions is a second order effect compared to the errors in number of counts. The values which we apply for continuum subtraction are also supported by the fact that the derived H/H flux ratios are all consistent with the lower limit theoretical ratio of 2.76 (Hummer & Storey, 1987, and arguments below). Furthermore, inspection of the continuum images (after removal of the narrow band, ionized component) reveals very little ionized gas remaining, indicating successful continuum subtraction (see Figures 1a and 1c).
We assume that the position angle of the WFPC2 camera is exactly known. Rotation of the images into the orientation of the new WF3 images was accomplished using simple linear interpolation between pixels. This method was favored due to its simplicity; we found no reason to apply more complicated interpolation schemes. Shifting the rotated images to align with the narrow band images is not an error-free process; as stated previously, we expect that image registration is accurate only to within a fraction of a pixel. Using the aforementioned larger polygonal apertures (see Figure 3a), we obtain higher photon counting statistics, ensuring that the contribution to the final error terms due to image rotation and mis-registration are of second order or higher in all cases.
4 Dust In I Zw 18
In § 3, we unambiguously detect elevated H/H flux ratios in various areas inside I Zw 18 (see Table 4). In this section, we characterize the dust content and denote some implications for the evolutionary status and molecular gas content of I Zw 18.
4.1 Dust Properties
4.1.1 Extinction, Errors And Potential Systematic Errors
We calculate reddening values for each aperture discussed in § 3 by applying the relation
| (1) |
where is the observed H/H flux ratio, is the theoretical ratio (2.76, Hummer & Storey, 1987) for the adopted temperature of 19,000 K (SK93), c is the logarithmic reddening correction at H, and (= -0.37) is calculated from the interstellar extinction curve of Seaton (1979) as specified by Howarth (1983). We then find c and solve for the extinction in magnitudes by applying the conversion factor between c and AV of Schild (1977), where AV 2.17 c. Finally, we correct for 0.06 magnitudes of foreground extinction (Burstein & Heiles, 1982; Schlegel et al., 1998) as discussed in § 3.2. These values are also listed in Table 4; note that all extinctions are rather small, the largest being 0.5 magnitudes, and a fiducial value being 0.2 magnitudes for the SE region. Thus, large spatial variations in internal extinction in I Zw 18 are not sufficient to compromise previous nebular abundance studies; however, the statistically significant elevation of some H/H flux ratios indicates that appreciable amounts of dust do exist within the galaxy and merit further investigation.
A potential difficulty in interpreting elevated H/H ratios as indicative of the presence of dust is the contribution from collisional excitation of H i. Davidson & Kinman (1985) and SK93 have discussed the possibility that the high electron temperatures in I Zw 18 may lead to collisional excitation of the neutral hydrogen, which would affect the emission line ratios of some of the lower-level hydrogen transitions, most notably H and H. Since this effect is directly proportional to the neutral hydrogen fraction, an observationally challenging quantity to measure, the importance of this effect has been difficult to assess. Photoionization models by Stasińska & Schaerer (1999) suggest that collisional excitation effects may affect the H/H ratio by as much as 11% in the NW region of I Zw 18. The distribution of enhanced H/H ratios observed here argues against the importance of collisional excitation of the neutral hydrogen. Most of the elevated H/H ratios are seen in the SE component, which has a lower electron temperature than the NW region (SK93; Izotov & Thuan, 1998). Furthermore, there is no evidence of enhanced H/H flux ratios in areas of expected lower ionization parameter (i.e., radial gradients around ionizing stars). Thus, we interpret the regions which demonstrate elevated H/H ratios (see further discussion below) to be regions with enhanced extinction. While we cannot rule out the possibility that collisional processes are making a limited contribution to the H emission in areas near UV-bright clusters (e.g., sections in the SE region; see Figure 3a), the effect is minimal even in these regions. For example, apertures SE D3 and SE D4 (see Table 4 and Figure 3a) are spatially separated by only 21.7 pc. The statistically different H/H flux ratio between the two suggests that, if collisional excitation is taking place, its effects are not severe enough to compromise the interpretation of the photometry of this study.
A second effect which may elevate H/H ratios above the theoretical value is an error in the assumed electron temperature, Te. If Te is much lower than the adopted value, any elevated H/H ratios will be caused by the preferential excitation of the lower-energy H transition compared to H. SK93 find Te to be lower in the SE region than in the NW (17,200 1,200 K and 19,600 600 K, respectively). However, as will be shown below, we find H/H flux ratios (corrected for foreground extinction) which are as high as 3.4. To attain such ratios as a consequence of an overestimated Te, the actual temperature would have to be as low as 2,500 K in some areas, and would have to vary on unphysically short spatial scales (of order parsecs). Neither of these effects are observed, nor are they predicted by models of the photoionization structure of the galaxy (Stasińska & Schaerer, 1999). We thus conclude that errors in the adopted Te provide a negligible error contribution in the following analysis.
Finally, it is possible that underlying stellar absorption may affect the pure emission line images. In regions with low EW(H) and EW(H), underlying stellar Balmer absorption may lower the H emission line flux relative to H, simulating the effect of dust. To look for this effect we have tabulated the EW(H) and EW(H) for each of our measured regions; Figure 1d shows the smoothed EW(H) map. If underlying absorption were important, one would expect an anti-correlation between the measured extinction and the EW(H). In fact, the data in Table 4 do show weak evidence of this trend. A regression of AV on EW(H) yields a correlation coefficient of -0.5. This is not direct evidence that some of the enhancement in the H/H ratio is due to underlying stellar absorption (it may be that dust is found preferentially associated with lower surface brightness stellar populations), but the effect does need to be considered. From the modeling of González Delgado, Leitherer, & Heckman (1999), the EW(H) of an instantaneous burst rises monotonically from 3 Å to 10 Å for ages of 0 to 200 Myr. In a constant star formation model EW(H) rises monotonically from 3 Å to 6 Å over the same period. If we could be confident that all of the stars in I Zw 18 were younger than 20 Myr, then an upper limit of 6 Å EW(H) of underlying H absorption would be reasonable. If there are stars older than this in I Zw 18, then the continuous star formation model would be more appropriate (which has a maximum value of 8 Å EW(H) for ages of 0.5 Gyr and higher). For our lowest EW(H) regions (75 to 100 Å), some, if not most, of the enhancement in the H/H ratio could be due to underlying stellar absorption if it were mixed with an intermediate age stellar population. However, for the regions with AV in excess of 0.15 (H/H 3.00) it is unlikely that the enhancement in the H/H ratio could be due solely to underlying stellar absorption. Note that in several regions (with EW(H) 120 to 160 Å, see Table 4) the H/H ratio is consistent with no reddening (and thus no effect of underlying absorption). Thus, while we cannot completely rule out some enhancement in the H/H ratio due to underlying stellar absorption, we can rule out that it is the dominant effect in the regions where we have the highest H/H ratios. Since these regions are the focus of what follows, we will assume that the effects of underlying absorption are negligible.
4.1.2 Dust Locations And Masses
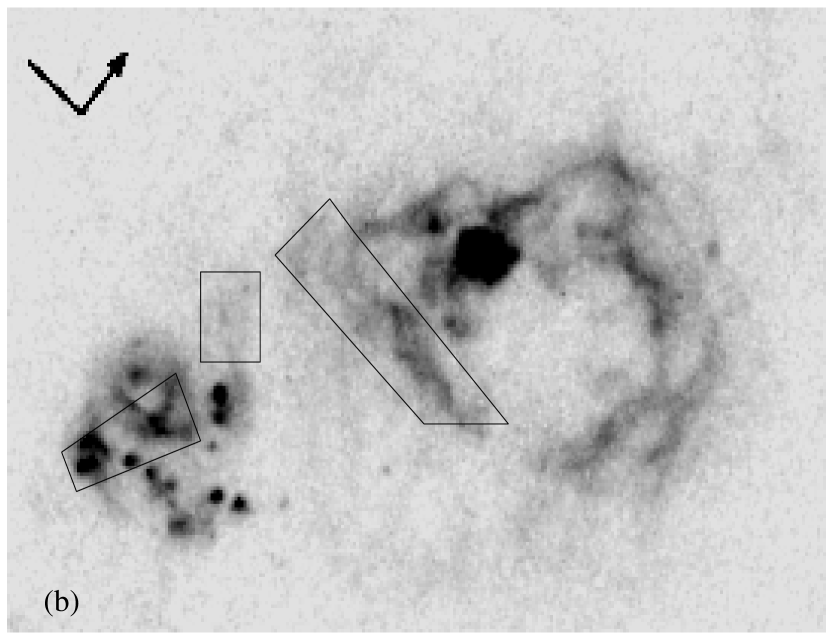
In Figure 3b, we overlay apertures on the PC H image of I Zw 18 which outline the locations of elevated H/H ratios (note that these trapezoidal apertures are meant to guide the eye to areas with H/H 3.0, and in some cases contain more than one of the apertures used to derive the H/H flux ratios). We detect dust in regions which are near UV-bright sources, as well as in regions which are far away from them. The high surface brightness H ii regions which have significant extinction are all located in the SE component, in agreement with the ground based optical observations (SK93; Izotov & Thuan, 1998; Vílchez & Iglesias-Páramo, 1998). This is expected, since the SE region contains younger stars and likely more dense molecular clouds than the NW region. The distribution of dust (and therefore molecular gas) suggests that future star formation is likely in the SE region; furthermore, the reddening morphology hints at the presence of a band of extinction between the SE and NW components. This region cannot be sampled for dust with the present H/H ratio method, due to the absence of H and H emission in this region (see § 3.2). Overall, we detect dust with a similar distribution to that found in the dwarf starburst galaxy NGC 5253 (Calzetti et al., 1997). The irregular nature of the dust distribution immediately implies one or both of the following scenarios. First, dust which is near UV-bright clusters is surviving in a very hard radiation field, implying an efficient mechanism of self-shielding on small scales and the prominence of clumpy structure in the ISM. Second, dust which is displaced from UV-bright clusters is consistent with dust production by a previous generation of star formation.
In order to estimate a mass of the dust which we detect, we must make certain assumptions about the nature of the grains. One method with which to obtain a dust mass estimate is to use the ratio of intensities of far infrared (FIR) emission at 60 and 100 m. However, I Zw 18 is not detected by the IRAS satellite in either waveband. A second method with which to find the dust mass is to apply a detailed balance argument, assuming one knows the nature of the incident radiation field and the composition of the grains. However, especially in the case of BCD’s such as I Zw 18 where the nature of the underlying stellar population is not yet fully characterized, this detailed balance argument is also not applicable.
A third and widely used method to obtain a dust mass is to apply a gas-to-dust ratio which is applicable to similar physical conditions (metallicity, radiation field, star formation efficiency, etc.). Seminal Galactic work on this correlation by Bohlin, Savage, & Drake (1978) finds that the mean ratio (H i H2)/E(B-V) is nearly constant (within a factor of 1.5), with a value of 5.81021 cm-2 mag-1. From a larger stellar sample, Diplas & Savage (1994) find a slightly lower value of 4.931021 cm-2 mag-1. Extinction studies in other environments suggest a trend of increasing gas-to-dust ratio with decreasing ambient metallicity. Extinction studies toward stars in the LMC arrive at an average value of (N)/E(B-V) = 2.41022 cm-2 mag-1 (Fitzpatrick, 1985; Dufour, Shields, & Talbot, 1982; Clayton et al., 1996). The more metal-poor conditions of the SMC yield yet higher values, perhaps as high as 1023 cm-2 mag-1 (Prévot et al., 1984).
The H i synthesis imaging study of van Zee et al. (1998) shows that there is a column density maximum of 31021 cm-2 which is coincident with the SE component (see their Figure 6). If we assume that the SE ionized component is embedded in an H i envelope, then we can make a very crude estimate of the ratio of H i column density to extinction by applying the relation
| (2) |
where we have assumed RV = AV/E(B-V) = 3.1, and that a representative value of the average extinction towards the SE region is AV = 0.2 mag. This value is comparable to, but less than, estimates of the gas-to-dust ratio in the SMC (3.7-5.21022 cm-2 mag-1; Bouchet et al., 1985). However, it makes no correction for a potentially large contribution from molecular hydrogen (necessary to sustain the high star formation rate; see arguments below), which may allow the two results to be consistent. Furthermore, this estimate only accounts for the fraction of the dust which may be foreground to I Zw 18; if a substantial amount of dust is located behind or mixed within the H ii regions, this argument will (perhaps significantly) underestimate the total dust mass within the galaxy.
Next, we must assume a value for the dust-to-gas ratio by mass in order to obtain a dust mass estimate. We make such an assumption in two ways. First, we note that Stanimirovic et al. (2000) finds the average dust-to-gas ratio in the SMC to be 8.210-5 by mass (roughly 30 times less than in the Galaxy). Since this is the lowest-metallicity galaxy which has well studied extinction properties, we naively apply this ratio to I Zw 18. This represents an apparent upper limit, since there is evidence of a trend towards lower dust-to-gas ratios at lower metallicities, as previously mentioned, and the metallicity of I Zw 18 is 0.8 dex lower than that of the SMC. Applying such an assumption and Equation 2, rewritten in the more convenient form
| (3) |
we arrive at a dust mass of 2000 M⊙ (with no correction for the molecular gas content).
The second method with which to estimate the dust-to-gas ratio is to apply the analytical relation found by Lisenfeld & Ferrara (1998, hereafter LF98), . While this relation was derived for dwarf irregulars and not BCD’s, we include it for completeness, and because the application of the relation to the SMC yields a dust-to-gas ratio of 6.510-5 by mass, in general agreement with the observational result of Stanimirovic et al. (2000). Applying the same relation to I Zw 18, we obtain a dust-to-gas ratio of 1.710-4 by mass, which is consistent with the upper limit of 3.710-4 obtained by LF98 by assuming a 100 m flux for I Zw 18. We thus assume a value of 210-4 for the dust-to-gas ratio using this relation, but note its general uncertainty, and that it appears high in comparison to observational estimates from other low-metallicity systems (e.g., Stanimirovic et al., 2000). Application of Equation 3 then yields a dust mass of 4800 M⊙.
From the above arguments, we estimate a total dust mass of (2-5)103 M⊙ within I Zw 18, due to the lack of further constraints which may be placed on the nature of the dust content from these observations. We note that this dust mass is lower than all of the BCD’s which are detected in the IRAS bands in the study by LF98, as expected for the very low metallicity of I Zw 18. We thus consider this a conservative estimate of the total dust content of this BCD. If the dust production process and evolution behaves as in the dwarf irregular sample (e.g., all dwarf irregulars with 12 + log(O/H) 7.4 have dust masses 103 M⊙; LF98), then the above values may be too high. Further constraints on the nature of the dust content of I Zw 18 will be very useful.
4.2 Implications For The Molecular Gas Content
I Zw 18 is undergoing an intense star formation episode, as evidenced by its blue photometric color (UB = -0.88, BV = -0.03; van Zee et al., 1998), its large number of ionizing, massive stars (see Table 3), and by the large ionized gas extent (e.g., Figures 1a and 1b). Consequently, we expect concentrations of molecular gas throughout the galaxy, since we observe large H ii regions and OB associations. I Zw 18 is not detected in CO observations, nor is any galaxy with ambient metallicity below 12 + log(O/H) 8.0 (Taylor, Kobulnicky & Skillman, 1998; Barone et al., 2000). The potential reasons why detections of CO in low-metallicity galaxies have remained elusive are numerous. One explanation is that the conversion factor, , from ICO to N becomes nonlinear below a certain metallicity (Maloney & Black, 1988). At low abundances, the column density of the CO molecule will decrease. In areas undergoing massive star formation, the hard UV radiation field will more easily photodissociate CO to the point where it can no longer be self-shielding; Madden et al. (1997) find observational evidence for such behavior. This will decrease the component of molecular clouds which will have prominent CO emission, while the H2 is less affected. The filling factor decreases, reducing the CO luminosity for a given molecular gas mass, and incompletely sampling the H2 mass as a result.
These large dust concentrations (of order 50-100 pc, see Figure 3b) suggest that the process of H2 formation on grain surfaces may be ongoing in I Zw 18. Recent FUSE non-detections of H2 in absorption in I Zw 18 (Vidal-Madjar et al., 2000) can still be consistent with the presence of large amounts of molecular gas, since these HST results indicate that at least some of the dust is peripheral to the UV-bright clusters, and not necessarily along lines of sight to them. We interpret these results as evidence for a clumpy ISM in I Zw 18; small, dense molecular clouds will allow active star formation, while their volume filling factor and overall CO luminosity will be very small. Vidal-Madjar et al. (2000) also conclude that dense, discrete clouds may have gone undetected in their FUSE observations. Clearly, very high-resolution observations (i.e., interferometric CO mapping; e.g., Walter et al., 2001) of the ISM of I Zw 18 and of other low-metallicity galaxies are needed to attempt to locate the molecular gas.
It is most intriguing that the two lowest-metallicity galaxies known, I Zw 18 and SBS 0335-052 (12+log(O/H) = 7.330.01, Izotov et al., 1997), both contain significant amounts of dust. As discussed above, in I Zw 18, some of the dust concentrations are displaced from ionized regions. Similarly, in SBS 0335-052, dust is found displaced from the locations of the six massive star clusters (Thuan, Izotov, & Lipovetsky, 1997). In both galaxies, the presence of dust displaced from some of the ionizing clusters suggests that the molecular gas content of low-metallicity galaxies is very difficult to quantify via UV absorption or CO tracer lines. In particular, these results suggest that the lack of molecular gas as inferred from such investigations does not necessarily imply a lack of molecular gas, but rather a different mechanism of shielding (e.g., small, dense molecular clouds) when the metallicity is very low.
5 Conclusion
New WFPC2 narrow band images of the blue compact dwarf galaxy I Zw 18 have been analyzed. Images at H and H are used to constrain the dust content and distribution of the galaxy, to analyze the morphology of the ionized gas, and to characterize individual H ii regions. We detect significantly elevated H/H flux ratios throughout the galaxy, both close to and displaced from UV sources, and in general agreement with the morphology derived by Vílchez & Iglesias-Páramo (1998). The effects of collisional excitation and stellar absorption are shown to be minimal, and we interpret these ratios as indicative of the presence of dust. The small total dust mass, estimated to be of order 103 M⊙, is expected for the very low metallicity of the galaxy and is consistent with the IRAS non-detection in the far infrared regime. The presence of dust at low metallicities is now seen in the two lowest metallicity galaxies and is significant, since these may be the most ideal testbeds for studies of galaxy formation and chemical evolution processes at low redshifts.
The presence of dust in I Zw 18 allows us to form a consistent picture of the galaxy’s interstellar medium as derived from various observational studies. I Zw 18 is a low mass galaxy which is embedded in a large H i envelope (van Zee et al., 1998). Within this neutral gas, we see in deep optical and infrared imaging (HT95; DeMello et al. 1998; Aloisi et al. 1999; Östlin 2000) the evolutionary signatures of stars down to the lower mass limit which is currently detectable ( 1.1 M⊙ in NICMOS imaging; Östlin 2000). The large ionized regions and intense H emission evidence the UV flux of massive stars and suggest ongoing star formation. Mixed throughout the galaxy we find large dust concentrations, which could be due to either (or both) mass loss from massive stars or intermediate mass (AGB) stars that have been recently supported by the aforementioned CMD studies. Regardless of its origin, however, the presence of dust suggests that areas rich in molecular gas are abundant even at this very low metallicity. The FUSE non-detection of diffuse H2 in absorption (Vidal-Madjar et al., 2000) may still be consistent with the presence of large amounts of molecular gas in I Zw 18, since in these observations we find bulk dust distributions displaced from UV clusters and not along lines of sight directly to them. We favor the scenario that the molecular clouds in I Zw 18 (and likely in other low-metallicity galaxies) are small and dense. This will cause them to be very difficult to detect, yet still allow them to actively and efficiently form the short-lived massive stars which we see throughout I Zw 18.
References
- Aloisi et al. (1999) Aloisi, A., Tosi, M., & Greggio, L. 1999, AJ, 118, 302
- Barone et al. (2000) Barone, L. T., Heithausen, A., Hüttemeister, S., Fritz, T., & Klein, U. 2000, MNRAS, 317, 649
- Bohlin et al. (1978) Bohlin, R. C., Savage, B. D., & Drake, J. F. 1978, ApJ, 224, 132
- Bouchet et al. (1985) Bouchet, P., Lequeux, J., Maurice, E., Prévot, L., & Prévot-Burnichon, M. L. 1985, A&A, 149, 330
- Burstein & Heiles (1982) Burstein, D. & Heiles, C. 1982, AJ, 87, 1165
- Calzetti et al. (1997) Calzetti, D., Meuer, G. R., Bohlin, R. C., Garnett, D. R., Kinney, A. L., Leitherer, C., & Storchi-Bergmann, T. 1997, AJ, 114, 1834
- Clayton et al. (1996) Clayton, G. C., Green, J., Wolff, M. J., Zellner, N. E. B., Code, A. D., Davidsen, A. F., WUPPE Science Team, & HUT Science Team 1996, ApJ, 460, 313
- Davidson & Kinman (1985) Davidson, K. & Kinman, T. D. 1985, ApJS, 58, 321
- DeMello et al. (1998) DeMello, D. F., Schaerer, D., Heldmann, J., & Leitherer, C. 1998, ApJ, 507, 199
- Diplas & Savage (1994) Diplas, A. & Savage, B. D. 1994, ApJ, 427, 274
- Dufour, Esteban, & Castaneda (1996) Dufour, R. J., Esteban, C., & Castaneda, H. O. 1996, ApJ, 471, L87
- Dufour, Shields, & Talbot (1982) Dufour, R. J., Shields, G. A., & Talbot, R. J. 1982, ApJ, 252, 461
- Dufour et al. (1996) Dufour, R. J., Garnett, D. R., Skillman, E. D., & Shields, G. A. 1996, ASP Conf. Ser. 98: From Stars to Galaxies: the Impact of Stellar Physics on Galaxy Evolution, 358
- Fitzpatrick (1985) Fitzpatrick, E. L. 1985, ApJ, 299, 219
- Garnett et al. (1997) Garnett, D. R., Skillman, E. D., Dufour, R. J., & Shields, G. A. 1997, ApJ, 481, 174
- González Delgado, Leitherer, & Heckman (1999) González Delgado, R. M., Leitherer, C., & Heckman, T. M. 1999, ApJS, 125, 489
- Howarth (1983) Howarth, I. D. 1983, MNRAS, 203, 301
- Hummer & Storey (1987) Hummer, D. G. & Storey, P. J. 1987, MNRAS, 224, 801
- Hunter & Thronson (1995) Hunter, D. A. & Thronson, H. A. 1995, ApJ, 452, 238 (HT95)
- Izotov et al. (1997) Izotov, Y. I., Lipovetsky, V. A., Chaffee, F. H., Foltz, C. B., Guseva, N. G., & Kniazev, A. Y. 1997, ApJ, 476, 698
- Izotov & Thuan (1998) Izotov, Y. I. & Thuan, T. X. 1998, ApJ, 497, 227
- Izotov & Thuan (1999) Izotov, Y. I. & Thuan, T. X. 1999, ApJ, 511, 639
- Kunth & Sargent (1986) Kunth, D. & Sargent, W. L. W. 1986, ApJ, 300, 496
- Legrand et al. (2000) Legrand, F., Kunth, D., Roy, J. -R., Mas-Hesse, J. M., & Walsh, J. R. 2000, A&A, 355, 891
- Lisenfeld & Ferrara (1998) Lisenfeld, U. & Ferrara, A. 1998, ApJ, 496, 145 (LF98)
- Madden et al. (1997) Madden, S. C., Poglitsch, A., Geis, N., Stacey, G. J., & Townes, C. H. 1997, ApJ, 483, 200
- Maloney & Black (1988) Maloney, P., & Black, J. H. 1988, ApJ, 325, 389
- Osterbrock (1989) Osterbrock, D. E. 1989, Astrophysics of Gaseous Nebulae and Active Galactic Nucleii (Sausalito, CA: University Science Books)
- Östlin (2000) Östlin, G. 2000, ApJ, 535, L99
- Prévot et al. (1984) Prévot, M. L., Lequeux, J., Prévot, L., Maurice, E., & Rocca-Volmerange, B. 1984, A&A, 132, 389
- Schild (1977) Schild, R. E. 1977, AJ, 82, 337
- Schlegel et al. (1998) Schlegel, D. J., Finkbeiner, D. P., & Davis, M. 1998, ApJ, 500, 525
- Seaton (1979) Seaton, M. J. 1979, MNRAS, 187, 73P
- Skillman & Kennicutt (1993) Skillman, E. D. & Kennicutt, R. C. 1993, ApJ, 411, 655 (SK93)
- Stanimirovic et al. (2000) Stanimirovic, S., Staveley-Smith, L., van der Hulst, J. M., Bontekoe, T. R., Kester, D. J. M., & Jones, P. A. 2000, MNRAS, 315, 791
- Stasińska & Schaerer (1999) Stasińska, G. & Schaerer, D. 1999, A&A, 351, 72
- Taylor, Kobulnicky & Skillman (1998) Taylor, C. L., Kobulnicky, H. A., & Skillman, E. D. 1998, AJ, 116, 2746
- Thuan, Izotov, & Lipovetsky (1997) Thuan, T. X., Izotov, Y. I., & Lipovetsky, V. A. 1997, ApJ, 477, 661
- van Zee et al. (1998) van Zee, L., Westpfahl, D., Haynes, M. P., & Salzer, J. J. 1998, AJ, 115, 1000
- Vidal-Madjar et al. (2000) Vidal-Madjar, A. et al. 2000, ApJ, 538, L77
- Vílchez & Iglesias-Páramo (1998) Vílchez, J. & Iglesias-Páramo, J. 1998, ApJ, 508, 248
- Walter et al. (2001) Walter, F., Taylor, C. L., Hüttemeister, S., Scoville, N., & McIntyre, V. 2001, AJ, 121, 727
- Zwicky (1966) Zwicky, F. 1966, ApJ, 143, 192
| Filter | Emission | Proposal | Date | Exposure | WFPC2 | Dataset |
|---|---|---|---|---|---|---|
| (sec) | Chip | |||||
| F487N | H | GO-6536 | 2/16/99 | 2500 | WF3 | U39A0101R,U39A0102R,U39A0103R |
| F658N | H | GO-6536 | 4/04/98 | 2500 | PC | U39A0201R,U39A0202R,U39A0203R |
| F658N | H | GO-5434 | 11/02/94 | 4600 | WF3 | U2F90205T,U2F90206T |
| F450W | Wide-B | GO-5434 | 11/03/94 | 4600 | WF3 | U2F90102T,U2F90103T |
| F675W | R | GO-5434 | 3/01/95 | 2000 | PC | U2F90305T,U2F90306T |
| F702W | Wide-R | GO-5434 | 11/03/94 | 5400 | WF3 | U2F90101T,U2F90201T,U2F90202T |
| Filter | Emission | WFPC2 | PHOTFLAMaaUnits of erg sec-1 cm-2 Å-1 | URESPaaUnits of erg sec-1 cm-2 Å-1 | Filter | Efficiency | Continuum | ScaledbbFraction which narrow band image was multiplied by before subtraction from wide band filter. This value was found both iteratively and by finding the ratio of (filter throughput at the wavelength of redshifted emission) to (filter width at full width half maximum); both ratios were calculated using the SYNPHOT package. Detailed discussion of the continuum subtraction process is given in § 2.2. |
|---|---|---|---|---|---|---|---|---|
| Chip | Width (Å) | Correction | Filter | Fraction | ||||
| F487N | H | WF3 | 3.8910-16 | 3.9410-16 | 33.9 | 1.07 | F450W | 2.7% |
| F658N | H | PC | 1.0610-16 | 1.0410-16 | 39.2 | 1.01 | F702W | 1.9% |
| F658N | H | WF3 | 1.0610-16 | 1.0410-16 | 39.2 | 1.01 | F675W | 2.9% |
| Feature | Center RA | Center DEC | Previous | Radius | LHα | O8 Ionizing |
|---|---|---|---|---|---|---|
| (J2000) | (J2000) | IdentificationaaHT = Hunter & Thronson (1995) = HT 95 | (pc) | (1036 erg sec-1) | EquivalentbbAssumes an ionizing photon rate of 1048.6 sec-1 for an O8 star (Osterbrock, 1989). | |
| NW 1 | 9:34:02.361 | 55:14:26.27 | HT 2 | 11.2 | 511 | 238 |
| SE 1 | 9:34:02.610 | 55:14:21.45 | HT 16 | 7.5 | 112.8 | 53 |
| NW 2 | 9:34:02.428 | 55:14:26.11 | HT 3 | 6.0 | 71.1 | 33 |
| SE 2 | 9:34:02.680 | 55:14:21.75 | HT 5 | 5.0 | 42.3 | 21 |
| SE 3 | 9:34:02.660 | 55:14:20.35 | HT 13 | 3.4 | 37.7 | 18 |
| SE 4 | 9:34:02.473 | 55:14:20.73 | HT 10 | 4.5 | 35.0 | 16 |
| SE 5 | 9:34:02.549 | 55:14:22.39 | HT 6 | 2.5 | 29.7 | 14 |
| SE 6 | 9:34:02.680 | 55:14:20.62 | HT 14 | 3.0 | 29.1 | 14 |
| SE 7 | 9:34:02.526 | 55:14:22.13 | HT 7 | 3.00 | 23.0 | 11 |
| SE 8 | 9:34:02.604 | 55:14:20.84 | HT 12 | 3.0 | 21.7 | 10 |
| SE 9 | 9:34:02.565 | 55:14:20.92 | HT 11 | 2.9 | 18.1 | 8 |
| SE 10 | 9:34:02.452 | 55:14:21.34 | HT 9 | 2.4 | 17.1 | 8 |
| SE 11 | 9:34:02.416 | 55:14:21.49 | HT 8 | 2.6 | 16.2 | 8 |
| SE 12 | 9:34:02.525 | 55:14:20.98 | HT 11 | 2.5 | 12.5 | 6 |
| SE 13 | 9:34:02.507 | 55:14:21.78 | 2.85 | 9.2 | 4 | |
| Total Galaxy | 9:34:02.0 | 55:14:24.0 | 6200 | 2886 |
| Feature | H Flux | H Flux | H/H | AVaaCorrected for 0.06 magnitudes of foreground extinction. | H Equivalent | H Equivalent |
|---|---|---|---|---|---|---|
| (erg sec-1 cm-2) | (erg sec-1 cm-2) | Ratio | (Magnitudes) | WidthbbAverage value over the aperture, rounded to nearest Å. (Å) | WidthbbAverage value over the aperture, rounded to nearest Å. (Å) | |
| NW D1 | 3.8810-14 | 1.3410-14 | 2.880.02 | 0.050.01 | 9083 | 881 |
| NW D2 | 7.1310-15 | 2.4910-15 | 2.870.04 | 0.040.02 | 205520 | 1923 |
| NW D3 | 2.0510-14 | 6.4510-15 | 3.170.03 | 0.290.02 | 9034 | 751 |
| NW D4 | 3.0210-14 | 1.0710-14 | 2.830.02 | 0.000.01 | 15277 | 1561 |
| NW D5 | 4.8710-14 | 1.6510-14 | 2.960.02 | 0.120.01 | 13424 | 1401 |
| NW D6 | 4.1710-15 | 1.3710-15 | 3.040.06 | 0.190.03 | 141215 | 1373 |
| SE D1 | 9.5910-15 | 3.2010-15 | 3.000.04 | 0.150.02 | 9206 | 951 |
| SE D2 | 5.4010-15 | 1.9310-15 | 2.800.04 | 0.000.02 | 1067 9 | 1262 |
| SE D3 | 6.8110-15 | 2.4810-15 | 2.750.04 | 0.000.03 | 117512 | 1503 |
| SE D4 | 1.8210-15 | 5.3510-16 | 3.400.11 | 0.470.05 | 125520 | 1013 |
| SE D5 | 9.6610-15 | 3.0710-15 | 3.150.04 | 0.280.02 | 136910 | 1152 |
| SE D6 | 1.1210-14 | 3.7310-15 | 3.000.04 | 0.150.02 | 11107 | 1011 |
| SE D7 | 5.5110-15 | 1.8710-15 | 2.940.05 | 0.100.03 | 11039 | 1032 |
| SE D8 | 4.7210-15 | 1.5610-15 | 3.030.06 | 0.180.03 | 7676 | 842 |