The SAURON project. II. Sample and early results
Abstract
Early results are reported from the SAURON survey of the kinematics and stellar populations of a representative sample of nearby E, S0 and Sa galaxies. The survey is aimed at determining the intrinsic shape of the galaxies, their orbital structure, the mass-to-light ratio as a function of radius, the age and metallicity of the stellar populations, and the frequency of kinematically decoupled cores and nuclear black holes. The construction of the representative sample is described, and its properties are illustrated. A comparison with long-slit spectroscopic data establishes that the SAURON measurements are comparable to, or better than, the highest-quality determinations. Comparisons are presented for NGC 3384 and NGC 4365 where stellar velocities and velocity dispersions are determined to a precision of 6 , and the and parameters of the line-of-sight velocity distribution to a precision of better than 0.02. Extraction of accurate gas emission-line intensities, velocities and line widths from the datacubes is illustrated for NGC 5813. Comparisons with published line-strengths for NGC 3384 and NGC 5813 reveal uncertainties of Å on the measurements of the H, Mg b and Fe5270 indices. Integral-field mapping uniquely connects measurements of the kinematics and stellar populations to the galaxy morphology. The maps presented here illustrate the rich stellar kinematics, gaseous kinematics, and line-strength distributions of early-type galaxies. The results include the discovery of a thin, edge-on, disk in NGC 3623, confirm the axisymmetric shape of the central region of M32, illustrate the LINER nucleus and surrounding counter-rotating star-forming ring in NGC 7742, and suggest a uniform stellar population in the decoupled core galaxy NGC 5813.
keywords:
galaxies: elliptical and lenticular — galaxies: individual (M32, NGC 3384, NGC 3623, NGC 4365, NGC 5813, NGC 7742) — galaxies: kinematics and dynamics — galaxies: spirals — galaxies: stellar content — integral-field spectroscopy1 Introduction
The physical properties of early-type galaxies correlate with luminosity and environment. The morphology-density relation (Dressler 1980) shows that elliptical and lenticular galaxies are much more common in clusters than they are in regions of lower local density. Giant ellipticals are red, have a high metal content, often have boxy isophotes, are supported by anisotropic velocity distributions, and have triaxial figures (e.g., de Zeeuw & Franx 1991) whereas lower-luminosity systems are bluer, less metal-rich, have disky isophotes, are flattened by rotation, and may well have nearly-oblate shapes (Davies et al. 1983; Bender & Nieto 1990; de Zeeuw & Carollo 1996; Faber et al. 1997).
Observations with the Hubble Space Telescope have re-enforced the connection between the global and core properties of early-type galaxies. The nuclei of elliptical and lenticular galaxies, as well as the bulges of early-type spirals, often contain stellar and/or gaseous disks, possibly associated with a massive central black hole, as well as unresolved nuclear spikes, kinematically decoupled structures, and puzzling asymmetries. These nuclear properties loosely correlate with the global structure of the galaxies. For example, while the luminosity profiles of elliptical galaxies approach a power-law at small radii , giant ellipticals () have shallow cusps (mean ) and low-luminosity ellipticals () have steep cusps (mean ) (Jaffe et al. 1994; Faber et al. 1997). At intermediate luminosities, both types of profile occur (Carollo et al. 1997; Rest et al. 2001). Furthermore, it appears that the mass of the central black hole correlates with the velocity dispersion of the host galaxy (Ferrarese & Merritt 2000; Gebhardt et al. 2000b).
At present, it is unclear to what extent the observed properties of these early-type galaxies, and the correlations between them, were acquired at the epoch of galaxy formation or result from subsequent dynamical evolution, possibly driven by a central black hole (Franx, Illingworth & de Zeeuw 1991; de Zeeuw 1996; Faber et al. 1997; Merritt 1999; Bak & Statler 2000). Key questions in this area include: What is the distribution of intrinsic shapes, tumbling speeds, and internal orbital structure of early-type galaxies? How do these depend on total luminosity and environment? What is the shape and extent of the dark halo? What is the dynamical importance of the central black hole? What is the distribution of metals, and what is the relation between the kinematics of stars (and gas), the local metal enrichment, and the star formation history?
Progress towards answering these questions requires a systematic investigation of the kinematics and line-strengths of a representative sample of early-type systems. The intrinsic shape, internal orbital structure, and the radial dependence of the mass-to-light ratio are constrained by the line-of-sight velocity distribution of the stars (e.g., van der Marel & Franx 1993; Gerhard 1993) and by the gas kinematics (e.g., Cretton, Rix & de Zeeuw 2000). The absorption line-strengths can be used to infer the luminosity-weighted age and metallicity of the stellar populations (González 1993; Carollo, Danziger & Buson 1993; Davies, Sadler & Peletier 1993; Worthey 1994). Detailed studies of individual galaxies are valuable, but need to be complemented with a systematic investigation of the internal structure as a function of global properties, such as total luminosity and Hubble type, and environment.
Studies of the kinematics and line-strength distributions of galaxies have traditionally relied on long-slit spectroscopy along at most a few position angles (e.g., Davies & Birkinshaw 1988; Franx, Illingworth & Heckman 1989; Bender, Saglia & Gerhard 1994; Surma & Bender 1995; Statler & Smecker–Hane 1999). This is insufficient to map the rich internal structure of early-type galaxies (Statler 1991, 1994; Arnold, de Zeeuw & Hunter 1994). Constructing full two-dimensional maps for a significant sample of galaxies with long-slit spectroscopy requires a prohibitive amount of telescope time. For this reason, we built SAURON, a panoramic integral-field spectrograph optimized for studies of the large-scale kinematics and stellar populations of galaxies (Bacon et al. 2001, hereafter Paper I). SAURON is based on the same principles as the prototype integral-field spectrograph TIGER, built for the CFHT, and its successor OASIS (Bacon et al. 1995, 2000). In its low-resolution (LR) mode, SAURON has a field-of-view sampled with pixels, 100% coverage, high throughput, and a spectral resolution of 3.6ÅFWHM. In high-resolution (HR) mode, the spectral resolution is 2.8Å and the field of view is , sampled at . SAURON provides 1577 spectra in one exposure (wavelength range 4810–5350Å, see also §5.3), 146 of which are used for simultaneous sky subtraction away from the main field. Stellar kinematical information is derived from the Mgb triplet and the Fe lines. The [OIII] and H emission lines allow derivation of the morphology and kinematics of the ionized gas, and provide information on its ionization state. The Mgb, H, and Fe5270 absorption lines are sensitive to the age and metallicity of the stellar populations. Paper I describes the design and construction of SAURON, and the extensive data reduction software developed. SAURON was commissioned on the William Herschel Telescope (WHT) in February 1999 (de Zeeuw et al. 2000).
We are using SAURON on the WHT to observe a representative sample of nearby ellipticals, lenticulars, and early-type spiral bulges, as well as some objects with known peculiar kinematics (e.g., Davies et al. 2001). We will combine the SAURON observations with high-spatial resolution spectroscopy of the nuclei, and interpret them through dynamical and stellar population modeling. Here we present selected observations which serve to establish the spectrograph’s scientific integrity, and provide early results from our systematic survey. §2 describes the definition of the sample. §3 presents stellar kinematic measurements showing evidence for embedded disks and decoupled cores. §4 is devoted to measurements of the kinematics and line-ratios of extended emission-line gas, and §5 presents absorption line-strength measurements. In each of these three sections, we compare the SAURON results with previous long-slit measurements, and show that SAURON is efficient and accurate. §6 summarises the results and outlines the next steps.

2 The SAURON sample
Observing any complete sample which spans a wide range of global properties is costly in telescope time, even with SAURON. We have therefore constructed a representative sample of nearby early-type galaxies, as free of biases as possible while ensuring the existence of complementary data.
2.1 Selection
We first compiled a complete list of elliptical galaxies, lenticular galaxies, and spiral bulges for which SAURON can measure the stellar kinematics. Given the specifications of the instrument when mounted on the WHT (Paper I), this leads to the following constraints: (to limit the zenith distance and therefore the instrumental flexure), (to ensure that all the lines of interest are in the spectral band), and (so that and velocity dispersions can be measured). We further restricted the objects to to avoid crowded fields and large Galactic extinctions. All parameters except were taken from the Lyon/Meudon Extragalactic Database (LEDA; see Paturel et al. 1997) and checked for consistency with the RC3 (de Vaucouleurs et al. 1991) through VizieR (Ochsenbein, Bauer & Marcout 2000).
We derived absolute magnitudes following the prescription in LEDA, using the listed heliocentric velocities and apparent magnitudes. We adopted a Virgocentric flow model with , , and the correction to the Local Group centroid of Yahil, Tammann & Sandage (1977). For galaxies in the Virgo cluster, the Coma I cloud, and the Leo I group, which we refer to as ‘cluster’ galaxies, we adopted common distances based on the mean heliocentric velocity of each group, taken from Mould et al. (1993). The distances derived, respectively 16.3, 13.7, and 10.7 Mpc (31.04, 30.68 and 30.14 mag), are in good agreement with those derived from other measurements (see, e.g., Ferrarese et al. 2000). For galaxies outside these three associations, which we refer to as ‘field’ galaxies, we used individual distances. We took cluster and group membership primarily from Tully (1988) and Garcia (1993), but also from other sources (e.g., Turner & Gott 1976; Huchra & Geller 1982; Geller & Huchra 1983; Faber et al. 1989).
The list of galaxies obtained with the above criteria contains 327 objects. We divided these into six categories by first separating ‘cluster’ and ‘field’ galaxies, and then splitting each of these groups in E, S0, and Sa galaxies, based on LEDA’s morphological type (E: , S0: , Sa: ). This results in 29 E, 51 S0 and 37 Sa galaxies in the ‘cluster’ environment, and 47 E, 86 S0 and 77 Sa galaxies in the ‘field’. We selected a representative sample of objects from this complete list by populating the six ellipticity versus absolute magnitude planes nearly uniformly, using bins of 1 magnitude in luminosity and 0.2 in ellipticity (where is derived from the axial ratio at the 25 mag arcsec-2 level in , as reported in LEDA; for the spirals it effectively gives the inclination of the disk). This choice of bin size is appropriate given the range of absolute magnitude we want to cover, and the radial ellipticity variations observed in early-type galaxies. The result is 36 ‘cluster’ galaxies (12 E, 12 S0, and 12 Sa), and 36 ‘field’ galaxies (12 E, 12 S0, and 12 Sa), as illustrated in Figure 1. A sample of this size is large enough to be sub-divided by morphology, environment and luminosity, yet small enough that complete mapping with SAURON is possible. The 72 galaxies correspond to 22% of the complete sample and, as can be seen from Figure 1, remain representative of it. Tables 1 and 2 list the 72 galaxies and summarise some of their properties.
Figure 2 compares distances and absolute luminosities for the 38 sample galaxies in common with the -band surface brightness fluctuation (SBF) survey of Tonry et al. (2001). is a distance-independent measure of absolute luminosity. Our distances are in very good agreement with the SBF distances (), and our correlates strongly with . Only seven galaxies have distances differing by more than 0.5 mag (half a bin) from the mean offset. Despite a simplistic approach, our distance estimates are thus accurate enough for the chosen bin size.


The complete list of galaxies is unbiased, but we did consider additional criteria when selecting the representative sample. In cases where more then one galaxy could be used to fill a given bin, we favored the one for which high spatial resolution imaging and kinematics are available, primarily Hubble Space Telescope (HST) WFPC2 and STIS observations from the HST archive. Such observations are essential to constrain the mass distribution in the nuclei of the galaxies. Similarly, we preferentially chose galaxies for which kinematics at large radii is available, for example through long-slit spectroscopy or HI observations. These data can be used to evaluate the importance of dark matter in the outer parts of the galaxies. In the case of S0 and Sa galaxies, we also tried to obtain a representative mix of barred and unbarred systems. These choices introduce a bias in the selection, but this bias is hard to quantify. The ground-based observations were primarily compiled using the Hypercat catalogue (e.g., Prugniel et al. 1997) and derive from a range of programs with different goals, but a large fraction of them were carried out as part of statistically complete surveys. Thus, overall, we believe that the bias introduced is minimal, and that the advantages of working with a carefully crafted sample far outweigh the disadvantages.
2.2 Properties of the sample galaxies
Figure 3 illustrates that the galaxies in our representative sample cover a large range of global and nuclear properties (listed in Tables 1 and 2). Panel a presents the Faber–Jackson (1976) relation between total luminosity (absolute blue magnitude ; see §2.1) and central velocity dispersion (LEDA). The galaxies cover a range of 50 in luminosity and a factor of five in velocity dispersion. Panel b plots the effective colour (LEDA) versus , and panel c plots the central value of Mg2 (Hypercat) versus . These panels demonstrate that large galaxies are systematically redder and have stronger lines. Panel d shows the ellipticity-normalised anisotropy parameter (i.e. divided by the value for the oblate isotropic rotator of the same ellipticity as the galaxy, where is the maximum of the observed stellar mean streaming velocity, see Davies et al. 1983), plotted against the central velocity dispersion for the elliptical galaxies (LEDA). The ellipticities used are those from column 10 of Tables 1 and 2, and are not necessarily applicable to the domain of the galaxy where the stellar rotation velocity was measured. The values for are the averages of the maximum stellar measured along the major axis for sources listed in LEDA (column 12 of Tables 1 and 2). Upper limits are included as measurements. Discrepancies in the catalog entries were resolved by examining the original data. The elliptical galaxies in the sample span a wide range of anisotropy. About two dozen galaxies have well-determined nuclear surface brightness profiles derived from HST imaging (Lauer et al. 1995; Byun et al. 1996; Carollo et al. 1997; Rest et al. 2001). Panel e shows the average logarithmic slope of the deprojected luminosity profile within 10–50 pc, as derived by Carollo et al. (1997, Tables 5 and 8) for 12 of our objects. They display a significant scatter, but lower-dispersion galaxies generally have steeper central cusps. A similar number of objects in our sample also have published values for the mass of a central black hole, based on high-resolution absorption or emission-line spectroscopy and (in most cases) axisymmetric three-integral dynamical modeling (Bower et al. 1998, 2001; Gebhardt et al. 2000a, b; Macchetto et al. 1997; Sarzi et al. 2001). As Panel f shows, they cover three orders of magnitude in black hole mass.
3 Stellar kinematics
Our strategy is to map galaxies out to one effective radius , which for nearly half the sample requires only one SAURON pointing. For large galaxies, mosaics of two or three pointings reach 0.5, except for M84 and M87 where two additional pairs of flanking fields are needed to reach this minimum radius. Each two hour pointing is typically split into four exposures of 1800 s each, dithered by one lenslet. We reduce and merge the raw SAURON exposures as described in Paper I, and use the individual wavelength-calibrated and extracted spectra to derive maps of the stellar kinematics using the FCQ method (Bender 1990) and an optimal stellar template (Paper I, §5.2). This provides the mean stellar velocity , the velocity dispersion , as well as the Gauss-Hermite moments and , which quantify the first-order asymmetric and symmetric deviations of the line-of-sight velocity distribution from a Gaussian form (van der Marel & Franx 1993; Gerhard 1993).
We estimated the errors on the kinematic parameters by means of extensive Monte-Carlo tests: for each galaxy spectrum and its associated set of kinematic parameters, an initial noise-free galaxy spectrum was estimated by convolving the template spectrum with the corresponding analytic line-of-sight velocity distribution. Extraction of a new set of parameters after inclusion of a realization of the noise at the given signal-to-noise constitutes a random realization out of the statistical distribution of these parameters, and the errors on the kinematic parameters are estimated from the variance of 100 realizations of this distribution.
SAURON observations of the kinematics of stars and gas in the E6 galaxy NGC 3377 were presented in Figure 12 of Paper I. Kinematic and line-strength maps of NGC 4365 were published by Davies et al. (2001). In this section we present the SAURON kinematics of NGC 3384 observed with the LR mode, and compare the results with high-quality long-slit kinematics from the literature. We then discuss NGC 3623 and NGC 4365, both of which display significant structure in the observed kinematics which is not captured by long-slit spectroscopy along a few position angles. We conclude by presenting kinematic maps of M32 taken with the HR mode.
3.1 LR mode observations of NGC 3384
NGC 3384 is a large early-type spiral in the Leo I group, classified as SB0-(s) in the RC3 (, in LEDA). It forms a triple on the sky with NGC 3379 and NGC 3389, but there is only marginal evidence for interactions in the form of a faint spiral or tidal arm (Malin 1984) and the existence of a large HI ring around the triple (Schneider 1985). Barbon, Capaccioli & Tarenghi (1975) described the three main components of NGC 3384: a bright central region (), a lens (), and an outer exponential disk (). The light distribution in the central is complex. The inner isophotes are elongated along the major axis, suggesting an embedded disk, but beyond 10′′ the elongation is along the minor-axis, possibly due to a faint polar ring or bar (Davoust et al. 1984; Whitmore et al. 1990; Busarello et al. 1996). At much larger radii the isophotes are off-centred. NGC 3384 shows no emission lines (Ho, Filippenko & Sargent 1997), remains undetected in HI, CO, radio continuum, and X-ray (e.g. Roberts et al. 1991), but has IRAS 12 and 100 m fluxes (Knapp et al. 1989).

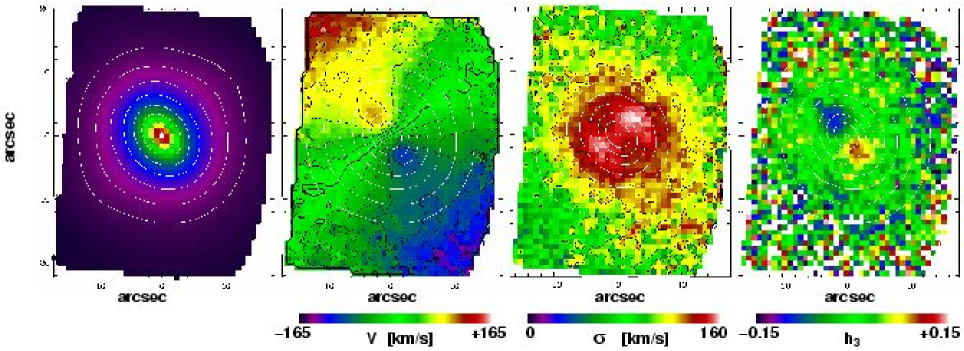
We observed NGC 3384 with SAURON in LR mode on the night of April 4, 2000. We obtained s on one field centred on the galaxy, which covers most of the bulge. The seeing was . Figure 4 displays the resulting integrated intensity, the mean stellar velocity and velocity dispersion , and the Gauss-Hermite moments and .
Figure 4a illustrates a key advantage of integral-field spectroscopy over traditional aperture and long-slit spectra: by integrating the flux in each spectrum, the two-dimensional surface brightness distribution of the galaxy is recovered. As this is derived from the same data that are used to obtain the kinematics and line-strengths, there is no doubt about the relative location of these measurements. A comparison with an HST/F555W image taken from the HST archive shows excellent agreement, after taking into account the seeing and the spatial sampling of SAURON.
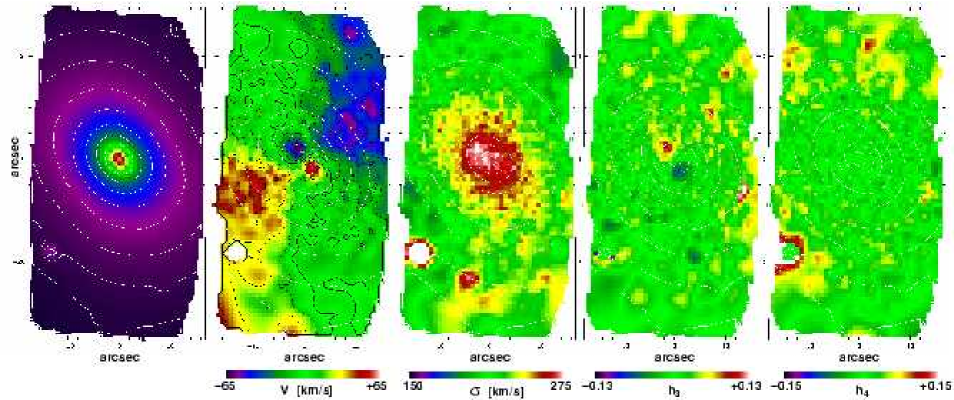
Figure 4b shows that the bulge of NGC 3384 exhibits a regular rotation field. The mean velocities increase steeply along the major axis, reaching 110 at , then decrease slightly, after which they rise again. No velocity gradient is observed along the minor axis, indicating that the kinematics in the inner region of NGC 3384 is consistent with axisymmetry. The velocity dispersion map (Fig. 4c) shows a symmetric dumb-bell structure with a central depression. Fisher (1997) had already observed the central dip in the minor axis velocity dispersion profile, together with an abrupt change in the gradient at along the major axis (cf. Fig 4d). These results strongly suggest the presence of a rapidly rotating inclined inner stellar disk.
Busarello et al. (1996) reported long-slit measurements of and along three position angles. Fisher’s (1997) higher signal-to-noise measurements of , , and along the major and the minor axis (position angles 53∘ and 143∘) have a spectral resolution very similar to that of SAURON. Figure 5 compares his results with ours. The column of four panels on the left shows the direct comparison with the SAURON measurements in all the individual lenslets whose centres fall inside the slit used by Fisher. The middle and right columns of panels show the comparison with the SAURON data now logarithmically binned in radius to increase the signal-to-noise. The agreement is good and shows that a two hour exposure provides reliable kinematics over the entire SAURON field. Re-sampling our data to the spatial sampling by Fisher results in RMS deviations of 7 km/s in , 8 km/s in , 0.02 in and 0.02 in . We do not find systematic offsets for and . For we find mean offsets of 14 km/s and 7 km/s (SAURON – Fisher) for the major and minor axis, respectively. Our slightly larger ’s are, however, consistent with the central measurements of Tonry & Davis (1981, asterisk), Dalle Ore et al. (1991, open triangle) and Neistein et al. (1999, open square), as shown in Figure 5. The values agree well, except beyond 15′′ where the binned SAURON measurements indicate a return to values with the opposite sign to that of , as seen in many elliptical galaxies (e.g., Bender, Saglia & Gerhard 1994). Taking into account the RMS variation in Fisher’s data, we conclude that the RMS errors in the SAURON measurements are , , and .
Gebhardt et al. (2000b) reported the presence of a central black hole of in the nucleus of NGC 3384, based on STIS absorption-line spectroscopy. The spatial resolution of the SAURON maps (and of Fisher’s long-slit data) is insufficient to resolve the increase in dispersion inside the radius of influence of such a black hole. A dynamical model for NGC 3384 which combines the STIS results with OASIS and SAURON data will provide an accurate determination of the intrinsic shape and internal velocity distribution of the bulge and disk of NGC 3384, and should also increase the accuracy of the black hole mass determination.
3.2 The decoupled core of NGC 4365
NGC 4365 is an E3 galaxy located in the Virgo W cloud just beyond the centre of the Virgo cluster. Surma & Bender (1995) showed that the main body of NGC 4365 rotates around its projected major axis and that its core rotates around the minor axis (cf. Bender 1988; Wagner, Bender & Möllenhoff 1988). The central luminosity profile has a shallow cusp, and the nucleus contains a blue central point source (Carollo et al. 1997).
We observed NGC 4365 with SAURON on the nights of 29 & 30 March 2000. Two pointings of two hours each, overlapping by 20′′ on the nucleus, covered a total region of 33′′63′′. The average seeing during the observations was (see Davies et al. 2001 for further details). Figure 6 presents maps of the reconstructed total intensity, the mean stellar velocity and velocity dispersion , and the Gauss–Hermite moments and .

The mean velocity field displayed in Figure 6 clearly shows the rich kinematical structure of NGC 4365. As described in Davies et al. (2001), the core measures and rotates around the minor axis, while the bulk of the galaxy rotates approximately around the major axis. The map of the -moment displays a similar two-component structure, with the values anticorrelated with . The Gauss-Hermite moment is nearly zero, and shows very little variation over the field. The early long-slit spectroscopy had revealed the global kinematic structure of NGC 4365, but the SAURON maps make it possible to determine, for example, the position angle of the rotation axis accurately. It is aligned with the minor axis in the core, but misaligned from the major axis by in the outer regions. This is a strong indication of a triaxial intrinsic shape (cf. Statler 1991), possibly containing a nearly axisymmetric core. Construction of a triaxial dynamical model for this object is in preparation.
The individual SAURON measurements along the major axis can be compared with the long-slit data from Surma & Bender (1995), obtained with a 14 slit and binned radially to obtain sufficient signal-to-noise. The original data could not be retrieved, so we scanned the published figure. The agreement is excellent. The mean velocity curves agree very well outside . Inside this radius there are differences in the peak amplitude and the slope of the central gradient, but they are consistent with the different values of the seeing. Resampling our data to the spatial sampling used by Surma & Bender (1995) results in RMS deviations of 13 in , 6 in , and 0.02 in and . We ascribe the rather large RMS deviation for to the different seeing. We do not find significant systematic offsets for , and . For we find a systematic offset of 0.03 in the sense that our measurements are smaller. This may be due to differences between the template stars used in the two studies.
3.3 A central stellar disk in NGC 3623
NGC 3623 (M 65) is a bright, large, highly-inclined SAB(rs)a galaxy located in the nearby Leo I group (, , ). It forms the Leo triplet together with NGC 3627 and NGC 3628, and it is classified as a LINER (e.g. Ho, Filippenko & Sargent 1997). While there are strong indications that NGC 3627 and NGC 3628 are interacting, NGC 3623 appears undisturbed (e.g., Chromey et al. 1998 and references therein). It is one of the galaxies discussed by Hubble (1943) in his paper on the sense of rotation of spiral arms and is included in the Hubble Atlas (Sandage 1961).
Surprisingly, despite its closeness, the kinematics of NGC 3623 has received little attention. The only available absorption and emission-line kinematics dates back to Burbidge, Burbidge & Prendergast (1961). All HI kinematic data are at low spatial resolution (e.g., Krumm & Salpeter 1979) or deal with the HI distribution of the entire group (e.g., Rots 1978). Most spectroscopic observations of NGC 3623 are concerned with emission-line ratios, to probe the ionization mechanism of the gas and the nuclear activity (from Burbidge & Burbidge 1962 to Bresolin, Kennicutt & Garnett 1999). The observations reported here offer the first view of the stellar kinematics of the bulge of NGC 3623.
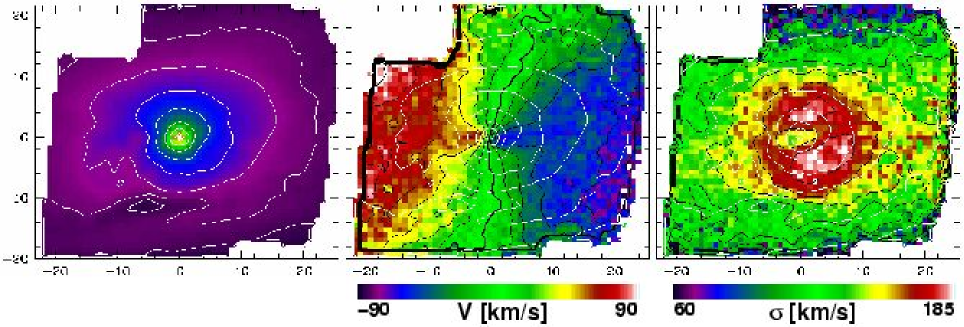
We observed NGC 3623 on 30 & 31 March, 2000, and obtained a mosaic of two fields with substantial overlap on the nucleus. Each field was exposed for s and the resulting mosaic covers most of the bulge. The seeing was 1′′. The SAURON total intensity, velocity, and velocity dispersion maps are shown in Figure 8 (cf. Bureau et al. 2001). The main dust lane is easily visible in the SAURON reconstructed image. It appears as the dark band covering the bottom 25% of the field (the position angle of the major axis of the galaxy is roughly horizontal in Fig. 8). The velocity field shows a typical rotation pattern, but also reveals twists in the kinematic minor axis and a gradient along the minor axis (‘minor-axis rotation’). This is not unexpected since NGC 3623 is barred. There may be a contribution from a warped stellar disk. However, it is difficult to estimate how much of this structure is affected by the dust extinction. One feature which is certainly not due to dust is the central stellar disk, clearly visible as a flattening of the isovelocity contours in the centre of the galaxy. This disk is also easily seen in the velocity dispersion map. While the dispersion increases steadily towards the centre, roughly following the isophotes, there is a pronounced elongated depression in the centre. This is the expected signature of a flattened, cold component embedded in the bulge. The small thickness observed suggests that the central disk is thin and located in the equatorial plane of the galaxy (nearly edge-on). Both the central stellar disk and the large scale disk are likely coplanar. The map (not shown) shows a sign reversal at about 6–8′′ on the major axis, confirming the size of the central disk apparent from Fig 8b–c.
Many of the galaxies observed so far with SAURON show similar evidence for a central stellar disk. However, most appear thicker than in the case of NGC 3623. This is most likely due to projection effects, the disks being more nearly face-on, but could also be due to the presence of intrinsically thick disks. The maps of NGC 3623 provide a further illustration of the advantages of integral-field spectroscopy. By contrast to spectroscopy along a few slits, the SAURON maps allow us to delineate the entire (projected) kinematics of any embedded subsystem.
3.4 HR mode observations of M32
M32 is a high-surface brightness, compact E3 companion of the Andromeda galaxy. In the past two decades, M32 has been scrutinized extensively for the presence of a central black hole, with ever-higher spatial resolution and increasingly sophisticated dynamical modeling (Dressler 1984; Tonry 1984, 1987; Dressler & Richstone 1988; van der Marel et al. 1994; Qian et al. 1995; Bender, Kormendy & Dehnen 1996; van der Marel et al. 1997a, b, 1998; Joseph et al. 2001).
We observed M32 on October 15, 1999, with the principal aim of testing the HR mode of SAURON. The seeing was . Figure 9 shows the integrated intensity, stellar mean velocity, velocity dispersion and Gauss-Hermite moment of the central , derived from a single 2700 s exposure. The velocity field is very regular, has a peak amplitude of about 50 , and is consistent with axisymmetry. The -field is similarly very regular, and has the opposite sign of everywhere. The velocity dispersion in M32 is smaller than the HR-mode instrumental dispersion of 105 (Paper I), except in the inner arcsecond (e.g., van der Marel et al. 1994, 1997a; Joseph et al. 2001). For this reason it is difficult to measure . It varies little over the field, and we do not show it here.

The plus sign in the M32 maps indicates the position of strong [OIII] emission, with a velocity close to the systemic velocity of M32. It is not spatially resolved and most likely originates in a planetary nebula in M32.
Figure 10 compares the SAURON measurements with the long-slit observations of van der Marel et al. (1994), using ISIS at the same Cassegrain port, with similar seeing, but with an instrumental dispersion of 8 km/s. The SAURON HR measurements were axisymmetrized and binned in the same way as the ISIS data. The agreement is excellent: the differences SAURON – ISIS are in , in , and in . The observed is well below the SAURON instrumental dispersion, but can still be determined reliably over the entire HR field of view, albeit with a small systematic offset.
Van der Marel et al. (1998) constructed fully anisotropic axisymmetric models for M32 by means of Schwarzschild’s (1979) orbit superposition technique. The models fit the surface brightness distribution, high signal-to noise groundbased long-slit kinematics along multiple position angles, and FOS measurements. They require a central black hole of mass but do not constrain the inclination of M32 strongly: models with and fit the measurements equally well.
Our HR mode data shows that the stellar velocity field of M32 is accurately symmetric with respect to the minor axis of the surface brightness distribution, as expected in axisymmetric geometry for any inclination angle. The position angle of the zero velocity curve is within 2∘ of the minor axis of M32. This suggests that there is no compelling reason to consider triaxial models for M32, and that the black hole mass determination is robust.
4 Gas kinematics
The wavelength range 4810–5350Å of the SAURON spectra allows observation of the H, [NI] and [OIII] emission lines in nearby objects. Paper I showed an example of the non-axisymmetric distribution of [OIII] in NGC 3377. Here, we consider NGC 5813 and compare the properties of the emission-line gas as derived from our SAURON observations with long-slit data from the literature. We also discuss NGC 7742, in which we have detected a gaseous ring which counter-rotates with respect to the central stellar component. We first describe the algorithm we use to measure the emission lines. This expands on the brief outline presented in §5.3 of Paper I.
4.1 Measurement of the emission lines
The emission lines need to be disentangled from the stellar absorption line spectrum of a galaxy. We use an algorithm similar to the one employed by Emsellem & Goudfrooij (2001, in prep., see also Goudfrooij & Emsellem 1996), which consists of the following iterative steps:
-
1.
We first derive the stellar kinematics ( and ) using the FCQ algorithm and a single stellar template spectrum (typically that of a K0 giant), and truncate the spectral domain when the brightest emission lines (e.g., [OIII], H) influence the results. The resulting maps are then median filtered to remove residual spurious values due to, e.g., a low signal-to-noise ratio or, more likely, the presence of a strong emission line.
-
2.
We then build a spectral library, including both stellar and galactic spectra (devoid of detectable emission lines) in the same spectral domain but at higher spectral resolution than that of the SAURON datacube. A linear combination of these spectra is fitted to each spectrum in the SAURON datacube while masking out regions where emission lines may contribute, and taking into account the measured differences in and .
-
3.
We then subtract the fitted spectra to obtain—in principle—a pure emission-line datacube. All lines are simultaneously fitted using Gaussians of the same velocity and width, by means of dedicated software.
-
4.
Finally, we subtract the fitted emission-line datacube from the original SAURON datacube to obtain pure stellar absorption-line spectra.
This procedure generally works well with only two iterations. It is very effective in recovering faint emission and superior to narrow-band imaging. Problems may occur when, for example, the emission lines have non-Gaussian profiles, or when they do not probe the same physical regions. These problems can be solved during step (iii) by generalizing the fitting functions and/or relaxing the fitting constraints. A more serious problem may come from the lack of proper stellar types in the spectral library (e.g. super metal-rich stars). This can result in over- or underestimated emission-line fluxes, particularly in the case of the faint [NI]5200 doublet usually lying close to the strong Mgb absorption lines. As a result, the library has to be tuned to each galaxy and sometimes even to different regions within a galaxy.
4.2 The emission-line gas in NGC 5813
NGC 5813 is a large and bright elliptical galaxy classified as E1-2 in the RC3 (, in LEDA). It is located in the Virgo-Libra Cloud (Tully 1988), near NGC 5814 and NGC 5806. The surface brightness profile of NGC 5813 has a core with nuclear cusp slope (Carollo et al. 1997). The ellipticity increases with radius, and the galaxy displays isophotal twists (Lauer et al. 1995; Carollo et al. 1997). NGC 5813 contains a rapidly rotating central component within the inner , has negligible rotation at larger radii, and shows weak evidence for minor-axis rotation (Efstathiou, Ellis & Carter 1980, 1982). The galaxy is undetected in HI or CO, but has an unresolved, weak central radio continuum source (6 cm; Birkinshaw & Davies 1985; Wrobel & Heeschen 1991). It was also detected by IRAS in the 12 and 100m bands (Thronson, Bally & Hacking 1989), although many authors report non-detections (e.g. Knapp et al. 1989). Emission-line ratios are typical of LINERS but no X-ray emission is detected (Ho, Filippenko, & Sargent 1997).
HST imaging of NGC 5813 has revealed a dust lane parallel to the major axis, east of the nucleus, and dust filaments inside , i.e., inside the decoupled core (e.g., Carollo et al. 1997). The distribution of emission-line gas, as traced by H+[NII] narrow-band imaging, is very elongated and bent: it extends along the minor axis at PA on one side, but follows PA on the other side (Caon, Macchetto & Pastoriza 2000). This is similar to the shape of the region where the color is affected by dust (Peletier 1989).
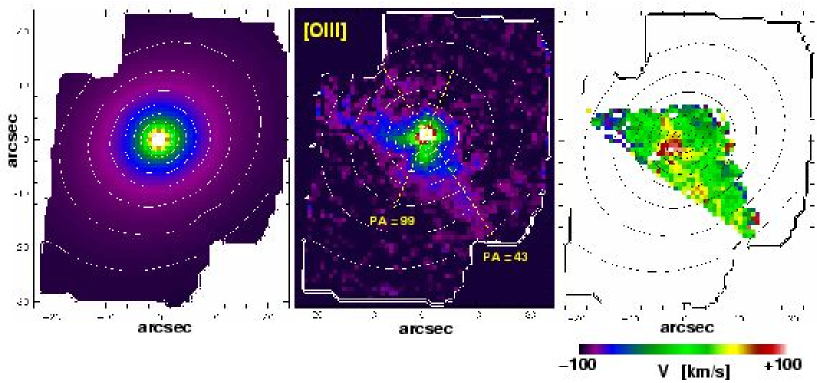
We observed NGC 5813 on 29 & 30 March and 4 April, 2000, obtaining a mosaic of two fields exposed for s each, with overlap on the nucleus. The seeing was on the first two nights and on the last. Figure 11a shows the reconstructed stellar continuum intensity derived from our SAURON mosaic. Figure 11b shows the integrated intensity map of [OIII]. Its morphology resembles that of the H+[NII] map of Caon et al. (2000) and exhibits a complex filamentary structure, most likely not (yet) in equilibrium with the potential of the central region. This is confirmed by the SAURON velocity map (Fig. 11c), which does not display a simple pattern.
The SAURON gas kinematics can be compared with the kinematics of H+N[II] obtained by Caon et al. (2000) along two position angles. In order to be consistent with the SAURON kinematics (for both the stars and the gas), we had to offset the Caon et al. data by . The RMS deviations increase from in the center to at the outermost measured points.

4.3 The extended emission-line gas in NGC 7742
NGC 7742 is a face-on spiral classified as S(r)b in the RC3 (, in LEDA). It probably forms a binary system with NGC 7743 in the Pegasus Cloud (Tully 1988; Honma 1999) and is a good example of the latest spirals included in our sample. De Vaucouleurs & Buta (1980) first identified the inner stellar ring and Pogge & Eskridge (1993) detected a corresponding small, bright ring of H II regions with faint floculent spiral arms (see also Wozniak et al. 1995). NGC 7742 also possesses a significant amount of neutral hydrogen, molecular gas, and dust (e.g., Roberts et al. 1991). It shows essentially no sign of departure from axisymmetry (Rix & Zaritsky 1995; Kornreich, Haynes, & Lovelace 1998). It is classified as a transition LINER/H II nucleus object (Ho, Filippenko, & Sargent 1997).
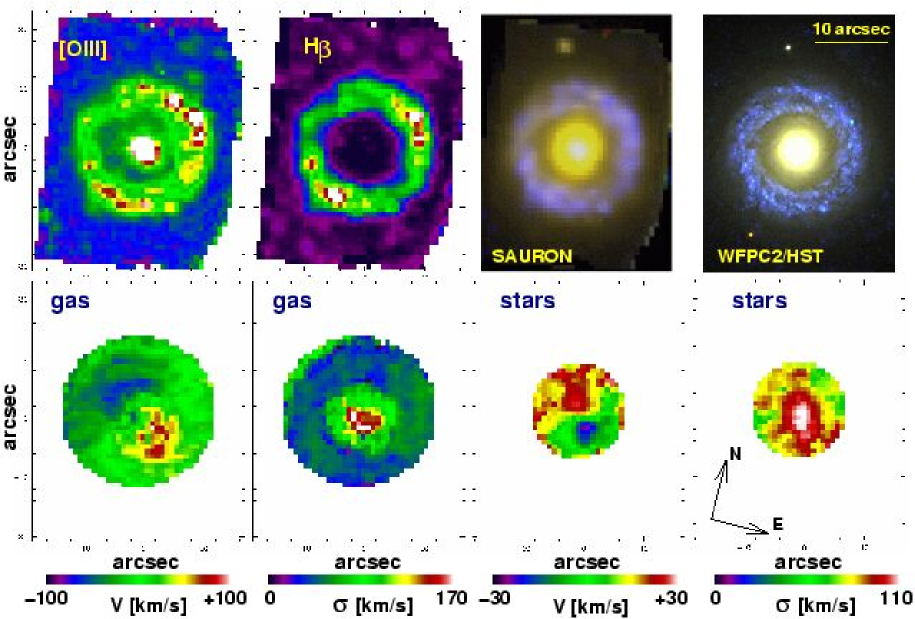
We observed NGC 7742 with SAURON on the night of October 13, 1999. We obtained s on one field centred on the galaxy. The seeing was 1.5–2.5′′. The spectra reveal emission from H, [OIII], and [NI]. The detection of the [NI] doublet is rather difficult because we expect the line to be about ten times less luminous than H, and it lies close to the red edge of the Mg triplet. Figure 13 shows the intensity in [OIII] and H, together with the derived velocity and velocity dispersion fields. Most of the emission is confined to a ring which coincides with the flocculent spiral arms. The H line is clearly dominant in the ring, with [OIII]/H ranging from 0.06 to 0.14. We also detect all three sets of lines at the centre, but this time with [OIII]/H .
Also shown is a colour-coded reconstructed image composed of [OIII] (blue), blue continuum (green), red continuum (red) derived from the SAURON data cube, and a similar colour-coded image composed of HST/WFPC2 exposures with the F336W (blue), F555W (green) and F814W (red) filters (GO 6276, PI J. Westphal). The SAURON map does not have the spatial resolution of HST, but it does demonstrate that our analysis technique is capable of providing accurate emission-line maps.
The main surprise comes from the comparison of the stellar and gas kinematics: the gas in the ring counter-rotates with respect to the stellar component inside the radius of the ring. The amplitude of the stellar velocities is modest, because the galaxy is seen close to face-on, but the zero velocity curve is well-defined, and oriented at PA. This is consistent with the zero velocity curve of the gas, which is at PA. The stellar velocities outside and in the ring itself are consistent with being equal to the systemic velocity, although any velocity difference of the order of 30 is difficult to detect in these regions due to the lower signal-to-noise of the spectra and/or the emission line contamination. The signs of stellar and gas velocities inside the ring are however clearly opposite. The ring-like structure in the gas appears as a tightly wound multi-arm spiral structure, reminiscent of nuclear ( kpc) resonant rings (Buta & Combes 1996). High resolution infrared images would be invaluable to attempt the detection of a non-axisymmetric (weak bar) component in the older stellar population. The spirals can be followed in the HST images into the central arcsecond via the dust absorption features. If we assume they correspond to a trailing wave, then the near side is in the North-East quadrant.
5 Line-strength maps
The SAURON wavelength coverage allows measurement of the line-strength indices H, Mg b, and Fe5270 in the Lick/IDS system (Worthey et al. 1994; see also Paper I). These indices, in combination with simple stellar population models, can be used to estimate luminosity-weighted metallicities and ages. Two-dimensional line-strength maps make it possible to study the shape of the contours of constant line-strength, and consequently of constant metallicity and age (see, e.g., Peletier et al. 1999; del Burgo et al. 2001). Davies et al. (2001) presented and discussed such maps for NGC 4365. Here, we consider the observed line-strength distributions in NGC 3384 and NGC 5813, based on the observations described in §§3.1 and 4.2, and compare them with previous long-slit measurements.
5.1 Measurement of absorption line-strengths
Line-strengths, as measured in the Lick/IDS system, are a measure of the flux in a central bandpass compared to a continuum defined by two sidebands. Two steps are required to convert measured equivalent widths to line-strength indices on the Lick/IDS system: (i) a correction for the difference in spectral resolution, and (ii) a correction for the stellar velocity dispersion of the galaxies. We correct for the difference in resolution by smoothing the data to the resolution of the Lick/IDS system, 8.4 Å in the SAURON wavelength range (Worthey & Ottaviani 1997). Absorption-line indices for stars measured in this way should be on the Lick/IDS system, apart from small offsets ( Å) that arise because the Lick/IDS system is not based on flux-calibrated spectra (e.g., Vazdekis et al. 1997). In future papers we will use our full sample of galaxy observations to establish the significance of any offsets in the line-strength indices compared to the Lick/IDS system.
In order to correct the line strengths for the broadening caused by the stellar velocity distribution we convolved a template star spectrum with the observed LOSVD of the galaxy at each position (see §3), and derived the correction necessary to evaluate the indices at zero velocity dispersion. This correction does not depend critically on the stellar type or temperature for G and K stars (e.g., Davies et al. 1993).
5.2 The effect of sky subtraction errors
Accurate sky subtraction is achieved using the 146 lenslets located away from the main field that record sky spectra simultaneously with the object spectra (Paper I). Some of the galaxies are so large that even at this separation the galaxy contribution is non-negligible. The error caused by this ‘galaxy-contaminated’ sky is however smaller than the typical Poisson errors. For example, for NGC 3384 the galaxy contribution in the sky field is roughly a factor of 40 smaller than in the corner of the SAURON field (25′′). When one subtracts the spectrum in the sky field from a spectrum at 25′′, one also subtracts the galaxy contribution. In the worst case this would introduce a relative line-strength error of 2.5%. Since, however, line-strength gradients are fairly gentle, this is a generous overestimate of the error. For the larger galaxy NGC 5813, the difference in galaxy surface brightness between the edge of the SAURON field and the sky is only a factor of 10, which means that the maximum relative error in the indices at the edge of the frame is at most 10%. In practice it will be smaller than 5%.
5.3 NGC 3384
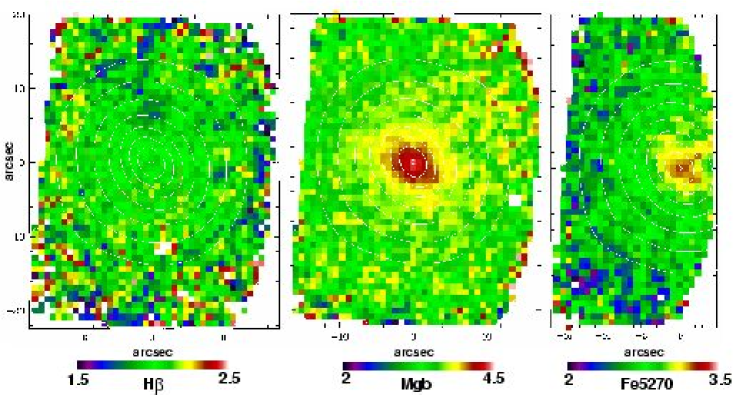
Figure 14 shows the maps of H, Mg b and Fe5270 for NGC 3384, obtained with the procedure described in the above. Due to the effect of a slightly tilted interference filter, the observed wavelength range varies over the field of view (Paper I, § 4.9). This variation affects only the extent of the spectra, and impacts our measurements of the Fe5270 index for galaxies with significant recession velocities. For most galaxies in our sample, the wavelength range of the red sideband is included in the SAURON data for about 2/3 of the field of view. We illustrate this effect in Figure 14c. We have taken a conservative approach showing only measurements which are completely unaffected by the decrease in wavelength-coverage. In future work we intend to improve the data-reduction procedure, and increase the effective field of view for this index.

Fisher, Franx & Illingworth (1996) published accurate line-strength indices for NGC 3384, tabulating amongst other indices H, Mg b and Fe5270 on the Lick/IDS system. Their spectra had 3.1 Å (FWHM) spectral resolution ( ), and were taken with a 2′′ slit along the major and minor axes (PA and ). Measurements of the Fe5270 index are only available for the major axis. Figure 15 shows the comparison with simulated long-slit measurements derived from the SAURON data-cubes. The SAURON data are binned logarithmically in radius to produce a similar number of data points. Fisher et al. (1996) folded their measurements about the centre and we have followed the same procedure to make this comparison.
The agreement for both Mg b and H is excellent. Re-sampling our data to the spatial sampling of the Fisher et al. (1996) data results in RMS deviations of 0.1 Å in Mg b and 0.1 Å in H. The systematic offsets are less than 0.03 Å. The comparison for the Fe5270 index shows a systematic offset of 0.24 Å in the sense that our data show weaker Fe5270, which is however more in line with the expected value for a galaxy of this luminosity (Davies et al. 1993). The RMS deviations are 0.1 Å. The offset is modest and the overall gradient is consistent with the data of Fisher et al. (1996). There is good agreement with the central measurements by Trager et al. (1998, large open circle) and Kuntschner et al. (2001, large open square). The agreement between the Fe5270 index in NGC 5813 (see below) and published data re-inforce our confidence in these measurements.

The SAURON maps show that Mg b is enhanced in the region defined by the inner major-axis disk (′′). Outside this region there is a weaker gradient. This supports the interpretation that later infalling components (i.e., the material that formed the disk) are made out of enriched material (as in NGC 4365, Davies et al. 2001). The same is seen in Fisher et al.’s data. In the region between 4′′ and 10′′, the contours of equal Mg b line-strengths have the same shape as the isophotes of the stellar surface brightness distribution. H is roughly constant everywhere (as in NGC 4365). However, NGC 3384 shows an unusually strong H index, 2.0 Å, which indicates a luminosity-weighted age of 5 Gyr younger than that of the oldest elliptical galaxies. Unlike the disk, the other prominent central component, the inner bar (e.g., Busarello et al. 1996) is not seen in the line-strength maps. Martin & Roy (1994) proposed that bars smear out population gradients, based on a correlation between bar strength and radial O/H abundance gradient in the young stellar population derived from individual HII regions. To date, it has not been possible to verify this correlation using gradients in the absorption line-strengths, which sample the entire stellar population. Statistical analysis for the entire SAURON sample will have to show whether radial abundance gradients are affected by the presence of bars.
5.4 NGC 5813
Early measurements of the line-strength profile in NGC 5813 are reported in Efstathiou & Gorgas (1985), and modeled in Aragón, Gorgas & Rego (1987). Superior measurements were published by Gorgas, Efstathiou & Aragon–Salamanca (1990), based on a 34200 sec major axis exposure on the AAT with the IPCS and a 3′′ slit (cf. Efstathiou et al. 1980; 1982). They present, among other indices, the H, Mg b and Fe5270 index. González (1993) also reports these indices, for the major and minor axis (21 slit).
Figure 16 shows the comparison of the SAURON measurements with those by Gorgas et al. (1990) and González (1993). The overall agreement is good. The comparison for H is excellent, even in the central regions where nebular emission severely affects the H index. This can be seen at where all datasets show a dip in H absorption strength. Re-sampling our data to the spatial sampling of the published data results in RMS deviations of 0.25 Å and systematic offsets Å for the González data. The comparison with Gorgas et al. shows RMS deviations of up to 0.45 Å and systematic offsets of up to 0.6 Å. However, this is consistent with the error bars given by Gorgas et al. Overall the comparison for NGC 5813 shows larger RMS deviations than the comparison for NGC 3384. We ascribe this to the effects of nebular emission and slightly larger errors in the literature data.
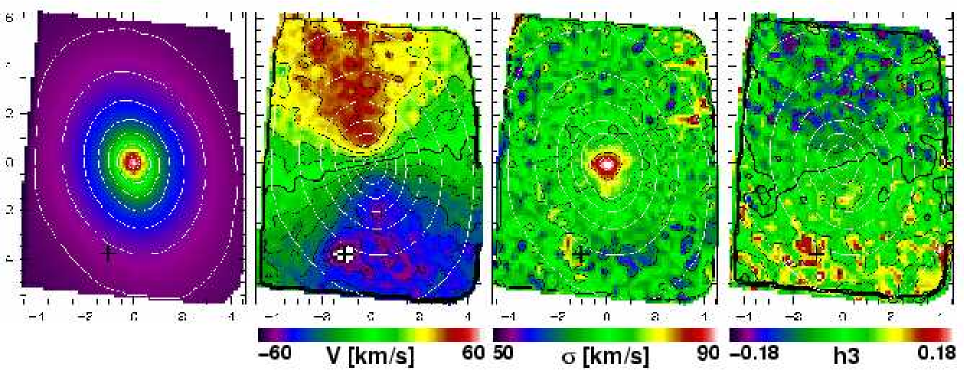
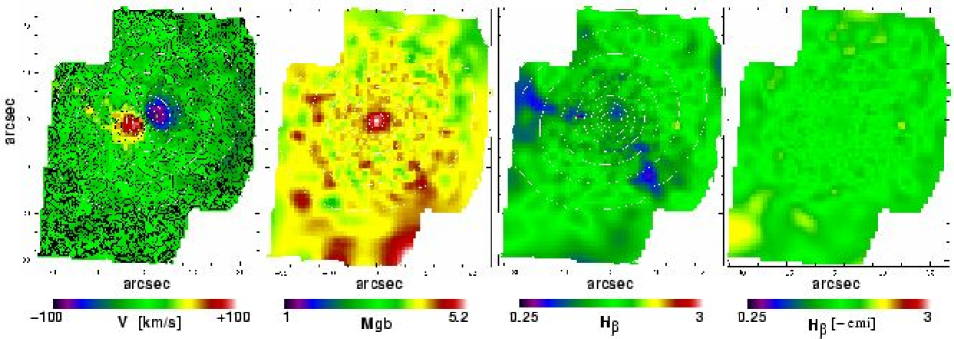
Figure 17 displays the SAURON maps of mean stellar velocity, Mg b, H observed and H corrected for emission for NGC 5813, in all cases with contours of the stellar continuum intensity superimposed. The rapidly rotating core is clearly visible, and extends 12′′ along the major axis and 7′′ along the minor axis. The zero-velocity curve is nearly straight, and is misaligned by from the minor axis of the surface brightness distribution. The Mg b distribution has a peak in the region of the rotating central disk, and a very shallow gradient outside it, similar to NGC 3384 and NGC 4365. H here is severely affected by emission lines (see §4), so need to be corrected for the emission before studying the stellar populations. The two-dimensional structure of the emission can clearly be seen in the right-hand panel of Figure 17. We have subtracted the emission contamination from the spectra by means of an optimal template fitting routine. The ‘emission-free’ H map is shown in the right-most panel of Figure 17. This shows that the stellar absorption of H is roughly constant over the whole field, similar to what we found for NGC 4365 (Davies et al. 2001).
6 Conclusions
We built SAURON to measure the intrinsic shapes and internal velocity and metallicity distributions of early-type galaxies. This is a key component of a comprehensive study of the internal structure of these systems, aimed at gaining insight into the connection between the kinematics and stellar populations, and the relation between nuclear and global properties. Accordingly, we are carrying out a representative survey of nearby early-type galaxies covering a large range of luminosity, ellipticity, and so covering a range of environment, nuclear cusp slope, and rotational support.
The full survey will not be completed until 2002, but the first results presented here demonstrate that the SAURON measurements agree with previous high-quality long-slit kinematic and line-strength measurements. This establishes the scientific integrity of the instrument. It also shows that integral-field spectroscopy is a mature technique, superior to long-slit studies because of the fundamental advantage of complete spatial coverage.
A preliminary analysis of the survey maps shows that early-type galaxies display a variety of line-strength distributions and kinematic structure which appears richer than often assumed. We have shown specific examples of minor axis rotation, decoupled cores, central stellar disks, and non-axisymmetric and counter-rotating gaseous disks. The provisional indication is that only a small fraction of these galaxies can have axisymmetric intrinsic shapes. The line-strength distributions appear to follow the surface brightness distribution closely.
We have started to complement the SAURON maps with high-spatial-resolution spectroscopy of the nuclear regions, using OASIS. STIS spectroscopy for many of the sample galaxies is available in the HST archive. Radial velocities of planetary nebulae and/or globular clusters in the outer regions have been obtained for some of the galaxies in our sample, and many more will become available to about 5 with a special-purpose instrument now under construction (Freeman et al. 2001, in prep).
We are analyzing the SAURON maps by Fourier techniques. This will provide the ellipticity, position-angle, and deviations from the elliptic shape of the contours of constant velocity dispersion, , and line-strengths, as a function of radius (Copin et al. 2001, in prep.). This approach has been customary for the analysis of the surface brightness distribution of early-type galaxies (e.g, Kormendy & Djorgovski 1989). The maps of mean velocity and can be quantified in a similar way, just as is possible for HI and CO data (Franx, van Gorkom & de Zeeuw 1994; Schoenmakers, Franx & de Zeeuw 1997; Wong 2000; see also Copin 2000, Copin et al. 2001, in prep.). Doing this for the entire sample will provide a statistically reliable determination of the incidence of kinematically decoupled cores, embedded disks, and minor axis rotation, and will also provide parametrized input for statistical studies of, e.g., the distribution of intrinsic shapes (Franx, Illingworth & de Zeeuw 1991; Bak & Statler 2000) and the construction of dynamical models.
The detailed measurements for individual objects will be compared with fully general galaxy models constructed by means of Schwarzschild’s (1979) numerical orbit superposition method (cf. Rix et al. 1997; van der Marel et al. 1998; Cretton et al. 1999). The modeling uses all appropriate imaging and spectral data available, including HST and OASIS spectra, to constrain the mass of a central black hole and the orbital structure in the main body of the galaxy. When combined with the constraints on the stellar populations derived from the line-strength distributions (Kuntschner & Davies 1998), this will shed new light on the fundamental connections between the large and small scale dynamics, the formation (and existence) of supermassive BHs and galactic nuclei, and the history of metal enrichment in early-type galaxies.
It is a pleasure to thank the ING staff, in particular Rene Rutten, Tom Gregory and Chris Benn, for enthusiastic and competent support on La Palma. This project made use of the LEDA database: www-obs.univ-lyon1.fr. This paper benefitted from logistic support by Kirsten Kol-Groen and Ruud Witmer, and from a careful reading by Michele Cappellari and Davor Krajnovic. BM acknowledges support from the International Gemini Observatory. RLD gratefully acknowledges the award of a Research Fellowship from the Leverhulme Trust. The SAURON project is made possible through grants 614.13.003 and 781.74.203 from ASTRON/NWO and financial contributions from the Institut National des Sciences de l’Univers, the Université Claude Bernard Lyon I, the universities of Durham and Leiden, the British Council, PPARC grant ‘Extragalactic Astronomy & Cosmology at Durham 1998–2002’, and the Netherlands Research School for Astronomy NOVA.
References
- [1] Aragón A., Gorgas J., Rego M., 1987, A&A, 185, 97.
- [2] Arnold R.A., de Zeeuw P.T., Hunter C., 1994, MNRAS, 271, 924
- [3] Bacon R., Adam G., Baranne A., Courtes G., Dubet D., Dubois J.P., Emsellem E., Ferruit P., Georgelin Y., Monnet G., Pecontal E., Rousset A., Say F., 1995, A&AS, 113, 347
- [4] Bacon R., Emsellem E., Copin Y., Monnet G., 2000, in Imaging the Universe in Three Dimensions, eds W. van Breugel & J. Bland–Hawthorn, ASP Conf. Ser. 195, 173
- [5] Bacon R., Copin Y., Monnet G., Miller B.W., Allington–Smith J.R., Bureau M., Carollo C.M., Davies R.L., Emsellem E., Kuntschner H., Peletier R.F., Verolme E.K., de Zeeuw P.T., 2001, MNRAS, 326, 23 (Paper I)
- [6] Bak J., Statler T.S., 2000, AJ, 120, 110
- [7] Barbon R., Capaccioli M., Tarenghi M., 1975, A&A, 38, 315
- [8] Bender R., 1988, A&A, 202, L5
- [9] Bender R., 1990, A&A, 229, 441
- [10] Bender R., Nieto J.-L., 1990, A&A, 239, 97
- [11] Bender R., Kormendy J., Dehnen W., 1996, ApJ, 464, L123
- [12] Bender R., Saglia R.P., Gerhard O.E., 1994, MNRAS, 269, 785
- [13] Birkinshaw M., Davies R.L., 1985, ApJ, 291, 32
- [14] Bower G.A., Green R.F., Danks A., Gull T., Heap S., Hutchings J., Joseph C., Kaiser M.E., Kimble R., Kraemer S., Weistrop D., Woodgate B., Lindler D., Hill R.S., Malamuth E.M., Baum S., Sarajedini V., Heckman T.M., Wilson A.S., Richstone D.O., 1998, ApJ, 492, L111
- [15] Bower G.A., Green R.F., Bender R., Gebhardt K., Lauer T.R., Magorrian J., Richstone D.O., Danks A., Gull T., Hutchings J., Joseph C., Kaiser M.E., Weistrop D., Woodgate B., Nelson C., Malamuth E.M., 2001, ApJ, 550, 75
- [16] Bresolin F., Kennicutt R.C., Garnett D.R., 1999, ApJ, 510, 104
- [17] Bureau M., Copin Y., Verolme E.K., de Zeeuw P.T., Bacon R., Emsellem E., Davies R.L., Kuntschner H., Carollo C.M., Miller B.W., Monnet G., Peletier R.F., 2001, in Disk Galaxies and Galaxy Disks, eds E.M. Corsini & J.G. Funes, ASP Conf. Ser., 230, 281
- [18] Burbidge E.M., Burbidge G.R., 1962, ApJ, 135, 694
- [19] Burbidge E.M., Burbidge G.R., Prendergast K.H., 1961, ApJ, 134, 232
- [20] del Burgo C., Peletier R.F., Vazdekis A., Arribas S., Mediavilla E., 2001, MNRAS, 321, 227
- [21] Busarello G., Capaccioli M., D’Onofrio M., Longo G., Richter G., Zaggia S., 1996, A&A, 314, 32
- [22] Buta R., Combes F., 1996, Fund. Cosmic Physics, 17, 95
- [23] Byun Y.-I., Grillmair C.J., Faber S.M., Ajhar E.A., Dressler A., Kormendy J., Lauer T.R., Richstone D.O., Tremaine S.D., 1996, AJ, 111, 1889
- [24] Caon N., Macchetto F.D., Pastoriza M., 2000, ApJS, 127, 39
- [25] Carollo C.M., Danziger I.J., Buson L., 1993, MNRAS, 265, 553
- [26] Carollo C.M., Franx M., Illingworth G.D., Forbes D., 1997, ApJ, 481, 710
- [27] Chromey F.R., Elmegreen D.M., Mandell A., McDermott J., 1998, AJ, 115, 2331
- [28] Copin Y., 2000, PhD Thesis, ENS Lyon
- [29] Cretton N., de Zeeuw P.T., van der Marel R.P., Rix H-W., 1999, ApJS, 124, 383
- [30] Cretton N., Rix H.-W., de Zeeuw P.T., 2000, ApJS, 536, 319
- [31] Dalle Ore C., Faber S.M., González J.J., Stoughton R., Burstein D., 1991, ApJ, 366, 38
- [32] Davies R.L., Birkinshaw M., 1988, ApJS, 68, 409
- [33] Davies R.L., Efstathiou G.P., Fall S.M., Illingworth G.D., Schechter P.L., 1983, ApJ, 266, 41
- [34] Davies R.L., Sadler E.M., Peletier R.F., 1993, MNRAS, 262, 650
- [35] Davies R.L., Kuntschner H., Emsellem E., Bacon R., Bureau M., Carollo C.M., Copin Y., Miller B.W., Monnet G., Peletier R.F., Verolme E.K., de Zeeuw P.T., 2001, ApJ, 548, L33
- [36] Davoust E., Lelievre G., Maury A., Nieto J.-L., 1984, MNRAS, 209, 503
- [37] Dressler A., 1980, ApJ, 236, 351
- [38] Dressler A., 1984, ApJ, 286, 97
- [39] Dressler A., Richstone D.O., 1988, ApJ, 324, 701
- [40] Efstathiou G., Ellis, R.S., Carter D., 1980, MNRAS, 193, 931
- [41] Efstathiou G., Ellis R.S., Carter D., 1982, MNRAS, 201, 975
- [42] Efstathiou G., Gorgas J., 1985, MNRAS, 215, 37P
- [43] Faber S.M., Jackson R., 1976, ApJ, 204, 668
- [44] Faber S.M., Wegner G., Burstein D., Davies R.L., Dressler A., Lynden-Bell D., Terlevich R.J., 1989, ApJS, 69, 763
- [45] Faber S.M., Tremaine S., Ajhar E.A., Byun Y.-I., Dressler A., Gebhardt K., Grillmair C., Kormendy J., Lauer T.R., Richstone D., 1997, AJ, 114, 1771
- [46] Ferrarese L., Ford H.C., Huchra J., Kennicutt R.C., Mould J.R., Sakai S., Freedman W.L., Stetson P.B., Madore B.F., Gibson B.K., Hughes S.M., Illingworth G.D., Kelson D.L., Macri L., Sebo K., Silbermann N.A., 2000, ApJS, 128, 431
- [47] Ferrarese L., Merritt D.R., 2000, ApJ, 539, L9
- [48] Fisher D., 1997, AJ, 113, 950
- [49] Fisher D., Franx M., Illingworth G.D., 1996, ApJ, 459, 110
- [50] Franx M., Illingworth G.D., Heckman T., 1989, ApJ, 344, 613
- [51] Franx M., Illingworth G.D., de Zeeuw P.T., 1991, ApJ, 383, 112
- [52] Franx M., van Gorkom J.H., de Zeeuw P.T., 1994, ApJ, 436, 642
- [53] Garcia A.M., 1993, A&AS, 100, 47
- [54] Gebhardt K., Richstone D.O., Kormendy J., Lauer T.R., Ajhar E.A., Bender R., Dressler A., Faber S.M., Grillmair C., Magorrian J., Tremaine S.D., 2000a, AJ, 119, 1157
- [55] Gebhardt K., Bender R., Bower G., Dressler A., Faber S.M., Filippenko A.V., Green R.F., Grillmair C., Ho L.C., Kormendy J., Lauer T.R., Magorrian J., Pinkney J., Richstone D.O., Tremaine S.D., 2000b, ApJ, 539, L13
- [56] Gerhard O.E., 1993, MNRAS, 265, 213
- [57] Geller M.J., Huchra J.P., 1983, ApJS, 52, 61
- [58] González J.J., 1993, PhD Thesis, Univ. California Santa Cruz
- [59] Gorgas J., Efstathiou G., Aragon–Salamanca A., 1990, MNRAS, 245, 217
- [60] Goudfrooij P., Emsellem E., 1996, A&A, 306, L45
- [61] Ho L.C., Filippenko A.V., Sargent W.L.W., 1997, ApJS, 112, 315
- [62] Honma M., 1999, ApJ, 516, 693
- [63] Hubble E., 1943, ApJ, 97, 112
- [64] Huchra J.P., Geller M.J., 1982, ApJ, 257, 423
- [65] Jaffe W., Ford H.C., O’Connell R.W., van den Bosch F.C., Ferrarese L., 1994, AJ, 108, 1567
- [66] Joseph C., Merritt D., Olling R., Valluri M., Bender R., Bower G., Danks A., Gull T., Hutchings J., Kaiser M.E., Maran S., Weistrop D., Woodgate B., Malamuth R.M., Nelson C., Plait P., Lindler D., 2001, ApJ, 550, 668
- [67] Knapp G.R., Guhathakurta P., Kim D.-W., Jura M.A., 1989, ApJS, 70, 329
- [68] Kormendy J., Djorgovski S.G., 1989, ARA&A, 27, 235
- [69] Kornreich D.A., Haynes M.P., Lovelace R., 1998, AJ, 116, 2154
- [70] Krumm M., Salpeter E.E., 1979, ApJ, 228, 64
- [71] Kuntschner H., Davies R.L., 1998, MNRAS, 295, 29
- [72] Kuntschner H., Lucey J.R., Smith R.J., Hudson M.J., Davies R.L., 2001, MNRAS, 323, 615
- [73] Lauer T.R., Ajhar E, Byun Y.-I., Dressler A., Faber S.M., Grillmair C., Kormendy J., Richstone D.O., Tremaine S.D., 1995, AJ, 110, 2622
- [74] Macchetto F.D., Marconi A., Axon D.J., Capetti A., Sparks W., Crane P., 1997, ApJ, 489, 549
- [75] Malin D.F.,1984, in Astronomy with Schmidt Type Telescopes, IAU Coll. 58, ed. M. Capaccioli (Reidel: Dordrecht), 73
- [76] van der Marel R.P., Franx M., 1993, ApJ, 407, 525
- [77] van der Marel R.P., Rix H.-W., Carter D., Franx M., White S.D.M., de Zeeuw P.T., 1994, MNRAS, 268, 521
- [78] van der Marel R.P., de Zeeuw P.T., Rix H-W., Quinlan G.D., 1997a, Nature, 385, 610
- [79] van der Marel R.P., de Zeeuw P.T., Rix H-W., 1997b, ApJ, 488, 119
- [80] van der Marel R.P., Cretton N., de Zeeuw P.T., Rix H-W., 1998, ApJ 493, 613
- [81] Martin P., Roy J.-R., 1994, ApJ, 424, 599
- [82] Merritt D.R., 1999, PASP, 111, 129
- [83] Mould J.R., Akeson R.L., Bothun G.D., Han M., Huchra J.P., Roth J., Schommer R.A., 1993, ApJ, 409, 14
- [84] Neistein E., Maoz D., Rix H.W., Tonry J.L., 1999, AJ, 117, 2666
- [85] Ochsenbein F., Bauer P., Marcout J., 2000, A&AS 143, 221
- [86] Paturel G., Andernach H., Bottinelli L., di Nella H., Durand N., Garnier R., Gouguenheim L., Lanoit P., Marthinet M.C., Petit C., Rousseau J., Theureau G., Vauglin I, A&AS, 124, 109
- [87] Peletier R.F., 1989, PhD Thesis, University of Groningen
- [88] Peletier R.F., Vazdekis A., Arribas S., del Burgo C., Garcia–Lorenzo B., Gutierrez C., Mediavilla E., Prada F., 1999, MNRAS, 310, 863
- [89] Pogge R.W., Eskridge P.B., 1993, AJ, 106, 1405
- [90] Prugniel P., Zasov A., Busarello G., Simien F., 1997, A&AS, 127, 117
- [91] Qian E.E., de Zeeuw P.T., van der Marel R.P., Hunter C., 1995, MNRAS, 274, 602
- [92] Rest A., van den Bosch F.C., Jaffe W., Tran H., Tsvetanov Z., Ford H.C., Davies J., Schafer J., 2001, AJ, 121, 2431
- [93] Rix H.-W., Zaritsky D., 1995, ApJ, 447, 82
- [94] Rix H.-W., de Zeeuw P.T., Cretton N., van der Marel R.P., Carollo C.M., 1997, ApJ, 488, 702
- [95] Roberts M.S., Hogg D.E., Bregman J.N., Forman W.R., Jones C., 1991, ApJS, 75, 751
- [96] Rots A., 1978, AJ, 83, 219
- [97] Sandage A., 1961, The Hubble Atlas of Galaxies (CIW)
- [98] Sarzi M., Rix H.-W., Shields J.C., Rudnick G., Ho L.H., McIntosh D.H., Filippenko A.V., Sargent W.L.W., 2001, ApJ, 550, 65
- [99] Schoenmakers R.H.M., Franx M., de Zeeuw P.T., 1997, MNRAS, 292, 349
- [100] Schneider S., 1985, ApJ, 288, L33
- [101] Schwarzschild M., 1979, ApJ, 232, 236
- [102] Statler T.S., 1991, ApJ, 382, L11
- [103] Statler T.S., 1994, AJ, 108, 111
- [104] Statler T.S., Smecker-Hane T., 1999, AJ, 117, 839
- [105] Surma P., Bender R., 1995, A&A, 298, 405
- [106] Thronson H.A., Bally J., Hacking P., 1989, AJ, 97, 363
- [107] Tonry J.L., 1984, ApJ, 283, L27
- [108] Tonry J.L., 1987, ApJ, 322, 632
- [109] Tonry J.L., Davis M., 1981, ApJ, 246, 666
- [110] Tonry J.L., Dressler A., Blakeslee J.P., Ajhar E.A., Fletcher A.B., Luppino G.A., Metzger M., Moore C.B., 2001, ApJ, 546, 681
- [111] Trager S.C., Worthey G., Faber S.M., Burstein D., González J.J., 1998, ApJS, 116, 1
- [112] Tully R.B., 1988, Nearby Galaxies Catalogue (Cambridge University Press)
- [113] Turner E.L., Gott J.R. III, 1976, ApJS, 32, 409
- [114] de Vaucouleurs G., Buta R., 1980, AJ, 85, 637
- [115] de Vaucouleurs G., de Vaucouleurs A., Corwin H.G., Buta R.J., Paturel G., Fouque P., 1991, Third Reference Catalogue of Bright Galaxies (Springer-Verlag: New York)
- [116] Vazdekis A., Peletier R.F., Beckman J.E., Casuso E., 1997, ApJS, 111, 203
- [117] Wagner S.J., Bender R., Möllenhoff C., 1988, A&A, 195, L5
- [118] Wong T., 2000, PhD Thesis, Univ. of California, Berkeley
- [119] Whitmore B.C., Lucas R.A., McElroy D.B., Steiman-Cameron T.Y., Sackett P.D., Olling R.P., 1990, AJ, 100, 1489
- [120] Worthey G., 1994, ApJS, 95, 107
- [121] Worthey G., Faber S.M., González J.J., Burstein D., 1994, ApJS, 94, 687
- [122] Worthey G., Ottaviani D.L., 1997, ApJS, 111, 377
- [123] Wozniak H., Friedli D., Martinet L., Martin P., Bratschi P., 1995 A&AS, 111, 115
- [124] Wrobel J.M., Heeschen D.S., 1991, AJ, 101, 148
- [125] Yahil A., Tammann G.A., Sandage A., 1977, ApJ, 217, 903
- [126] de Zeeuw P.T., Franx M., 1991, ARA&A, 29, 239
- [127] de Zeeuw P.T., 1996, in Gravitational Dynamics, eds O. Lahav, E. Terlevich & R.J. Terlevich (Cambridge University Press), 1
- [128] de Zeeuw P.T., Carollo C.M., 1996, in New Light on Galaxy Evolution, IAU Symp. 171, eds R. Bender & R.L. Davies, 47
- [129] de Zeeuw P.T., Allington–Smith J.R., Bacon R., Bureau M., Carollo C.M., Copin Y., Davies R.L., Emsellem E., Kuntschner H., Miller B.W., Monnet G., Peletier R.F., Verolme E.K., 2000, ING Newsletter, 2, 11
Appendix A The sample
| Galaxy | Type | Mg2 | ||||||||||||
|---|---|---|---|---|---|---|---|---|---|---|---|---|---|---|
| (1) | (2) | (3) | (4) | (5) | (6) | (7) | (8) | (9) | (10) | (11) | (12) | (13) | (14) | (15) |
| Ellipticals | ||||||||||||||
| NGC3377 | E5-6 | -4.0 | 698 | 30.14 | -19.24 | 0.905 | 0.278 | 34 | 0.39 | 20.98 | 89 | 136 | 1.15 | 0.6-2.5(8) |
| NGC3379 | E1 | -4.0 | 877 | 30.14 | -20.16 | 0.975 | 0.322 | 35 | 0.08 | 20.72 | 49 | 206 | 0.5-1.6(8) | |
| NGC4278 | E1-2 | -4.6 | 612 | 30.68 | -19.93 | 0.960 | 0.306 | 34 | 0.06 | 20.97 | 53 | 252 | 0.53 | |
| NGC4374 | E1 | -3.5 | 1016 | 31.06 | -21.23 | 1.000 | 0.319 | 51 | 0.12 | 20.68 | 17 | 297 | 0.9-2.8(9) | |
| NGC4387 | E | -3.4 | 550 | 31.06 | -18.34 | 0.965 | 0.252 | 16 | 0.34 | 57 | 117 | 0.72 | ||
| NGC4458 | E0-1 | -3.8 | 676 | 31.06 | -18.42 | 0.915 | 0.233 | 26 | 0.06 | 20 | 102 | 1.40 | ||
| NGC4473 | E5 | -4.2 | 2210 | 31.06 | -20.26 | 0.990 | 0.316 | 26 | 0.38 | 20.18 | 54 | 191 | ||
| NGC4486 | E0-1+pec | -4.0 | 1272 | 31.06 | -21.79 | 0.980 | 0.303 | 95 | 0.30 | 21.30 | 16 | 351 | 1.8-3.2(9) | |
| NGC4552 | E0-1 | -3.4 | 288 | 31.06 | -20.58 | 1.000 | 0.340 | 29 | 0.09 | 20.25 | 9 | 264 | 0.53 | |
| NGC4564 | E | -4.1 | 1116 | 31.06 | -19.39 | 0.965 | 0.345 | 20 | 0.45 | 20.43 | 147 | 168 | 4.0-7.0(7) | |
| NGC4621 | E5 | -4.0 | 431 | 31.06 | -20.64 | 0.975 | 0.293 | 40 | 0.24 | 20.72 | 120 | 245 | ||
| NGC4660 | E | -4.1 | 1082 | 31.06 | -19.22 | 0.990 | 0.306 | 12 | 0.21 | 19.76 | 149 | 191 | ||
| Lenticulars | ||||||||||||||
| NGC3384 | SB0-(s): | -2.6 | 729 | 30.14 | -19.56 | 0.955 | 0.306 | 25 | 0.49 | 19.82 | 142 | 0.9-2.5(7) | ||
| NGC3489 | SAB0+(rs) | -2.1 | 688 | 30.14 | -19.32 | 0.845 | 0.193 | 20 | 0.38 | 19.60 | 157 | 138 | ||
| NGC4150 | S00(r)? | -2.4 | 232 | 30.68 | -18.48 | 0.830 | 0.131 | 18 | 0.30 | 148 | ||||
| NGC4262 | SB0-(s) | -2.6 | 1361 | 31.06 | -18.88 | 0.970 | 0.325 | 13 | 0.09 | 20.03 | 372 | 186 | ||
| NGC4270 | S0 | -1.1 | 2349 | 31.06 | -18.28 | 0.950 | 0.237 | 13 | 0.53 | 20.79 | 126 | 140 | ||
| NGC4382 | S0+(s)pec | -1.8 | 745 | 31.06 | -21.28 | 0.895 | 0.261 | 55 | 0.22 | 20.74 | 177 | |||
| NGC4459 | S0+(r) | -2.0 | 1182 | 31.06 | -19.99 | 0.970 | 0.270 | 35 | 0.23 | 20.99 | 174 | 5.9-8.7(7) | ||
| NGC4477 | SB0(s):? | -1.8 | 1327 | 31.06 | -19.96 | 0.970 | 0.09 | 21.22 | 172 | |||||
| NGC4526 | SAB00(s): | -1.6 | 566 | 31.06 | -20.68 | 0.975 | 0.304 | 44 | 0.63 | 20.68 | 136 | 256 | ||
| NGC4546 | SB0-(s): | -2.6 | 1036 | 31.06 | -19.98 | 0.990 | 27 | 0.50 | 20.36 | 152 | 242 | |||
| NGC4550 | SB00:sp | -2.3 | 407 | 31.06 | -18.83 | 0.890 | 0.191 | 15 | 0.71 | 110 | 80 | |||
| NGC4570 | S0 sp | -1.7 | 1731 | 31.06 | -19.54 | 0.970 | 0.342 | 18 | 0.68 | 19.93 | 188 | |||
| Spirals | ||||||||||||||
| NGC3623 | SABa(rs) | 1.0 | 769 | 30.14 | -20.82 | 0.975 | 85 | 0.76 | 234 | 173 | ||||
| NGC4235 | Sa(s)sp | 1.1 | 2332 | 31.06 | -19.20 | 1.005 | 27 | 0.78 | 21.17 | 136 | ||||
| NGC4245 | SB0/a(r): | 0.4 | 837 | 30.68 | -18.72 | 0.920 | 24 | 0.17 | 21.18 | 161 | ||||
| NGC4274 | (R)SBab(r) | 1.4 | 877 | 30.68 | -20.08 | 0.980 | 45 | 0.63 | 20.85 | 218 | 138 | |||
| NGC4293 | (R)SB0/a(s) | 1.4 | 823 | 31.06 | -20.37 | 0.940 | 83 | 0.48 | 22.67 | 163 | 163 | |||
| NGC4314 | SBa(rs) | 1.5 | 957 | 30.68 | -19.55 | 0.895 | 34 | 0.05 | 21.11 | 204 | ||||
| NGC4383 | Sa$ pec | 1.1 | 1663 | 31.06 | -18.93 | 0.455 | 11 | 0.49 | 19.82 | 96 | ||||
| NGC4405 | S0/a(rs): | 1.3 | 1751 | 31.06 | -18.54 | 0.750 | - | 0.34 | 68 | |||||
| NGC4425 | SB0+:sp | 0.5 | 1865 | 31.06 | -18.83 | 0.930 | 23 | 0.64 | 21.28 | 132 | ||||
| NGC4596 | SB0+(r) | -0.3 | 1901 | 31.06 | -19.94 | 0.970 | 38 | 0.13 | 21.28 | 152 | 0.4-1.2(8) | |||
| NGC4698 | Sab(s) | 1.4 | 31.06 | -20.05 | 0.940 | 33 | 0.31 | 21.10 | 245 | 172 | ||||
| NGC4772 | Sa(s) | 1.2 | 1042 | 31.06 | -19.56 | 0.930 | 24 | 0.42 | 20.30 | 239 | ||||
Notes: (1) Galaxy identifier. (2) Hubble type (NED). (3) Numerical morphological type (LEDA) (4) Recession velocity in (LEDA). (5) Distance modulus in mag, determined as described in §2.2. (6) Absolute blue magnitude in mag. (7) Effective color in mag (LEDA). (8) Central Mg2 linestrength in mag (Hypercat). (9) Effective radius in the band, in arcsec (RC3). (10) Ellipticity of the contour of 25 mag arcsec-2 surface brightness (LEDA). (11) Mean effective surface brightness in the band, in mag (LEDA). (12) Maximum observed mean rotation in . For the ellipticals this is the maximum mean stellar rotation of the main galaxy (see §2.2). For the lenticulars and the spirals the values taken from LEDA generally refer to the circular velocity. (13) Central velocity dispersion in (LEDA). (14) Average logarithmic slope of the deprojected luminosity profile within 10–50 pc, taken from Carollo et al. (1997, Tables 5 and 8). (15) Reported central black hole mass , where the notation indicates means . References given in §2.2.
Tables 1 and 2 list the galaxies in the representative sample defined in §2.1, for E/S0/Sa galaxies in ‘clusters’ and in the ‘field’, respectively. The tables also list a number of global and nuclear properties. In addition to the most common name used in LEDA, we give the Hubble type (NED), numerical morphological type (LEDA), recession velocity (LEDA), adopted distance modulus (§2.1), absolute blue magnitude (§2.1), effective color (LEDA), central Mg line-strength Mg2 (Hypercat), effective radius in (RC3), ellipticity at mag arcsec -2 (LEDA), mean effective surface brightness (LEDA), maximum rotation velocity (LEDA), central velocity dispersion (LEDA), deprojected central cusp slope (§2.2), and central black hole mass (§2.2).
| Galaxy | Type | Mg2 | ||||||||||||
|---|---|---|---|---|---|---|---|---|---|---|---|---|---|---|
| (1) | (2) | (3) | (4) | (5) | (6) | (7) | (8) | (9) | (10) | (11) | (12) | (13) | (14) | (15) |
| Ellipticals | ||||||||||||||
| NGC 821 | E6? | -4.2 | 1742 | 31.86 | -20.44 | 1.020 | 0.316 | 50 | 0.32 | 22.02 | 91 | 208 | 3.0-7.0(7) | |
| NGC2699 | E: | -5.0 | 1825 | 31.83 | -18.85 | 0.980 | 0.282 | 0.06 | ||||||
| NGC2768 | E6: | -3.1 | 1324 | 31.66 | -21.15 | 0.960 | 0.276 | 64 | 0.42 | 21.94 | 148 | 188 | ||
| NGC2974 | E4 | -3.6 | 1983 | 31.93 | -20.32 | 1.005 | 0.305 | 24 | 0.39 | 20.74 | 207 | 229 | ||
| NGC3608 | E2 | -4.3 | 1201 | 30.96 | -19.54 | 1.000 | 0.329 | 34 | 0.21 | 21.57 | 26 | 204 | 0.80 | 0.8-2.5(8) |
| NGC5198 | E1-2: | -3.4 | 2514 | 32.80 | -20.38 | 0.985 | 0.322 | 26 | 0.14 | 21.89 | 4 | 195 | ||
| NGC5813 | E1-2 | -4.5 | 1917 | 32.10 | -20.99 | 1.010 | 0.319 | 57 | 0.24 | 22.12 | 8 | 238 | 0.24 | |
| NGC5831 | E3 | -4.3 | 1660 | 31.79 | -19.73 | 0.985 | 0.301 | 26 | 0.13 | 21.48 | 27 | 175 | ||
| NGC5838 | S0- | -3.0 | 1348 | 31.36 | -19.87 | 1.010 | 23 | 0.59 | 20.51 | 225 | 274 | |||
| NGC5845 | E: | -4.1 | 1581 | 31.69 | -18.58 | 1.120 | 0.319 | 0.32 | 19.84 | 127 | 221 | 0.51 | 2.5-5.0(8) | |
| NGC5846 | E0-1 | -4.2 | 1722 | 31.98 | -21.24 | 1.030 | 0.333 | 63 | 0.06 | 21.96 | 7 | 250 | ||
| NGC5982 | E3 | -3.9 | 2876 | 33.11 | -21.46 | 0.940 | 0.303 | 24 | 0.30 | 21.08 | 85 | 251 | 0.21 | |
| Lenticulars | ||||||||||||||
| NGC 474 | S00(s) | -2.2 | 2304 | 32.50 | -20.42 | 0.940 | 34 | 0.19 | 21.99 | 244 | 170 | |||
| NGC 524 | S0+(rs) | -1.5 | 2422 | 32.58 | -21.40 | 1.070 | 0.307 | 50 | 0.01 | 21.73 | 245 | 0.52 | ||
| NGC1023 | SB0-(rs) | -2.6 | 607 | 30.06 | -20.42 | 1.010 | 0.311 | 40 | 0.56 | 20.32 | 138 | 206 | 0.74 | 2.4-4.8(7) |
| NGC2549 | S00(r) sp | -2.0 | 1064 | 31.12 | -19.36 | 0.955 | 0.269 | 17 | 0.68 | 20.05 | 146 | |||
| NGC3414 | S0 pec | -2.5 | 1441 | 31.52 | -19.78 | 0.930 | 0.327 | 21 | 0.17 | 20.53 | 223 | 246 | ||
| NGC2685 | (R)SB0+pec | -0.7 | 867 | 30.79 | -19.05 | 0.935 | 0.229 | 32 | 0.51 | 21.50 | 147 | 99 | ||
| NGC2695 | SAB00(s) | -2.4 | 1831 | 31.83 | -19.38 | 0.930 | 0.319 | 16 | 0.27 | 20.96 | 220 | |||
| NGC3032 | SAB00(r) | -1.7 | 1561 | 31.68 | -18.77 | 0.630 | 0.129 | 9 | 0.11 | 20.01 | 169 | 82 | ||
| NGC3156 | S0: | -2.4 | 1174 | 30.90 | -18.08 | 0.770 | 0.110 | 14 | 0.38 | 20.93 | 362 | 84 | ||
| NGC5308 | S0- sp | -1.1 | 2029 | 32.26 | -20.27 | 0.925 | 18 | 0.82 | 19.87 | 146 | 260 | |||
| NGC7332 | S0 pec sp | -1.7 | 1197 | 31.42 | -19.93 | 0.905 | 0.242 | 15 | 0.73 | 19.43 | 131 | 134 | 1.00 | |
| NGC7457 | S0-(rs)? | -2.2 | 758 | 30.46 | -18.81 | 0.900 | 0.178 | 32 | 0.41 | 21.57 | 75 | 1.7-6.0(6) | ||
| Spirals | ||||||||||||||
| NGC1056 | Sa: | 1.0 | 1695 | 31.70 | -19.44 | 1.020 | 0.44 | 140 | ||||||
| NGC2273 | SBa(r): | 0.5 | 1887 | 32.17 | -20.21 | 0.940 | 26 | 0.25 | 21.61 | 228 | 124 | |||
| NGC2844 | Sa(r): | 0.2 | 1488 | 31.66 | -18.38 | 0.810 | 0.55 | 145 | 114 | |||||
| NGC4220 | S0+(r) | -0.1 | 966 | 30.88 | -19.01 | 0.970 | 30 | 0.61 | 21.36 | 167 | 140 | |||
| NGC4369 | (R)Sa(rs) | 1.1 | 986 | 31.01 | -18.96 | 0.500 | 16 | 0.01 | 20.41 | 288 | ||||
| NGC5448 | (R)SABa(r) | 1.2 | 1971 | 32.36 | -20.78 | 0.760 | 72 | 0.48 | 22.01 | 207 | ||||
| NGC5475 | Sa sp | 1.0 | 1699 | 32.06 | -19.39 | 0.74 | ||||||||
| NGC5689 | SB00(s): | 0.4 | 2147 | 32.53 | -20.32 | 0.71 | 170 | 203 | ||||||
| NGC5953 | Sa:pec | -0.4 | 2061 | 32.22 | -19.61 | 0.26 | 120 | 129 | ||||||
| NGC6501 | S0+: | -0.3 | 2958 | 33.03 | -20.38 | 1.050 | 0.10 | 193 | 222 | |||||
| NGC7731 | (R)SBa:pec | 1.2 | 2866 | 32.96 | -18.78 | 0.805 | 15 | 0.19 | 21.43 | 130 | ||||
| NGC7742 | Sb(r) | 1.3 | 1655 | 31.82 | -19.76 | 0.775 | 15 | 0.05 | 20.23 | 92 | 106 | |||
Notes and units as in Table 1.