Detection of a CMB decrement towards a cluster of mJy radiosources
Abstract
We present the results of radio, optical and near-infrared observations of the field of TOC J0233.3+3021, a cluster of milliJansky radiosources from the TexOx Cluster survey. In an observation of this field with the Ryle Telescope (RT) at 15 GHz, we measure a decrement in the cosmic microwave background (CMB) of Jy on the RT’s 0.65 k baseline. Using optical and infrared imaging with the McDonald 2.7-m Smith Reflector, Calar Alto 3.5-m telescope and UKIRT, we identify the host galaxies of five of the radiosources and measure magnitudes of , , .
The CMB decrement is consistent with the Sunyaev-Zel’dovich (SZ) effect of a massive cluster of galaxies, which if modelled as a spherical King profile of core radius has a central temperature decrement of K. The magnitudes and colours of the galaxies are consistent with those of old ellipticals at . We therefore conclude that TOC J0233.3+3021 is a massive, high redshift cluster. These observations add to the growing evidence for a significant population of massive clusters at high redshift, and demonstrate the effectiveness of combining searches for AGN ‘signposts’ to clusters with the redshift-independence of the SZ effect.
keywords:
cosmic microwave background — cosmology:observations — galaxies:clusters:general — galaxies:active1 Introduction
Given a set of cosmological parameters such as and , –body simulations of the build–up of the mass function of dark matter halos (see e.g. Jenkins et al, 2000) are now sufficiently advanced that there are clear predictions concerning the number of systems of a given mass expected at a given cosmic epoch. At redshifts and beyond, however, only a few members of the population of galaxy clusters are known (e.g. Stanford et al. 1997; Rosati et al. 1999; Chapman et al. 2000; Blanton et al. 2000; Fabian et al. 2001). Here we present the first result of a new technique designed to find distant clusters.
The TexOx Cluster (TOC) survey is an initiative designed to find massive high-redshift clusters. The TOC survey searches for statistical overdensities of radiosources in the deep, wide area NRAO VLA Sky Survey (NVSS; Condon et al. 1998). Although any search for clusters using AGNs as signposts will find only a small fraction of the total population, the surface density of radiosources is sufficiently low, and the sky coverage of the NVSS sufficiently large, that this technique is very efficient. TOC selects candidates where the radiosource overdensity is greater than 5- in a arcmin2 box. High-resolution VLA followup is used to eliminate the small number of cases where the apparent clustering of sources is spurious, and then optical and infrared imaging are carried out to identify the hosts galaxies of the radiosources and other candidate clusters galaxies.
A full description of the first TOC results will be presented in a forthcoming paper (Croft et al. in preparation; hereafter C2001). In this letter we describe observations of one of the TOC candidates, TOC J0233.3+3021. Our particular motivation in these observations was to exploit the Sunyaev-Zel’dovich (SZ, Sunyaev and Zel’dovich 1972) effect as a means of confirming candidate high-redshift clusters.
In any cluster of galaxies, electrons in the intracluster plasma scatter the CMB photons passing through, distorting the thermal spectrum of the incident CMB and producing a change in brightness temperature given by . Here and are the electron number density and Temperature, and d is an element of line-of-sight element through the cluster. Two consequences of this are:
-
•
Because the CMB imprinting process is a scattering, the same is produced by a given whatever the redshift of the cluster.
-
•
The SZ signal from a cluster is less sensitive to mass concentration than either X-ray (emissivity ) or optical searches. The integral of over the projected surface of a cluster is proportional to just the mass–temperature product of the gas.
Observations of the SZ effect in several X-ray selected clusters at have now been made using cm-wave interferometers (e.g. Grego et. al 2001, Joy et al. 2001, Grainge et al. 2001). Indeed, the SZ effect is an ideal tool for conducting a survey for clusters, not only because it allows cluster selection to high redshift, but because the selection is limited only by gas mass, almost independently of redshift. Plans have been developed for a new generation of dedicated SZ survey telescopes (e.g. Kneissl et al. 2001, Holder et al. 2000); however, in the absence of an SZ survey, we have undertaken pointed SZ observations of a TOC candidate to confirm that it is a high- cluster and estimate its mass.
2 Observations and results
2.1 Ryle Telescope Observations
The standard configuration of the Ryle Telescope (RT) for SZ observations has described in detail elsewhere (e.g. Grainge et al. 1996). A nearly-east-west array of five 13-m antennas is used, operating at 15 GHz, giving projected baselines from 13m to 108m (0.65–5.4 k). Unresolved sources in the telescope field of view — typically radiogalaxies — contribute equal flux to all baselines of the array, whereas the extended structure of any SZ signal is typically present only on the shortest baseline. We therefore use the long baselines to identify and remove point sources from the field, and use the residual flux on the shortest baseline to measure the SZ flux decrement.
RT observations of the TOC J0233.3+3021 field totalling 280 hours were made during 35 days in the period 1999 January to 1999 June (the declination of the source means that it can only be observed for 8 hours each day). The telescope was in Cb configuration (Grainge et al. 1996), resulting in the aperture-plane coverage shown in Fig. 1. In this configuration the array provides two baselines of maximum projected length 900, three of length 1800, two of 2700 and one each of 3600, 4500 and 5400.
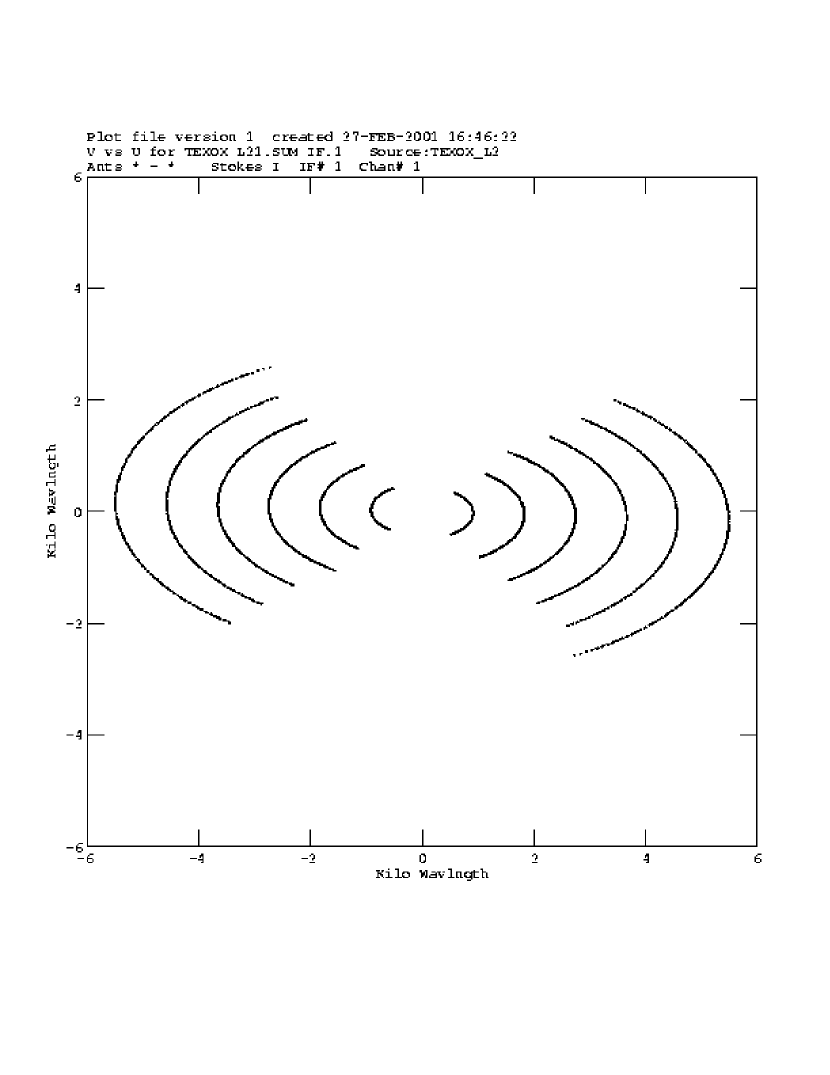
Note that since each day’s observation is only eight hours, the baseline tracks in the plane are azimuthally truncated. For each day, observations of the target field were interleaved with observations of a phase calibrator about every 20 minutes, and a primary flux calibrator (3C286 or 3C48) was observed at either the start or end of the run.
We analysed the combined 35-day visibility data for evidence of a flux decrement on the shortest baseline. First, we made and Cleaned a naturally-weighted map, using only visibilities from projected baselines longer than 1.5 k, which is shown in Fig 2, with the NVSS image of the
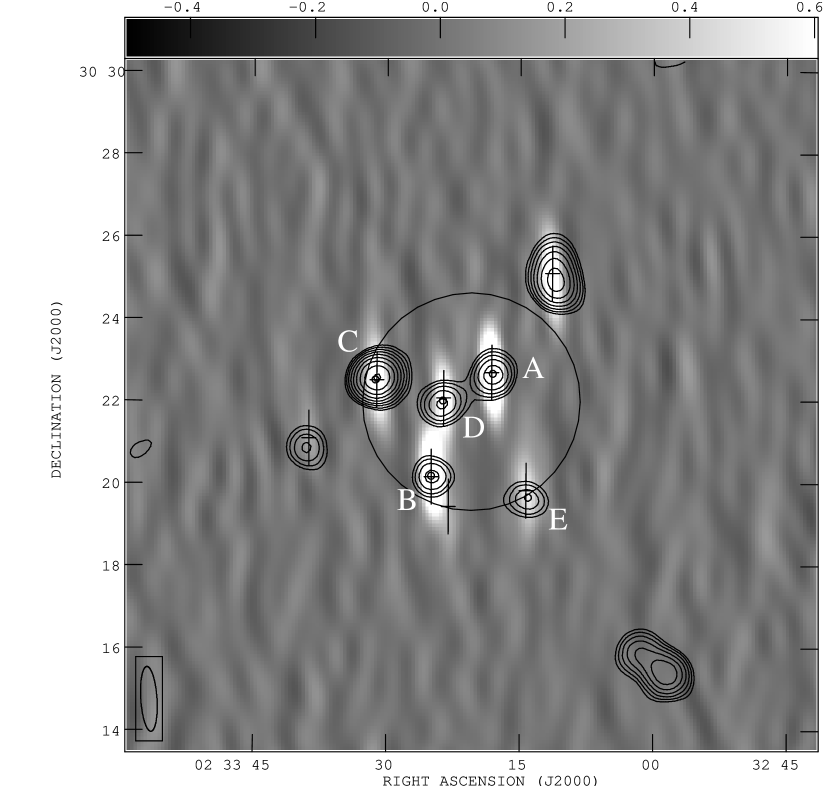
TOC J0233.3+3021 field overlaid. Several of the NVSS sources are readily identifiable on the RT long-baseline map. Next, two of us (HJB and GC) independently investigated the sources present in the RT long-baseline map. We measured the positions of sources in the map using the task Maxfit in Aips, then subtracted the brightest source from the visibility data using Uvsub in Aips. This process was repeated until no sources remained whose peak fluxes were greater than 3.5 times the rms in the map well outside the primary beam. A list of eight sources was agreed upon; all but one of these sources is identifiable on the NVSS map, as shown in Fig 2. Accurate positions and fluxes for these sources were then calculated using the the FluxFitter algorithm (Grainger et al. 2001). FluxFitter takes input estimates of the point-source fluxes and positions, and varies these to minimize -squared between the visibility data and model visibilities containing the point sources and noise; it has been demonstrated to produce robust flux and position measurements (Grainger et al. 2001). The resulting source positions and fluxes, calculated using all the data from the projected baselines longer than 1.5 k shown in Table 1. These sources were then subtracted
| RT RA (J2000) | RT Dec (J2000) | ID RA (J2000) | ID Dec (J2000) | Label | ||||
|---|---|---|---|---|---|---|---|---|
| mJy | ||||||||
| 02 33 18.22 | 30 22 42.91 | 2.007 | 02 33 18.1 | 30 22 40.1 | 23.75 | 19.75 | 18.19 | A |
| 02 33 24.97 | 30 20 09.31 | 1.906 | 02 33 25.0 | 30 20 11.2 | 23.28 | 19.74 | 19 | B |
| 02 33 11.41 | 30 25 07.91 | 1.118 | ||||||
| 02 33 31.17 | 30 22 33.31 | 1.077 | 02 33 31.3 | 30 22 31.2 | 23.35 | 20.76 | 18.58 | C |
| 02 33 23.65 | 30 22 06.41 | 1.053 | 02 33 23.7 | 30 22 00.9 | 23.10 | 19.86 | 18.19 | D |
| 02 33 14.23 | 30 19 46.41 | 0.497 | 02 33 14.1 | 30 19 39.8 | 24.96 | 20.82 | 18.39 | E |
| 02 33 38.87 | 30 21 10.41 | 0.352 | ||||||
| 02 33 22.83 | 30 19 24.11 | 0.339 |
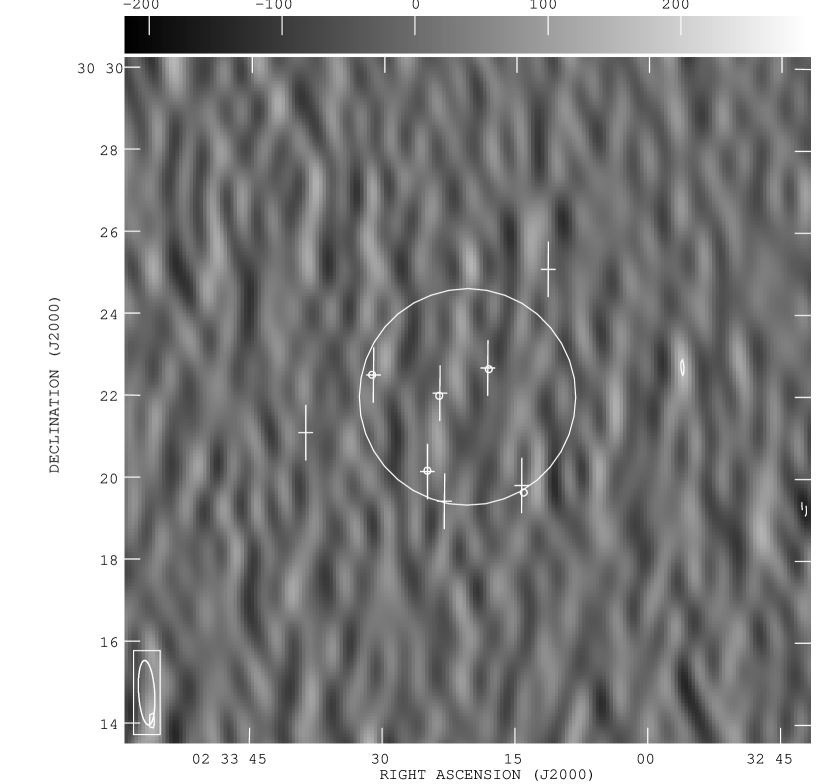
from all the visibilites. To check that no residual flux from any of the sources was present, source-subtracted maps were made using baselines of length 1.5 k and greater (shown in Fig 3), and 2.0 k and greater. These maps are both consistent with noise.
Finally, a map was made using source-subtracted visibilities with projected baselines in the range 0.65–1.0 k, corresponding to the single shortest physical baseline. This map showed a negative feature centred at 02h 33m 20.8s, 30∘ 21′ 58.7′′ (J2000), and with a minimum flux of in the dirty map of Jy. The synthesized beam of this single-baseline map has strong sidelobes, so the rms level on the map even well outside the primary beam is still somewhat affected by the presence of the negative feature at the centre of the map. We therefore made a very large map (2048 2048 5′′-square pixels) and measured the map rms in 128-pixel square regions where the map apppeared by eye to be unaffected by sidelobes from the central source. The rms levels agreed wth the expected noise, due to the telescope system temperature, of 95 Jy. The short-baseline map was Cleaned to a flux limit of Jy, and this map is presented in Fig. 4. On inspection of the azimuthally-averaged
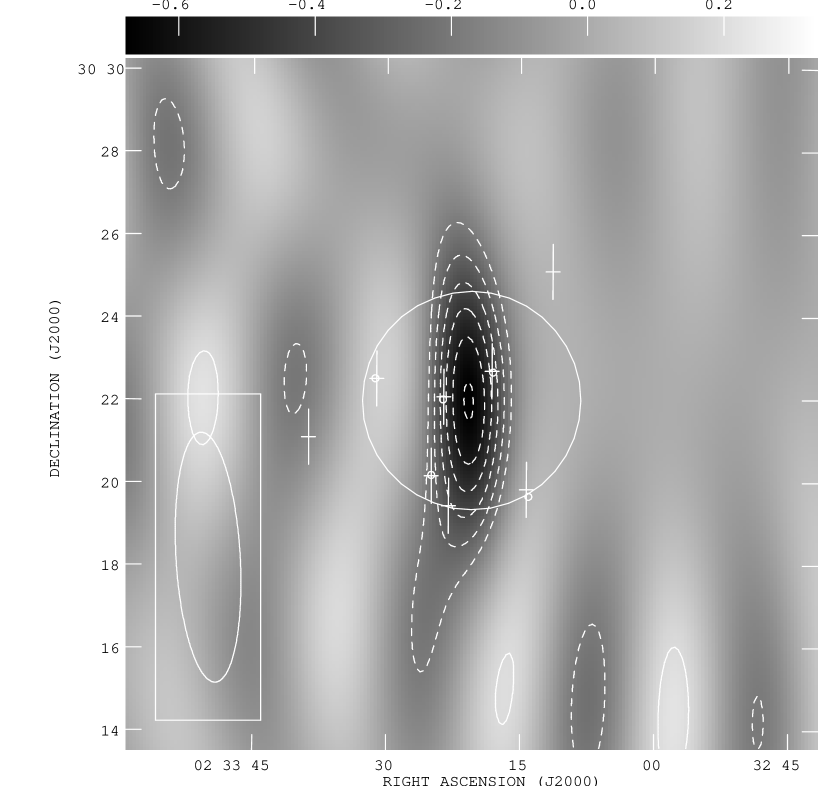
visibilities (Fig. 5), the flux on the shortest baseline is Jy, with an rms of 170 Jy (note that since the shortest baseline has an elliptical track in the aperture plane, this rms includes the variation in the amplitude of the SZ signal as a function of distance).
2.2 Optical and infra-red observations of the galaxies
We obtained -band imaging of the TOC J0233.3+3021 field using the Imaging Grism Instrument on the McDonald Observatory 2.7-m Smith Reflector in 1998 October, 1999 October, and 2000 September, and -band imaging of the field at the Calar Alto 3.5-m telescope in 1999 August. Additionally, we obtained several -band images of the TOC J0233.3+3021 field with UFTI at UKIRT in 2000 July. Full details, and extensive discussion of other candidate cluster galaxies, will be presented in C2001. Using these images, in combination with high-resolution VLA imaging (C2001), we have identified the host galaxies of the central five NVSS radiosources shown in Fig. 2. For four of these galaxies, we have obtained 3.5′′-diameter aperture magnitudes in all filters; for the fifth galaxy, only and magnitudes are available. The measured magnitudes of the galaxies are presented in Table 1 along with the positions of the host galaxy identifications. The positions were measured from the -band image, with an astrometric solution using the positions of stars measured in the Cambridge APM survey. The magnitudes of the galaxies are all roughly , , .
In 2000 January, we attempted spectroscopy of the radiogalaxies with ISIS on the WHT. We used a 2-arcsec slit, with sensitivity on the ISIS red arm up to 9340 Å. We took 1800-second spectra of A (at PA=118, the axis of its double structure; see C2001), galaxies B & C (as a pair with PA=113), and galaxies D & E (as a pair with PA=77). Faint red continuum was detected spectroscopically in all the cases expected (i.e. the 4 brightest), but no emission lines were evident.
3 Discussion
3.1 The redshifts of the radiogalaxies
The optical and infrared magnitudes of the radiogalaxies immediately imply that they lie at significant redshift. In particular, given the -band Hubble diagram for faint radiosources (such as the 7C sample of Willott, Rawlings and Blundell, 2001), the magnitudes of the TOC J0233.3+3021 radiogalaxies suggest that they are galaxies at redshifts of . We next consider the colours of the radiogalaxies. It is now well-established that faint radiogalaxies at are hosted by Extremely Red Objects (EROs) with colours as red as . (e.g. Dunlop et al. 1996; Willott, Rawlings and Blundell, 2001). This is consistent with a picure in which faint radiosources at these redshifts are hosted by old elliptical galaxies. Comparing the the radiogalaxies with galaxies in the cluster ClG J0848+4453 found by Stanford et al. (1997), we find a close similarity in colour-magnitude diagrams (Fig. 6).

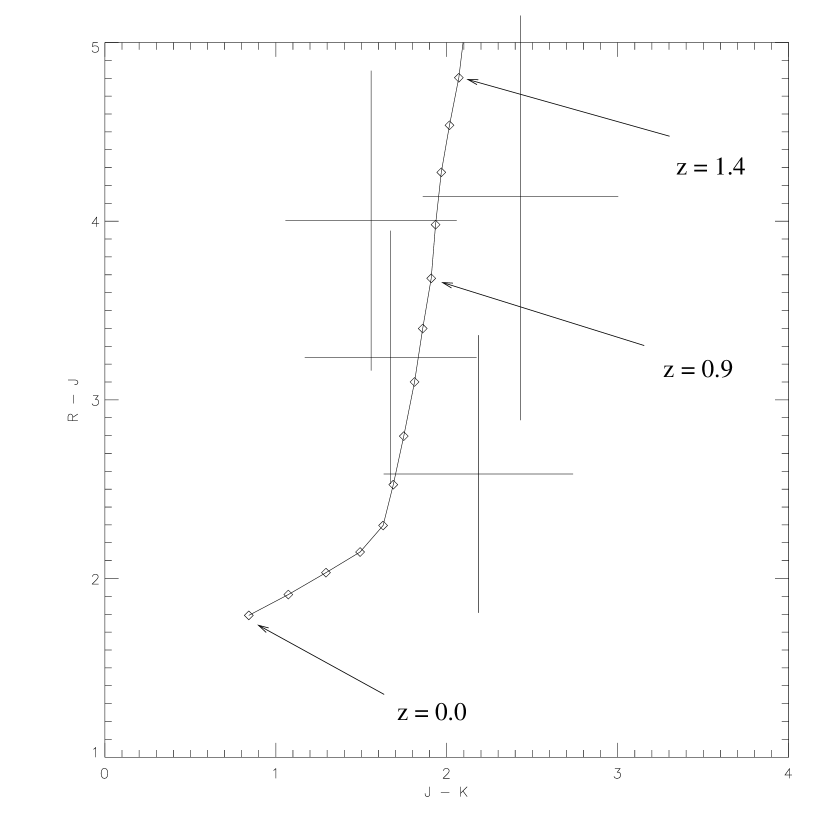
If we plot the colours of the radiogalaxies against the track of a redshifted E0 galaxy, we find that they cluster about the region on colour-colour space (Fig. 7).
Lastly, the faint red continuum detected in the optical spectra of the radiogalaxies is also consistent with their lying at .
These optical and infrared data do not alone demonstrate unequivocally that this overdensity of radiogalaxies is a real cluster. However, the coincidence between the overdensity of sources and the CMB decrement leads us to conclude that we are seeing the SZ effect of a massive cluster, and that most, if not all, the radiogalaxies are cluster members.
3.2 Cluster properties inferred from the SZ effect
From the SZ flux on the shortest spacing, we can now estimate the gas mass of the cluster. We used Profile (Grainge et al. 2001b) to model the cluster as a spherical King-profile gas distribution, with a gas temperature of 7keV, -parameter 0.65, and find the best fit value of the central electron density () to the data for varying core radius . While the temperature and parameter are unknown in the absence of deep X-ray imaging, the values we assume are typical of those which have been been measured in X-ray selected clusters (see, e.g., Grego et al. 2001 for a summary). For an , cosmology, with kms-1Mpc-1, we find that the gas mass within a radius of 1 Mpc is proportional to . We place the constraint from our measurement that the flux on the second shortest RT baseline is less than 200 Jy. This core radius corresponds to a physical distance of 178 kpc and the appropriate best fit model has and a central decrement of K. We therefore estimate that the minimum gas mass of the cluster is . Assuming that the total mass of the cluster is ten times greater than this, TOC J0233.3+3021 is clearly a massive cluster similar to those identified at in X-ray surveys such as EMSS.
The accurate measurement of the properties of this population of high- massive clusters is a significant goal in observational cosmology. In this Letter, we have demonstrated that current SZ observations are effective in confirming high- cluster candidates which have been selected by other means; SZ investigations of other TOC candidates are continuing. The new generation of SZ survey telescopes will not be restricted to the use of ‘signposts’ to high- clusters, and promise to detect the majority of the distant cluster population.
4 Conclusions
We have observed the field of TOC J0233.3+3021, a cluster of milliJansky radiosources selected from the NRAO VLA Sky Survey (NVSS), with the Ryle Telescope (RT) at 15 GHz, and in the optical and near-infrared with the McDonald 2.7-m, Calar Alto 3.5-m, and UKIRT. Our conclusions are as follows:
-
1.
After subtraction of the baseline-independent fluxes of the radiosources, we find a seven-sigma decrement on the RT shortest baseline of Jy.
-
2.
The radiosource host galaxies have magnitudes of , , . From the infrared magnitude-redshift relation for radiosources, the galaxies must lie at . The similar colours strongly suggest that these galaxies are evolved ellipticals at , and the galaxy magnitudes are consistent with the colour-magnitude diagrams of known clusters.
-
3.
We therefore conclude that we have identified a strong SZ decrement with a cluster of galaxies at . To produce the SZ decrement, the cluster must have a mass-temperature product similar to that of massive Abell clusters at low redshift; we estimate a minumum gas mass of . These observations support the growing evidence for a population of massive clusters at .
-
4.
These observations demonstrate the effectiveness of combining searches for AGN ‘signposts’ to clusters with the redshift-independence of the SZ effect. Investigations of this and other high- cluster candidates selected from NVSS are continuing.
ACKNOWLEDGEMENTS
We thank staff of the the Cavendish Astrophysics group for the operation of the Ryle Telescope, which is funded by PPARC. We thank Joe Tufts for help with the -band observing, and Chris Willott for help with the ISIS spectroscopy. GC acknowledges a PPARC Postdoctoral Research Fellowship. HJB and SDC acknowledge PPARC PhD studentships. RD acknowledges support from a British Marshall Scholarship. UKIRT is operated by the Joint Astronomy Centre on behalf of PPARC. The WHT is operated on the island of La Palma by the Isaac Newton Group in the Spanish Observatorio del Roque de los Muchachos of the Instituto de Astrofisica de Canarias. This material is based in part upon work supported by the Texas Advanced Research Program under Grant No. 009658-0710-1999
REFERENCES
Blanton, E.L., Gregg, M.D., Helfland, D.J., Becker, R.H.,
White, R.L., 2000, ApJ, 531, 118
Chapman, S.C., McCarthy, P.J., Persson, S.E., 2000, AJ 120, 1612
Condon, J. J., Cotton, W. D., Greisen, E. W., Yin, Q. F., Perley, R. A.,
Taylor, G. B., Broderick, J. J., 1998, AJ, 115, 1693
Dunlop, J., Peacock, J., Spinrad, H., Dey, A., Jimenez, R.,
Stern, D., Windhorst, R., 1996, Nature, 381, 581
Fabian, A.C., Crawford, C.S., Ettori, S., Sanders, J.S., 2001, MNRAS
in press, astro-ph/0101478
Grainge, K., Jones, M., Pooley, G., Saunders, R., Baker, J., Haynes, T.,
Edge, A., 1996, MNRAS, 278, L17
Grainge, K., Grainger, W.F., Jones, M.E., Kneissl, R., Pooley, G.G.,
Saunders, R., 2001a, MNRAS submitted, astro-ph/0102496
Grainge K., Jones M. E., Saunders R., Pooley G. G., Edge A.,
Kneissl R., 2001b, MNRAS submitted
Grainger, W.F., Das, R., Grainge, K., Jones, M.E., Kneissl, R., Pooley, G.G.,
Saunders, R., 2001, MNRAS submitted, astro-ph/0102489
Grego, L., et al., 2001, ApJ submitted, astro-ph/0012067
Holder, G.P., Mohr, J.J., Carlstrom, J.E., Evrard, A.E., Leitch, E.M., 2000, ApJ, 544, 629
Jenkins, A., et al, 2001, MNRAS, 321, 372
Joy, M., et al, 2001, ApJL, submitted, astro-ph/0012052
Kneissl, R., Jones, M. E., Saunders, R., Eke, V.R., Lasenby, A.N.,
Grainge, K., Cotter, G., 2001, MNRAS submitted
Rosati P., Stanford S. A., Eisenhardt P. R., Elston R., Spinrad H., Stern D., Dey A., 1999,
AJ, 118, 76
Sunyaev, R. A., Zel’dovich, Ya. B., 1972. Comm. Astrophys. Sp. Phys., 4, 173.
Stanford, S.A., Elston, R., Eisenhardt, P.R., Spinrad, H., Stern, D.,
Dey, A., 1997, AJ, 114 2232
Willott, C.J., Rawlings, S., Blundell, K.M., 2001. MNRAS in press,
astro-ph/0011082