The Evolution of Disks and Winds in Dwarf Novae Outbursts
Abstract
Far ultraviolet (FUV) observations are excellent probes of the inner accretion disk, disk outflows, and the mass-accumulating white dwarf in cataclysmic variables. Here we study the contrasting behavior of two canonical dwarf novae in outburst by presenting FUSE FUV (904 – 1187 Å) spectroscopy of U Gem and SS Cyg. We observed each system four times during a single outburst. The outburst peak and early decline spectra of SS Cyg are well fit by models of a steady-state accretion disk and a biconical wind. A broad, blueshifted OVI wind-formed absorption line is the only strong spectral feature. In late outburst decline, O VI and C III lines are seen as broad emission features and the continuum has flattened. In U Gem, the continua of the optical outburst plateau spectra are plausibly fit by accretion disk model spectra. The spectra also show numerous narrow, low-velocity absorption lines that do not originate in the inner accretion disk. We discuss the line spectra in the context of partial absorption of the FUV continuum by low-velocity, vertically-extended material located at large disk radii. The late outburst decline spectrum of U Gem is dominated by the white dwarf. WD model fits confirm the sub-solar C and super-solar N abundances found in earlier studies.
Space Telescope Science Institute, 3700 San Martin Drive, Baltimore, MD 21218 USA
Imperial College of Science, Technology and Medicine, Blackett Laboratory, Prince Consort Rd., London SW7 2BZ UK
Dept. of Physics and Astronomy, University of Southampton, Southampton SO17 1BJ UK
Laboratory of High Energy Astrophysics, NASA Goddard Space Flight Center, Greenbelt, MD 20771 USA
American Association of Variable Star Observers, 25 Birch St., Cambridge, MA 02138 USA
1. Introduction
The outburst cycles of dwarf novae (DN) allow observers to probe the evolution of disk-accreting systems as they undergo quasi-periodic perturbations. During outburst, changes in the structure of the disk as a function of mass accretion rate, the link between the state of the disk and outflows, and the impact of the accreted material on the structure and properties of the mass-accreting primary can be examined. The far-ultraviolet (FUV) is well-suited for such studies. The FUV continuum, where the hot disk peaks in flux, is sensitive to the structure of the inner disk. The FUV is also rich in spectral lines that trace the temperature and ionization structure of disk, winds, and the white dwarf/boundary layer region in DN. In this light, we have pursued FUV spectroscopy of two canonical DN, U Gem and SS Cyg, during the peaks and declines of their outbursts.
2. The FUSE Observations
We observed U Gem during its 2000 March outburst. Three of the observations were obtained on optical outburst plateau, the fourth during late outburst decline, about two days before the return to optical quiescence. We observed SS Cyg during the 2000 November narrow outburst. The first observation was obtained at outburst peak and the following three during the decline, with the last observation occuring on the final day of the optical outburst. All observations were obtained with FUSE, which covers the 904 – 1187 Å wavelength at a spectral resolution through its large aperture of R12,000. We obtained multiple spectra spread over several binary orbits during each observation. The typical exposure times of individual spectra were 500 s. We combined the spectra of each observation to create time-averaged spectra at a resolution of 0.1 Å. Further details of the data reduction and processing can be found in Froning et al. (2001).
3. SS Cygni at Outburst Peak and in Decline

The time-averaged spectrum of the first observation of SS Cyg, obtained at outburst peak, is shown in Fig. 1. The spectrum is dominated by interstellar lines of H I, molecular hydrogen, and metals. The interstellar H2 Werner and Lyman band transitions are indicated in Fig. 1. The only prominent feature from SS Cyg in the spectrum is a broad trough at the location of the Ly and O VI 1032,1038 Å lines.
We fit accretion disk model spectra to the spectrum shown in Fig. 1. The model spectra are constructed from weighted, summed stellar atmosphere spectra at the appropriate temperature and gravity for each disk annulus assuming a steady-state disk. The model atmosphere and spectral synthesis codes TLUSTY and SYNSPEC were used to construct the stellar spectra (Hubeny 1988; Hubeny, Lanz & Jeffery 1994). To the disk models, we added a rotating, biconical wind model using the Monte Carlo radiative transfer code, Python (Long & Knigge, these proceedings). A representative — not to be considered unique — fit to the spectrum at outburst peak is shown in Fig. 2. The mass accretion rate in the disk for the model shown is M⊙ yr-1 and the mass loss rate in the wind is M⊙ yr-1. The model is a good qualitative fit to the shape of the spectrum, although it under-predicts the flux for wavelengths 930 Å. It is unclear whether the deviation of model from data near the Lyman limit is caused by an additional flux source not represented in the model or by some missing element in the model physics.
The second observation, obtained five days after the first, has a similar spectrum, although the FUV flux dropped by 60% (at 1000 Å) between the observations. By the time the third observation was obtained, 8 days after the first and 10 days after outburst start, the FUV flux at 1000 Å was ergs cm-2 s-1 Å-1, down from ergs cm-2 s-1 Å-1 in the first observation and ergs cm-2 s-1 Å-1 in the second. In contrast to the earlier spectra, the FUV continuum is fairly flat in the third observation. Although still in absorption at blue wavelengths, the O VI line developed a sharp, red emission peak by the third observation. In addition, C III 977 Å, N III 990 Å, and C III 1176 Å appear strongly in emission.
In the final observation, obtained 13 days after outburst start and on the last day of the optical outburst, the FUV flux had declined to ergs cm-2 s-1 Å-1 (again at 1000 Å). The shape of the spectrum is similar to a HUT spectrum of SS Cyg in quiescence, although the 1000 Å flux is 40% higher in the FUSE spectrum. The dominant features are the C III, N III, and O VI emission lines, the latter now completely in emission. The FWHM of the features, 3600 km s-1 for the O VI doublet (assuming no Ly contribution to the feature) and 2500 km s-1 for the C III 1176 Å blend, are similar to those measured in the HUT spectrum, but the EWs are at least twice as large, and the line fluxes 4 times as large, as those in the quiescent HUT spectrum.
4. U Geminorum
Additional analysis of the FUSE FUV spectroscopy of U Gem in outburst can be found in Froning et al. (2001).
4.1. The Outburst Plateau

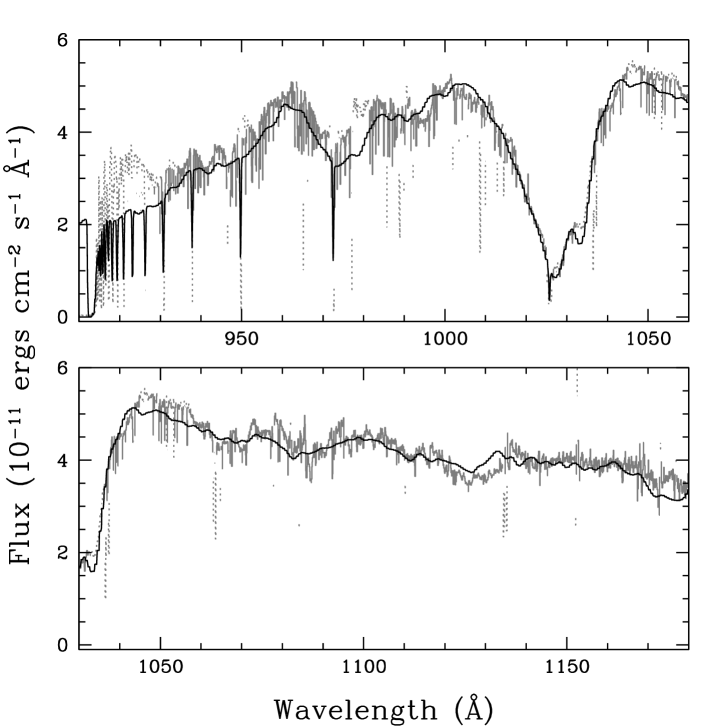
The first three observations of U Gem took place during the optical plateau phase of the outburst. The FUV continuum declined by 10% between the first and second observations and by 12% between the second and third observations. The continuum decline was gray. The time-averaged spectrum of the first observation is shown in Fig. 3. In contrast to the spectrum of SS Cyg, U Gem’s FUV spectrum is rich in features. The spectrum has narrow lines from interstellar absorption, but there are also numerous absorption lines from U Gem, including transitions of H I, He II, and metals in two to five times ionized states. With the exception of a weak bump to the red of O VI, there are no emission features in any of the spectra.
We fit accretion disk model spectra to the time-averaged spectrum of each plateau observation using the models presented in Section 3. We did not include a wind in the model because there is no sign of a strong wind in the FUV in U Gem (see below). Our best-fit model to the spectrum of the first observation has a mass accretion rate in the disk of M⊙ yr-1, close to values found for U Gem in previous outbursts (Panek & Holm 1984; Sion et al. 1997). Since the shape of the FUV spectrum didn’t change from observation to observation, the temperature and mass accretion rate in the disk remained steady while U Gem was on optical outburst plateau, although the effective emitting area of the disk dropped by 22% over the three observations. The FUV flux dropped before the optical flux did, indicating that the outburst decline was inside-out.
The accretion disk model provides a plausible fit to the shape of the FUV continuum in the three observations, although as with SS Cyg, the model under-predicts the observed flux at short wavelengths (960 Å). The boundary layer is known to be bright in U Gem in outburst from EUVE observations (Long et al. 1996) and may contribute to the FUV flux. Using parameters for the boundary layer from Long et al., we estimate that a 138,000 K blackbody with a size comparable to that of the WD would contribute 25% of the observed flux shown in Fig. 1 at 915 Å but only 13% at 1180 Å, indicating that boundary layer emission may contribute to the excess observed flux near the Lyman limit.
The absorption lines in the outburst plateau spectra are narrow, with FWHM ranging from 250 – 850 km s-1. They are also at low velocity, and while they move in phase with the WD over the binary orbit, at no time are they more than 700 km s-1 from their rest positions. Most of the absorption lines have smooth profiles and the line shapes and EWs at a given orbital phase are the same in all three observations. The O VI and S VI doublet flux ratios indicate that these lines are optically thick, but none of the absorption lines are dark in their line centers.
The O VI line behaves differently from the other lines in the spectrum. As noted above, the weak bump to the red of the doublet absorption is the only hint of emission in the FUV and may indicate the presence of a weak wind in U Gem in outburst, seen only in the most energetic FUV transition. This supposition is supported by the presence of narrow (FWHM 100 km s-1), blue-shifted ( km s-1) dips that appear sporadically in the O VI lines. These dips have also been seen in wind-formed lines of other CVs and X-ray binaries, although their origin is not yet understood (see, e.g., Hartley, Drew, & Long, these proceedings). Aside from this weak signature in O VI, the FUV absorption lines in U Gem are too narrow and insufficiently blueshifted to originate in a standard CV outflow. Wind lines are seen in the EUV spectrum of U Gem in outburst (Long et al. 1996), suggesting that the bulk of the wind may be highly ionized and mostly invisible in the FUV.
If the FUV lines (aside from O VI) do not originate in a standard wind, another source must be sought. The inner accretion disk, source of the FUV continuum, is not plausible, as the inner disk velocities — several thousand km s-1 — are much too large to be reconciled with the small line widths. The FUV absorption lines must originate at large disk radii if the absorbing region moves at Keplerian velocities. An outer disk origin is supported by the presence of orbital variability in the FUV lines. Between orbital phases 0.5 – 0.8 in all three plateau observations, the central depths of the absorption lines increase and several low ionization transitions of He II, C III, N III, Si III, and S III not seen at other phases appear. The increase in line absorption occurs at the same orbital phases as X-ray and EUV light curve dips observed in U Gem (Mason et al. 1988; Long et al. 1996; Szkody et al. 1996). The light curve dips are due to absorption of the central source by vertically extended material located at large disk radii. This material is believed to result from the interaction between the mass accretion stream and the accretion disk, either as a disk bulge or by the stream overflowing the disk.
The increase in the FUV line absorption occurs at the same orbital phases as the X-ray and EUV light curve dips, so it is reasonable to conclude that the same absorbing region is responsible for both effects. In that case, the FUV line spectrum in U Gem in outburst is caused by absorption by a vertically extended disk chromosphere with enhanced absorption at phases 0.5 – 0.8 from extra material tied to a disk bulge or stream overflow. A simple model for U Gem of a Keplerian, pure absorption chromosphere shows that material located from 20 – 60 WD radii with a scale height of cm can match the velocities and depths of the FUV absorption lines.
4.2. Late Outburst Decline

The final observation of U Gem was obtained two days before the return to optical quiescence. The time-averaged spectrum is shown in Fig. 4. The FUV continuum flux is a factor of 30 below that of the previous observation. The spectrum is very similar in shape to a HUT spectrum of U Gem obtained during early quiescence, which was well fit by white dwarf (WD) model spectra (Long et al. 1993). The similarity of the FUSE spectrum to the quiescent spectrum suggests that although the visible outburst was not over when the final FUSE observation took place, the accretion disk had fully faded in the FUV, exposing the WD. We fit model WD spectra to the time-averaged spectrum using TLUSTY and SYNSPEC. Our best fit model of a single temperature WD has a temperature TWD = 43,410 K, a gravity = 8.0, and a WD rotation rate of 200 km s-1. The model is a good qualitative fit to the spectrum. Most of the lines present in the data are also present in the model, and the shapes of the continuum and the lines are reasonably well reproduced by the model.
In quiescent observations of U Gem, the UV flux declines between outbursts (30% at 1400 Å; Kiplinger, Sion, & Szkody 1991; Long et al. 1994). WD models of the FUV spectra have shown that only a portion of the WD can cool during quiescence if the observed flux decline and the change in the WD temperature in the models are to be reconciled (Long et al. 1993). The FUV flux (at 1000 Å) in the FUSE late outburst spectrum is 30% higher again than the flux observed in early quiescence. A second temperature component on the WD is not required to reconcile the models to the observed fluxes in this case, as the 5000 K difference between the WD temperatures in the late outburst and the early quiescent models is consistent with the observed flux difference of 30% between those observations. The addition of a second temperature component to the model of the FUSE spectrum provides a slight statistical and qualitative improvement to the fit, however.
Models of the quiescent spectrum of U Gem have also indicated WD metal abundances that differ from solar; in particular, C is significantly sub-solar and N is super-solar, suggesting the presence of material on the WD surface that has undergone CNO processing (Sion et al. 1998, Long & Gilliland 1999). The FUSE spectra cover a different wavelength range than the previously modeled (HST) spectra and provide an independent check on the surface abundances of the WD. The WD models of the FUSE spectrum confirm the non-solar abundances on the WD in U Gem. The FUV spectrum contains a number of C lines that are significantly over-predicted by WD models at solar abundances and are better fit when the C abundance is of order 0.1 solar. Similarly, the numerous N lines in the FUSE spectrum are under-predicted by solar abundance WD models and are better fit when the N abundance is increased to several times solar. Fits to the other metal lines in the FUSE spectrum indicate no substantial deviations from solar.
Acknowledgments.
Based on observations with the NASA-CNES-CSA Far Ultraviolet Spectroscopic Explorer. FUSE is operated for NASA by the Johns Hopkins University under NASA contract NAS5-32985. We gratefully acknowledge the financial support of NASA through grant NAG5-9283. We wish to thank the AAVSO and its observers for notifying us of the outbursts of SS Cyg and U Gem and monitoring the progress of the outbursts. We also thank the FUSE staff for their heroic efforts in scheduling and conducting the observations.
References
Froning, C. S., Long, K. S., Drew, J. E., Knigge, C., & Proga, D. 2001, ApJ, accepted
Kiplinger, A. L., Sion, E. M., & Szkody, P. 1991, ApJ, 366, 569
Long, K. S. & Knigge, C. 2001, these proceedings
Long, K. S. & Gilliland, R. L. 1999, ApJ, 511, 916
Long, K. S., Mauche, C. W., Raymond, J. C., Szkody, P., & Mattei, J. A. 1996, ApJ, 469, 841
Long, K. S., Sion, E. M., Huang, M., & Szkody, P. 1994, ApJ, 424, L49
Long, K. S., Blair, W. P., Bowers, C. W., Davidsen, A. F., Kriss, G. A., Sion, E. M., & Hubeny, I. 1993, ApJ, 405, 427
Hartley, L., Drew, J. E., & Long, K. S. 2001, these proceedings
Hubeny, I., Lanz, T., & Jeffery, C. S. 1994, Newsletter on Analysis of Astronomical Spectra (St. Andrews: St. Andrews Univ.), 20, 30
Hubeny, I. 1988, Comput. Phys. Comm., 52, 103
Mason, K. O., Córdova, F. A., Watson, M. G., & King, A. R. 1988, MNRAS, 232, 779
Panek, R. J. & Holm, A. V. 1984, ApJ, 277, 700
Sion, E. M., Cheng, F. H., Szkody, P., Sparks, W., Gaensicke, B., Huang, M., & Mattei, J. 1998, ApJ, 496, 449
Sion, E. M., Cheng, F. H., Szkody, P., Huang, M., Provencal, J., Sparks, W., Abbott, B., Hubeny, I., Mattei, J., & Shipman, H. 1997, ApJ, 483, 907
Szkody, P., Long, K. S., Sion, E. M., & Raymond, J. C. 1996, ApJ, 469, 834