11email: wkollat@uni-sw.gwdg.de 22institutetext: Department of Astronomy and McDonald Observatory, University of Texas at Austin, Austin, TX 78712, USA 33institutetext: Department of Astronomy, San Diego State University, San Diego, CA 92182, USA
Short-term emission line and continuum variations in Mrk 110
We present results of a variability campaign of Mrk 110 performed with the 9.2-m Hobby-Eberly Telescope (HET) at McDonald Observatory. The high S/N spectra cover most of the optical range. They were taken from 1999 November through 2000 May. The average interval between the observations was 7.3 days and the median interval was only 3.0 days. Mrk 110 is a narrow-line Seyfert 1 galaxy. During our campaign the continuum flux was in a historically low stage. Considering the delays of the emission lines with respect to the continuum variations we could verify an ionization stratification of the BLR. We derived virial masses of the central black hole from the radial distances of the different emission lines and from their widths. The calculated central masses agree within 20%. Furthermore, we identified optical He i singlet emission lines emitted in the broad-line region. The observed line fluxes agree with theoretical predictions. We show that a broad wing on the red side of the [O iii]5007 line is caused by the He i singlet line at 5016 Å.
Key Words.:
Line: identification – Galaxies: Seyfert – Galaxies: individual: Mrk 110 – (Galaxies:) quasars: emission lines1 Introduction
The variability of the continuum and broad emission lines in Seyfert 1 galaxies was detected more than 20 years ago. The delay of the line intensity variations with respect to the varying ionizing continuum yields information on the extent and structure of the innermost broad-line region (BLR) in AGN. During the past 10 to 15 years international collaborations or individual groups studied the optical variations of more than half a dozen of Seyfert galaxies such as e.g. NGC 5548 (International AGN Watch – Peterson et al. peterson94 (1994)), NGC4151 (Wise observatory group – Maoz et al. maoz91 (1991)) and NGC 4593 (LAG collaboration – Robinson robinson94 (1994); Kollatschny & Dietrich kollatschny97 (1997)). The main difficulties encountered by these campaigns have been the inhomogeneity of the observed spectra and the required high S/N of the data. Furthermore the campaigns must extend over time-scales of many months to years with dense temporal sampling of days to weeks.
In this paper we discuss high S/N spectra of the narrow-line Seyfert galaxy Mrk 110 resulting from a variability campaign with the 9.2-m Hobby-Eberly Telescope. It has been shown before that this galaxy shows extreme variability amplitudes (Peterson et al. peterson98 (1998), Bischoff & Kollatschny bischoff99 (1999)) on time scales of weeks to months. This new campaign improves upon the past studies of this galaxy with respect to homogeneity of the data, S/N ratio of the spectra, temporal sampling and coverage of the optical spectral range. Furthermore, the present data allow the determination of the central black hole mass with high precision by using the variations of many different emission lines.
The strongest forbidden lines in optical AGN spectra are the lines of [O iii]4959,5007. Meyers & Peterson (meyers85 (1985)), van Groningen & de Bruyn (groningen89 (1989)), Osterbrock (osterbrock85 (1985)), and others have detected a broad feature on the red wing of the [O iii]5007 line in a significant number of Seyfert galaxies. Meyers & Peterson (meyers85 (1985)) and van Groningen & de Bruyn (groningen89 (1989)) ruled out the possibility that the wing was caused by broad Fe ii blends or the He i5016 singlet line, and designated the wing as [O iii] from the broad-line region (BLR) in the AGN. A clear confirmation of this identification would have important consequences for the determination of gas density in the BLR. A search for an identical broad wing on the red side of [O iii]4959 in high S/N spectra would test this idea, but to date no such wing has been seen.
2 Observations and data reduction
We obtained 26 spectra of Mrk 110 with the 9.2-m Hobby-Eberly Telescope (HET) at McDonald Observatory between 1999 November 13 and 2000 May 14. Table 1 lists the observing dates.
| Julian Date | UT Date | Exp. time |
|---|---|---|
| 2 400 000+ | [sec.] | |
| 51495.94 | 1999-11-13 | 1200 |
| 51497.91 | 1999-11-15 | 1200 |
| 51500.91 | 1999-11-18 | 1200 |
| 51518.89 | 1999-12-06 | 1200 |
| 51520.87 | 1999-12-08 | 1200 |
| 51522.88 | 1999-12-10 | 1200 |
| 51525.84 | 1999-12-13 | 1200 |
| 51528.84 | 1999-12-16 | 1200 |
| 51547.80 | 2000-01-04 | 1200 |
| 51584.72 | 2000-02-10 | 1200 |
| 51586.71 | 2000-02-12 | 1200 |
| 51595.88 | 2000-02-21 | 1200 |
| 51598.86 | 2000-02-24 | 1200 |
| 51605.83 | 2000-03-02 | 1200 |
| 51608.62 | 2000-03-05 | 1200 |
| 51611.62 | 2000-03-08 | 1200 |
| 51614.63 | 2000-03-11 | 1200 |
| 51629.76 | 2000-03-26 | 540 |
| 51637.77 | 2000-04-03 | 600 |
| 51645.73 | 2000-04-11 | 600 |
| 51658.70 | 2000-04-24 | 600 |
| 51663.68 | 2000-04-29 | 540 |
| 51664.66 | 2000-04-30 | 600 |
| 51670.70 | 2000-05-06 | 360 |
| 51673.69 | 2000-05-09 | 570 |
| 51678.64 | 2000-05-14 | 600 |
The 26 spectra were obtained over a period of 182.7 days. The average interval between the observations was 7.3 days and the median interval was only 3.0 days.
All observations were made under identical instrumental conditions with the Marcario Low Resolution Spectrograph (LRS) (Hill et al. hill98 (1998), Cobos et al. cobos98 (1998)) located at the prime focus. We used a Ford Aerospace 3072x1024 CCD with 15 m pixel in 2x2 binning. The slit width was fixed to 2″. 0 projected on the sky, and the position angle of the slit was set to PA=45° throughout the campaign. The spatial resolution corresponds to 0.472″per binned pixel. We extracted our object spectra over 7 pixels, corresponding to 3.3″. The resolving power was 650 and the spectra cover the wavelength range from 4200 Å to 6900 Å in the rest frame of the galaxy. The majority of the observations were comprised of two 10 minute integrations, which in most cases yielded a S/N 100 per pixel in the continuum.
HgCdZn and Ne spectra were taken after each object exposure for wavelength calibration. Spectra of different standard stars were observed for flux calibration. The reduction of the spectra (bias subtraction, cosmic ray correction, flat-field correction, 2D-wavelength calibration, night sky subtraction, flux calibration etc.) was done in a homogeneous way with IRAF reduction packages. The spectra have not been corrected for atmospheric absorption in the B band.
Great care was taken to produce good intensity and wavelength calibrations. All spectra were calibrated to the same absolute [O iii]5007 flux of 2.26 erg s-1 cm-2 (Bischoff & Kollatschny bischoff99 (1999), Peterson et al. peterson98 (1998)). The spatially unresolved structure of the narrow-line region in Mrk 110 has been verified before (e.g. Bischoff & Kollatschny bischoff99 (1999)) for utilizing this internal calibration method. The accuracy of the [O iii]5007 flux calibration was tested on all forbidden emission lines in the spectra. We calculated difference spectra of all epochs with respect to the mean spectrum of our variability campaign. Corrections for small spectral shifts ( 0.5 Å) and for small scaling factors were executed by minimizing the residuals of the narrow emission lines in the difference spectra. All wavelengths were converted to the rest frame of the galaxy (z=0.0355). We obtained a relative flux accuracy of better than 1% in most of our spectra.
3 Results and discussion
3.1 Line and continuum variations
Rest frame spectra of Mrk 110 obtained during our new campaign are shown in Fig. 1. The strongest broad emission lines are labeled.
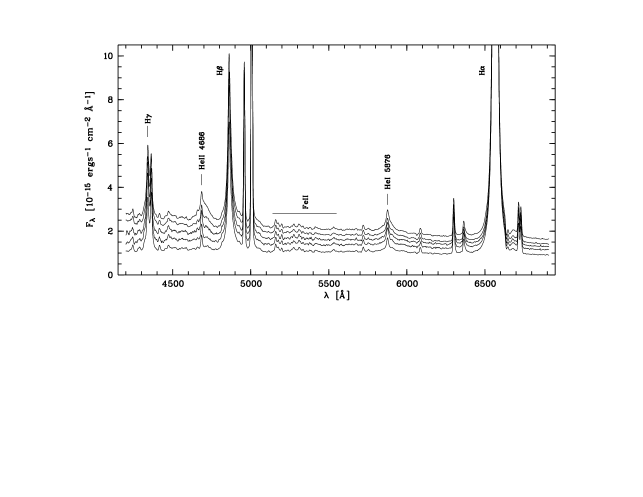
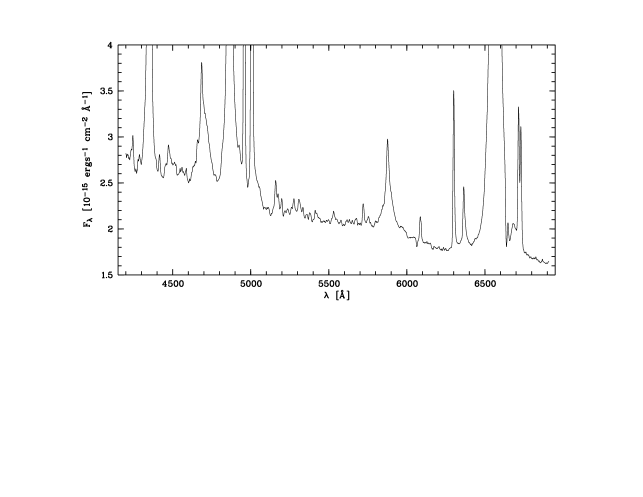
The continuum variations, the variations of the continuum gradient, and the variations of the broad He ii line are obvious. On the other hand the Fe ii multiplet lines remained constant. In Fig. 2 an individual spectrum is plotted emphasizing the weak lines.
The wavelength boundaries we used for our continuum measurements are given in Table 2.
| Cont./Line | Wavelength range | Pseudo-continuum |
|---|---|---|
| (1) | (2) | (3) |
| Cont. 4265 | 4260 Å – 4270 Å | |
| Cont. 5135 | 5130 Å – 5140 Å | |
| Cont. 6895 | 6890 Å – 6900 Å | |
| H | 4300 Å – 4400 Å | 4270 Å – 4430 Å |
| HeI | 4435 Å – 4535 Å | 4435 Å – 4535 Å |
| HeII | 4600 Å – 4790 Å | 4600 Å – 5130 Å |
| H | 4790 Å – 4940 Å | 4600 Å – 5130 Å |
| HeI | 4980 Å – 5090 Å | 4600 Å – 5130 Å |
| HeI | 5785 Å – 6025 Å | 5650 Å – 6120 Å |
| H | 6420 Å – 6700 Å | 6260 Å – 6780 Å |
These regions are free of strong emission and/or absorption lines. The broad emission line intensities were integrated between the listed limits after subtraction of a linear pseudo-continuum defined by the boundaries given in Column (3).
The results of the continuum and line intensity measurements are given in Table 3. We determined the line intensities with respect to the mean spectrum of Mrk 110 (Fig. 5). Thus the measurement of the pseudo-continuum is not hurt by the presence of any underlying absorption lines from the host galaxy or any constant emission lines. But one has to keep in mind that the line fluxes given in Table 3 still contain the narrow-line components within the listed wavelength boundaries. Thus the true fractional variability amplitudes of the broad lines are larger than those listed in Table 4. The errors given in Table 3 are the internal errors of our measurements with respect to the mean spectrum. A few spectra are of lower quality because of poorer transparency due to clouds.
The light curves of the continuum flux at 5135 Å and of the integrated Balmer and Helium emission line intensities are shown in Fig. 3.
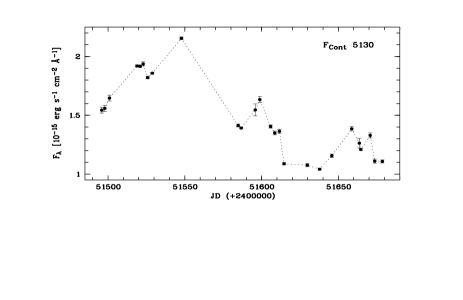
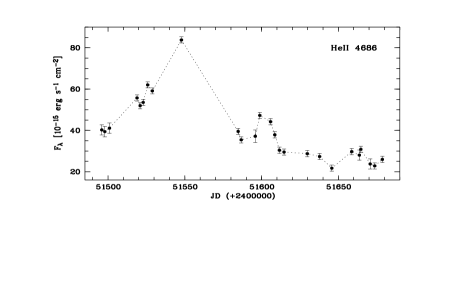
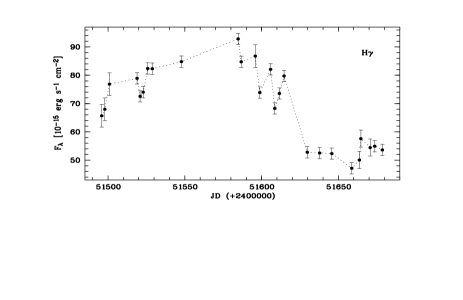

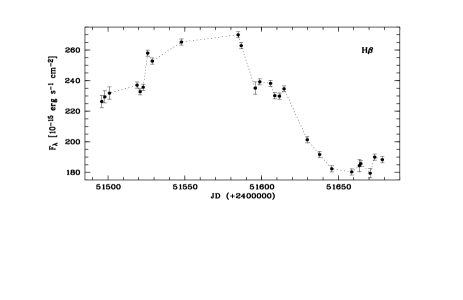
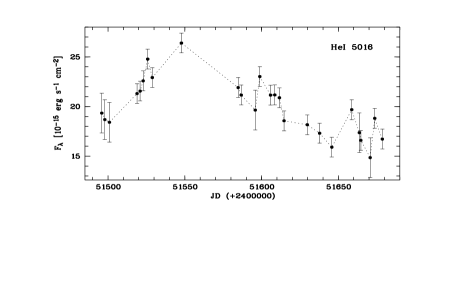
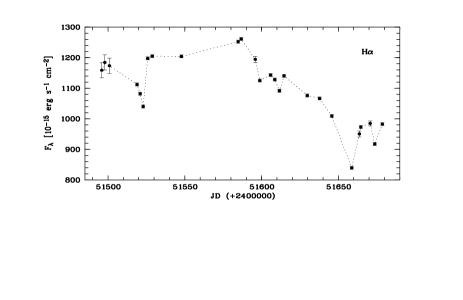

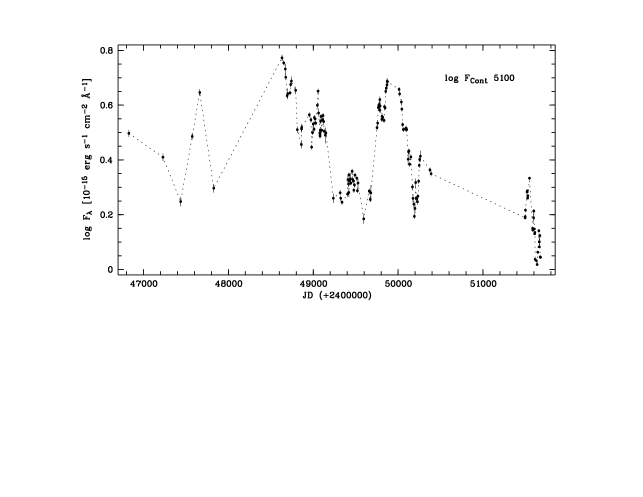
Fig. 4 shows the logarithm of the long-term continuum variations of Mrk 110 from 1987 February until 2000 May. The data are taken from Bischoff & Kollatschny (bischoff99 (1999)), Peterson et al. (peterson98 (1998)), this paper and from a newly reduced data point at JD 2 448 793. Besides the long-term behaviour of the continuum and the strong variations at certain epochs one can recognize immediately that Mrk 110 was in a very low state during the HET variability campaign (after JD 2 451 500). In 2000 March/April the continuum was at a historical low.
| Cont./Line | Fmin | Fmax | Rmax | F | Fvar | |
|---|---|---|---|---|---|---|
| (1) | (2) | (3) | (4) | (5) | (6) | (7) |
| Cont. 4265 | 1.07 | 2.63 | 2.46 | 1.66 | 0.451 | 0.270 |
| Cont. 5135 | 1.04 | 2.16 | 2.07 | 1.47 | 0.314 | 0.213 |
| Cont. 6895 | 0.91 | 1.63 | 1.79 | 1.18 | 0.193 | 0.163 |
| HeII | 21.7 | 83.8 | 3.86 | 39.5 | 14.6 | 0.368 |
| HeI | 8.46 | 14.4 | 1.70 | 11.2 | 1.70 | 0.099 |
| HeI | 14.9 | 26.4 | 1.78 | 20.0 | 2.77 | 0.123 |
| HeI | 29.5 | 54.4 | 1.85 | 41.9 | 7.56 | 0.175 |
| H | 47.2 | 92.9 | 1.97 | 69.3 | 13.7 | 0.194 |
| H | 179. | 270. | 1.51 | 223. | 29.1 | 0.130 |
| H | 840. | 1261. | 1.50 | 1096. | 108. | 0.098 |
Continuum flux in units of
10-15 erg sec-1 cm-2 Å-1.
Line flux in units of 10-15 erg sec-1 cm
In Table 4 we list statistics of the continuum and emission line variations. Given are the minimum and maximum fluxes Fmin and Fmax, peak-to-peak amplitudes Rmax = Fmax/Fmin, the mean flux over the period of observations F, the standard deviation , and the fractional variation
as defined by Rodríguez-Pascual et al. (rodriguez97 (1997)).
The variability amplitude of the continuum flux in this campaign was about one half of the variations over the past ten years (see Fig. 4). The same trend is seen in the variability amplitudes of all emission line fluxes. The extreme variability amplitudes of Mrk 110 compared to other galaxies have been mentioned before (Bischoff & Kollatschny, bischoff99 (1999)). The variability amplitude of the blue continuum flux is stronger than that of the red continuum, both in a relative and in an absolute flux sense (Table 4, Columns 4,7).
3.2 Mean and rms spectra
The mean rest frame spectrum of Mrk 110 is shown in Fig. 5 with two different vertical scalings to show both strong and weak lines.
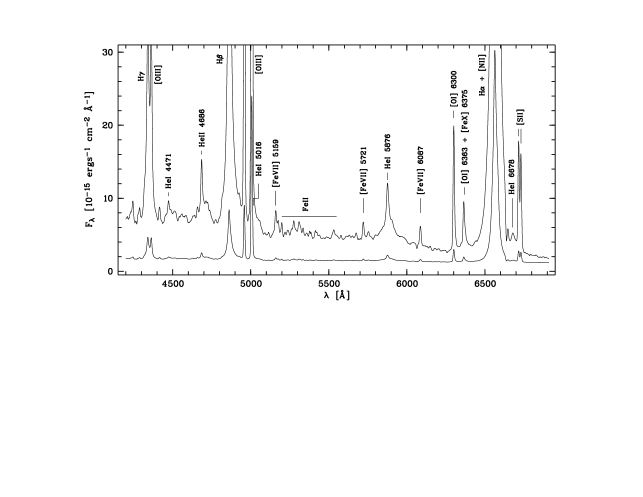
This spectrum has been derived from spectra obtained at 24 epochs. Two of the 26 spectra (2000 February 21 and April 30) are not included in the average because of a lower S/N and poor wavelength calibration, respectively. The Balmer and some He emission lines are labeled. One can clearly identify individual Fe ii lines in the Fe ii5200 blend.
The mean spectrum contains heavily blended Fe ii lines. We subtracted a scaled Fe ii template spectrum to estimate the contribution of these lines and to identify further weak lines. This Fe ii template spectrum has been derived from the PG quasar sample (Boroson & Green boroson92 (1992)). We used the Fe ii5198, 5276 and 5535 lines of multiplets 49, 48 and 55 to scale the template spectrum and broadened our Mrk 110 spectrum slightly with a Gaussian. In Fig. 6 our broadened Mrk 110 spectrum is shown in the middle. The scaled Fe ii template spectrum is shown at the bottom. The Fe ii subtracted spectrum is plotted at the top.
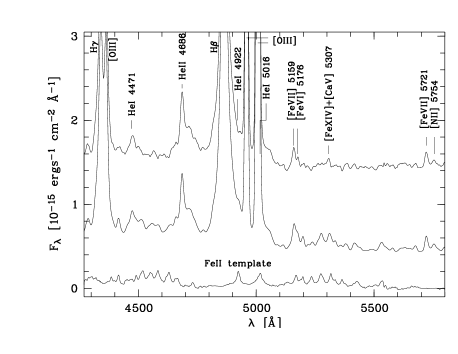
Some highly ionized [Fe vi], [Fe vii] and [Fe xiv] lines clearly stick out in the Fe ii subtracted spectrum. The line strengths are similar to their strengths in IIIZw 77. This AGN has been classified by Osterbrock (osterbrock81 (1981)) as an unusual, high-ionization Seyfert 1 galaxy. The He i line is also clearly revealed once the underlying Fe ii emission is subtracted. Notice the broad wing on the red side of the narrow [O iii]5007 line remains nearly the same before and after Fe ii subtraction. Therefore, this line feature cannot be attributed to Fe ii line blends.
Fig. 7 shows the rms spectrum of Mrk 110 derived from the same 24 epochs as the mean spectrum, with two different scalings.
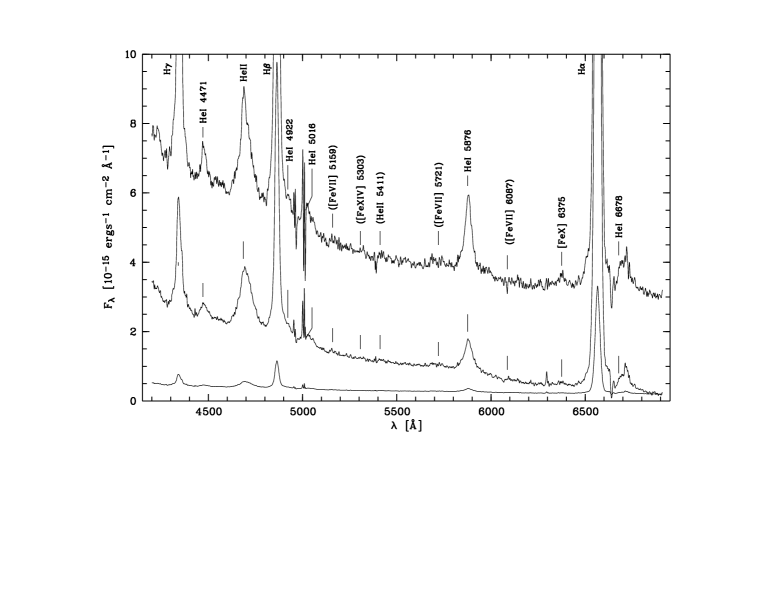
The rms spectrum enhances the variable parts of the spectrum. Lines with constant flux and profile, such as the [O iii] lines, disappear in the rms spectrum. But the rms spectrum amplifies noise as well as small inaccuracies in the wavelength and flux calibration, producing sharp, high frequency artifacts. This can be seen in the very strong [O iii]5007,4959 lines.
The rms spectrum clearly shows the H, H, and H Balmer lines, the broad He ii line and the He i lines at , , , and . The flux of the He i and He i lines can be determined by subtracting the blue side of the Balmer profiles from the red one after flipping the profile around their central wavelengths. The He i line is heavily blended by atmospheric B-band absorption and therefore must be treated with caution. But the proof of identity has been shown in the mean spectrum independently.
In Fig. 7 (top) we also show the difference between the mean high stage spectrum and the mean low stage spectrum as an additional test of line variability. The mean high stage spectrum has been deduced from all spectra obtained from 1999 Dec. through 2000 March 11, and the mean low stage spectrum from all spectra from 2000 March 26 through the end of the campaign in 2000 May. Again we did not consider the lower quality spectra taken at 2000 Feb. 21 and April 3. One can unambiguously identify the same lines as in the rms spectrum including the variable [Fe x] line. Furthermore, in the difference spectra of our long-term variability campaign it was to be seen (Bischoff & Kollatschny bischoff99 (1999), Fig. 3) that the [Fe x] line is variable. For completeness we indicate in Fig. 7 the positions of other highly ionized Fe species. There is marginal evidence for variability in [Fe vii], but the S/N is too low to make any claims regarding the [Fe xiv] line. It should be emphasized that the forbidden [Fe x] line is variable in Mrk 110 while the permitted Fe ii line blends remained constant. The [Fe x] line and the Fe ii lines show the same intensity in the mean spectrum.
The variability behaviour of the Fe ii line blends in Seyfert galaxies is still poorly understood. In some Seyfert 1 galaxies the optical Fe ii line blends are variable while in other galaxies no variations could be detected (Kollatschny et al. kollatschny00 (2000), Kollatschny & Welsh kollatschny01 (2001)). There is evidence suggesting that the variability amplitude of optical Fe ii line blends in Seyfert 1 galaxies might be correlated with the emission line widths. This might be an optical depth or obscurational effect, but this deserves considerably more detailed investigation.
In Table 5 we list observed line ratios of the He i singlet lines at , , and as well as of the triplet lines at and .
| Line | Obs. flux ratio | Theor. flux ratio |
|---|---|---|
| (1) | (2) | (3) |
| He i / | 0.41 0.2 | 0.45 |
| He i / | 1.36 0.6 | 1.33 |
| He i / | 3.6 0.3 | 2.97 |
| He i / | 1.1 0.4 | 0.58 |
The line ratios have been determined from the rms spectrum (Fig. 7). The individual rms line intensities have errors of 5 to 40%. The intrinsic line ratio He i/ might be lower by 10–20% than the observed one due to the fact that the He i line is blended with the He i line. The rms spectrum is free of contamination of the constant narrow emission lines and Fe ii line blends. Analysis of the difference spectrum (Fig. 7) yields the same results within the errors. In the mean spectrum of Mkn 110 (Fig. 5) we could measure only the He i to He i line ratio. It agrees with that of the rms spectrum. Therefore it seems reliable that the mean to rms line ratios of the other He i lines show the same behavior.
Theoretical He i line ratios are listed in Table 5 column (3) for T = 10,000 K and = (Benjamin et al. benjamin99 (1999)). There are discrepancies of 30–40% between theory and observations. Much of this discrepancy might be attributed to the low density of the model calculations. The density in the broad-line region of Mrk 110 might be 2-3 orders of magnitude higher.
The strong He emission detected in Mrk 110 is similar to the strong He emission seen in other accretion–powered sources, such as the cataclysmic variables and X-ray binaries (e.g. Warner warner95 (1995)).
Further weak features in the rms spectrum could be attributed to He i, He ii and highly ionized [Fe ] lines. But a detailed investigation of these lines is beyond the scope of this paper.
3.3 The [O iii]5007 wing
The mean spectrum of Mrk 110 (Fig. 5) shows broad extended emission on the red side of the [O iii]5007 line. A thorough analysis of this spectral feature is important since forbidden line emission of [O iii]5007 from the BLR would allow a more definite determination of gas density in this region.
In principle there are four possibilities to explain this broad emission:
-
1.
underlying Fe ii line blends
-
2.
a strong extended red wing of the H line
-
3.
a broad red wing of the [O iii]5007 line
-
4.
unresolved weak, narrow, forbidden lines or contribution from few weak, broad, permitted emission lines
The broad emission cannot be due to Fe ii line blends because the feature remained present after subtraction of the scaled Fe ii template spectrum (Fig. 6). Furthermore, the Fe ii lines did not vary during our observations and disappear in the rms-spectrum, but the broad wing on the [O iii]5007 line is present in the rms spectrum (Fig. 7).
Sometimes a broad wing on the red side of the [O iii]5007 line has been assigned to a very broad red H wing as e.g. in Akn 120 (Kollatschny et al. kollatschny81 (1981), Meyers & Peterson meyers85 (1985) and references therein). This possibility can be ruled out because the line is relatively narrow. The broad component on the red side of [O iii]5007 is clearly separated from H.
The feature can not be a broad red wing of the [O iii]5007 line since there is no corresponding blue wing. Furthermore, the [O iii]4959 and [O iii]4363 lines do not have these wings (Fig. 7).
The feature cannot be due to constant NLR emission because these lines would cancel out in the rms spectrum. The most likely explanation is that the feature is due to broad He i emission.
The He i line has been verified in some other high S/N spectra of Seyfert galaxies (Filippenko & Sargent filip85 (1985)). The He i line is more easily detected in the rms spectrum because it is blended with [O iii] and the [O iii] line cancels out in the rms spectrum. Indeed, there are indications in the published rms spectra of Seyfert galaxies indicating existing broad He i line emission as e.g. in 3C 120, Mrk 335, Mrk 590 and Mrk 817 (Peterson peterson98 (1998)).
In the next section we will demonstrate that all He i lines (including He i) are delayed by 10 – 15 light days with respect to continuum variations. This is a further demonstration that the red shoulder of the [O iii] line is caused by He i emission.
3.4 CCF analysis and virial mass estimation of the central black hole
The size and structure of a broad-line region in AGN can be estimated from the cross-correlation function (CCF) of the light curve of the ionizing continuum flux with the light curves of the variable broad emission lines.
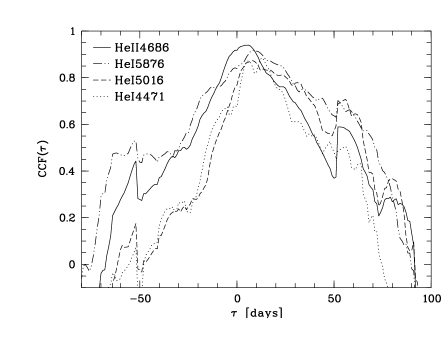
We cross-correlated the 5100 Å continuum light curve with all our emission line light curves (Fig. 3) using an interpolation cross-correlation function method (ICCF) described by Gaskell & Peterson (gaskell87 (1987)). The cross-correlation functions of the Balmer lines (H, H, and H) are plotted in Fig. 8, those of HeII4686, HeI5876, HeI5016 and HeI4471 in Fig. 9.

The average interval between the observations was 7.3 days, the median interval was 3.0 days. The strong variability amplitudes in the continuum flux and in the emission line intensities on time scales of weeks to months point to a very good sampling of the light curves.
We estimated the uncertainties in the cross-correlation results by calculating the cross-correlation lags a large number of times adding random noise to our measured flux values as suggested by Peterson et al. (1998b ). Furthermore, the sampling uncertainties were estimated by considering different subsets of our light curves and repeating the cross-correlation calculations. Typically we excluded 33% of our spectra from the data set. Finally we determined the error of the lags by averaging and computing the standard deviation of the distribution of centroid values. Centroids of the CCF, , were calculated using only the part of the CCF above 85% of the peak value. While determining accurate errors in CCF lags is difficult (e.g. see Welsh welsh99 (1999)), the method we employed based on Peterson et al. (1998b ) should provide fairly reliable error estimates.
In Table 6 we list our final cross-correlation results.
| Line | |
|---|---|
| [days] | |
| (1) | (2) |
| HeII | |
| HeI | |
| HeI | |
| HeI | |
| H | |
| H | |
| H |
Also, we calculated the cross-correlation lags of the Balmer lines against each other, and for the HeI lines as well. All three HeI lines show no internal lags within the uncertainties. The same holds for H and H. But the H light curve is delayed with respect to the H light curve by days. The same trend is seen in other Seyfert galaxies: the H rms line width is narrower than that of H (e.g. NGC 4593 (Kollatschny & Dietrich kollatschny97 (1997))) and/or the H response lags behind H (e.g. NGC 3516 (Robinson robinson94 (1994))). Calculations of the response functions for the broad emission lines in AGN show that the H line lags H in most models (O’Brien et al. obrien94 (1994)).
The different delays of the HeII and HeI lines indicate an ionization stratification structure of the BLR as seen in e.g. NGC 5548 before (e.g. Clavel et al. clavel91 (1991)). The fact that the HeI lines originate closer to the central source than the Balmer lines suggests a density stratification in the BLR as well. Again the model calculations of O’Brien et al. (obrien94 (1994)) confirm the observed structures in the BLR.
All cross-correlation lags of our present variability campaign are smaller by a factor of two than those determined for our long-term variability campaign from 1987 through 1995 (Bischoff & Kollatschny bischoff99 (1999)): The H lag is now days instead of days. While this is formally only 1.7 discrepancy, we believe the difference to be real for the following reason: It has been shown before as part of the NGC 5548 variability campaign that the characteristic radius of the BLR derived from the cross-correlation function depends on the duration and strength of the continuum outburst (Dietrich & Kollatschny dietrich95 (1995)). During this HET variability campaign the luminosity of Mrk 110 was in a all time low stage (see Fig. 4). Therefore, the radius of the BLR is likely to be smaller than the long-term radius.
It is possible to estimate the central mass in Mrk 110 from the width of the broad emission line profiles (FWHM) under the assumption that the gas dynamics are dominated by the central massive object:
We presume that the characteristic velocity of the emission line region is given by the FWHM of the rms profile and the characteristic distance R is given by the centroid of the corresponding cross-correlation function (e.g. Koratkar & Gaskell koratkar91 (1991), Kollatschny & Dietrich kollatschny97 (1997)).
In Table 7 we list our virial mass estimations of the central massive object in Mrk 110.
| Line | FWHM(rms) | |
|---|---|---|
| [km s-1] | [] | |
| (1) | (2) | (3) |
| HeII | 4444. 200. | |
| HeI | 2404. 100. | |
| H | 1515. 100. | |
| H | 1315. 100. | |
| mean |
The best value considering all lines is
The virial mass estimations derived independently from the different emission lines agree within of 20% with each other showing that uncertainties in our line measurements of this variability campaign a relatively small.
Peterson et al. (peterson98 (1998)) computed cross correlation lags of 31.6 days (entire data set of 95 observations) and 19.5 days (best subset of 14 observations only) for their Mrk 110 variability campaign of H. Their sampling was slightly worse than ours. They obtained a virial mass of (H delay: 19.5 days, FWHM(H): 2500 km s-1). By correcting the FWHM of H to 1670 km s-1 Wandel, Peterson, & Malkan (wandel99 (1999)) computed a virial mass of . Their revised virial mass of is in good agreement with our H virial mass of , especially considering that our formula for computing the virial mass of the central object yields masses that are systematically higher by a factor of two. But one has to keep in mind that the derived central mass assumes the very simple formula given above and systematic errors as large as factors of several are possible. Errors in echo mapping masses (e.g. Krolik krolik01 (2001)) due to projection and/or geometry effects are not considered in this first order approximation.
4 Conclusion
We obtained very high S/N spectra with dense temporal sampling during our variability campaign of the narrow-line Seyfert 1 galaxy Mrk 110. The homogeneous data set was obtained under identical instrumental conditions. The central continuum flux was in a historically low stage during our observing campaign.
The main results of the present paper can be summarized as follows.
-
1.
Considering the delays of the emission lines with respect to the continuum variations we verified an ionization stratification in the BLR. The HeII line originates at a distance of 3.9 light days from the central ionizing source, the HeI lines at distances of 10–14 light days, and H and H at different distances of 24.2 and 32.3 light days respectively.
-
2.
The forbidden [Fe x] line was variable in Mrk 110 while the permitted Fe ii line blends remained constant.
-
3.
We have shown that the broad red wing of the [O iii]5007 line is caused by the He i line only. The observed relative intensities of the He i lines in Mrk 110 agree with theoretical model calculations.
-
4.
We derived virial masses of the central black hole from the radial distances of different emission lines and their line widths. The calculated central masses agree within 20%. We determined a central mass of
Acknowledgements.
WK thanks the UT Astronomy Department for warm hospitality during his visit. We thank the Resident Astronomers Matthew Shetrone and Grant Hill and the HET staff. The Marcario Low Resolution Spectrograph is a joint project of the Hobby-Eberly Telescope partnership and the Instituto de Astronomia de la Universidad Nacional Autonoma de Mexico. Part of this work has been supported by the Deutsche Forschungsgemeinschaft, DFG grant KO 857/24 and DARA, and also the National Science Foundation under Grants AST-0086692 and INT-0049045.References
- (1) Benjamin, R.A., Skillman, E.D. & Smiths, D.P. 1999, ApJ, 514, 307
- (2) Bischoff, K.,& Kollatschny, W. 1999, A&A, 345, 49
- (3) Boroson, T.A.,& Green, R.F. 1992, ApJS, 80, 109
- (4) Clavel J., Reichert G.A., Alloin D., et al., 1991, ApJ, 366, 64
- (5) Cobos Duenas, F.J., Tejada, C., Hill, G.J., & Perez G.,F. 1998, ”Hobby-Eberly Telescope low-resolution spectrograph: optical design”, Proc. SPIE, 3355, 424
- (6) Dietrich, M.,& Kollatschny, W. 1995, A&A, 303, 405
- (7) Filippenko, A.V.,& Sargent, W.L.W. 1985 ApJS, 57, 503
- (8) Gaskell C.M., Peterson B.M. 1987, ApJS, 65, 1
- (9) van Groningen, E., de Bruyn, A.G. 1989, A&A, 211, 293
- (10) Hill, G.J., Nicklas, H.E., MacQueen, P.J., Tejada, C., Cobos Duenas, F.J.,& Mitsch, W. 1998, ”Hobby-Eberly Telescope low-resolution spectrograph”, Proc. SPIE, 3355, 375
- (11) Kollatschny, W., et al. 1981, A&A, 104, 198
- (12) Kollatschny, W.,& Dietrich, M. 1997, A&A, 323, 5
- (13) Kollatschny, W., Bischoff, K., & Dietrich, M. 2000, A&A, 361, 901
- (14) Kollatschny, W.,& Welsh, W.F. 2001, in ASP Conf. Ser. 224, Probing the Physics of Active Galactic Nuclei by Multiwavelength Monitoring, eds. B.M. Peterson et al., p. 449
- (15) Koratkar, A., Gaskell, M. 1991, ApJ 370, L61
- (16) Krolik, J.H. 2001, ApJ 551, 72
- (17) Maoz, D., Netzer, H., Mazeh, T., et al. 1991, ApJ 367, 493
- (18) Meyers, K.A., Peterson, B.M. 1985, PASP 97, 734
- (19) O’Brien, P.T., Goad, M.R., Gondhalekar, P.M. 1994, MNRAS 268, 845
- (20) Osterbrock, D.E. 1981, ApJ 246, 696
- (21) Osterbrock, D.E. 1985, in: Astrophysics of Active Galaxies and Quasi-Stellar Objects, J.S. Miller (ed.), University Science Books, 111
- (22) Peterson, B.M., Berlind, B., Bertram, R., et al. 1994, ApJ 425, 622
- (23) Peterson, B.M., Wanders, I., Bertram, R., et al. 1998, ApJ 501, 82 (erratum 511, 513)
- (24) Peterson, B.M., Wanders, I., Horne, K., et al. 1998b, PASP, 110, 660
- (25) Robinson A., 1994, The LAG Spectroscopic Monitoring Campaign: An Overview. In: Gondhalekar P.M., Horne K., Peterson B.M. (eds.) Reverberation Mapping of the Broad-Line Region in Active Galactic Nuclei, ASP Conf. Ser. 69, San Francisco, p. 147
- (26) Rodríguez-Pascual P.M., Alloin D., Clavel J., et al., 1997, ApJS 110, 9
- (27) Warner, B. 1995, Cataclysmic Variables Stars, Cambridge University Press
- (28) Wandel, A., Peterson, B.M., Malkan, M.A. 1999, ApJ 526, 579
- (29) Welsh, W.F. 1999, PASP 111, 1347
| Julian Date | 5100 Å | H | H | H | HeII | HeI | HeI | HeI | |
|---|---|---|---|---|---|---|---|---|---|
| 2 400 000+ | |||||||||
| (1) | (2) | (3) | (4) | (5) | (6) | (7) | (8) | (9) | |
| 51495.94 | 1.544 0.025 | 1158.8 25. | 226.4 4. | 65.67 4. | 40.24 2.5 | 49.38 3.0 | 19.34 2.0 | 10.38 1.5 | |
| 51497.91 | 1.559 0.025 | 1184.6 25. | 229.4 4. | 67.97 4. | 39.42 2.5 | 46.87 3.0 | 18.69 2.0 | 8.83 1.5 | |
| 51500.91 | 1.646 0.025 | 1173.6 25. | 231.8 4. | 76.86 4. | 41.09 2.5 | 49.50 3.0 | 18.41 2.0 | 10.60 1.5 | |
| 51518.89 | 1.920 0.010 | 1112.2 5. | 237.0 2. | 78.89 2. | 55.72 1.5 | 47.59 1.5 | 21.31 1.0 | 12.84 1.0 | |
| 51520.87 | 1.917 0.011 | 1082.1 5. | 232.7 2. | 72.55 2. | 51.98 1.5 | 46.66 1.5 | 21.56 1.0 | 12.38 1.0 | |
| 51522.88 | 1.937 0.018 | 1040.2 5. | 235.6 2. | 74.01 2. | 53.54 1.5 | 46.55 1.5 | 22.59 1.0 | 12.34 1.0 | |
| 51525.84 | 1.821 0.012 | 1197.6 5. | 258.0 2. | 82.39 2. | 62.04 1.5 | 52.20 1.5 | 24.78 1.0 | 14.38 1.0 | |
| 51528.84 | 1.858 0.008 | 1205.2 5. | 252.7 2. | 82.30 2. | 59.13 1.5 | 53.08 1.5 | 22.92 1.0 | 13.44 1.0 | |
| 51547.80 | 2.155 0.011 | 1204.2 5. | 265.2 2. | 84.79 2. | 83.81 1.5 | 54.39 1.5 | 26.40 1.0 | 14.06 1.0 | |
| 51584.72 | 1.413 0.013 | 1252.4 5. | 270.0 2. | 92.85 2. | 39.50 1.5 | 45.21 1.5 | 21.91 1.0 | 13.18 1.0 | |
| 51586.71 | 1.392 0.007 | 1261.2 5. | 262.9 2. | 84.75 2. | 35.42 1.5 | 45.65 1.5 | 21.16 1.0 | 11.97 1.0 | |
| 51595.88 | 1.546 0.050 | 1194.5 10. | 235.1 4. | 86.77 4. | 37.16 3.0 | 43.16 3.0 | 19.64 2.0 | 12.32 3.0 | |
| 51598.86 | 1.634 0.025 | 1125.3 5. | 239.2 2. | 73.89 2. | 47.25 1.5 | 44.83 1.5 | 23.02 1.0 | 10.40 1.0 | |
| 51605.83 | 1.405 0.014 | 1143.1 5. | 238.2 2. | 82.08 2. | 44.21 1.5 | 46.37 1.5 | 21.15 1.0 | 12.69 1.0 | |
| 51608.62 | 1.350 0.015 | 1128.5 5. | 230.1 2. | 68.28 2. | 37.87 1.5 | 44.14 1.5 | 21.17 1.0 | 10.97 1.0 | |
| 51611.62 | 1.364 0.017 | 1091.8 5. | 229.8 2. | 73.56 2. | 30.40 1.5 | 39.32 1.5 | 20.89 1.0 | 11.38 1.0 | |
| 51614.63 | 1.088 0.011 | 1140.5 5. | 234.6 2. | 79.75 2. | 29.53 1.5 | 37.42 1.5 | 18.56 1.0 | 10.40 1.0 | |
| 51629.76 | 1.076 0.013 | 1076.2 5. | 201.3 2. | 52.80 2. | 28.74 1.5 | 33.60 1.5 | 18.16 1.0 | 8.46 1.0 | |
| 51637.77 | 1.042 0.009 | 1066.7 5. | 191.6 2. | 52.53 2. | 27.36 1.5 | 31.59 1.5 | 17.31 1.0 | 8.98 1.0 | |
| 51645.73 | 1.156 0.015 | 1009.3 5. | 182.3 2. | 52.33 2. | 21.72 1.5 | 33.91 1.5 | 15.91 1.0 | 9.30 1.0 | |
| 51658.70 | 1.385 0.019 | 839.7 5. | 180.3 2. | 47.16 2. | 29.74 1.5 | 29.45 1.5 | 19.68 1.0 | 10.76 1.0 | |
| 51663.68 | 1.263 0.042 | 950.7 10. | 184.4 4. | 50.06 3. | 28.05 2.5 | 33.09 2.5 | 17.37 2.0 | 9.93 2.0 | |
| 51664.66 | 1.209 0.009 | 973.2 5. | 185.7 2. | 57.60 3. | 30.82 1.5 | 33.16 1.5 | 16.59 1.0 | 9.41 1.0 | |
| 51670.70 | 1.329 0.021 | 985.0 8. | 179.4 3. | 54.45 3. | 23.75 2.5 | 36.99 2.5 | 14.85 2.0 | 10.59 2.0 | |
| 51673.69 | 1.110 0.017 | 917.5 5. | 190.0 2. | 54.93 2. | 22.82 1.5 | 31.06 1.5 | 18.81 1.0 | 12.73 1.0 | |
| 51678.64 | 1.108 0.013 | 982.6 5. | 188.3 2. | 53.61 2. | 25.95 1.5 | 34.69 1.5 | 16.72 1.0 | 9.14 1.0 |
Continuum flux (2) in 10-15 erg sec-1 cm-2 Å-1.
Line fluxes (3) - (9) in 10-15 erg sec-1 cm-2.