A Hubble Space Telescope Lensing Survey of
X-ray Luminous Galaxy Clusters: II.
A Search for Gravitationally Lensed EROs
Abstract
We present the results of a survey for Extremely Red Objects (EROs) undertaken in the fields of ten massive galaxy cluster lenses at , combining sensitive, high-resolution Hubble Space Telescope imaging with deep, half-arcsecond –band imaging from UKIRT. We detect 60 EROs with , of which 26 have in a total image plane survey area of 49 arcmin2 down to , including one multiply-imaged ERO. We use detailed models of the cluster lenses to quantify the lens amplification and thus correct the observed number counts and survey area for the effects of gravitational lensing. After making these corrections, we estimate surface densities at of () and () arcmin-2 for EROs with and 6.0 respectively. These ERO number counts agree with previous shallower surveys at and flatten significantly at magnitudes fainter than –20. This flattening may be due to a transition from an ERO population dominated by evolved galaxies at –2 () to one dominated by dusty starburst galaxies at (). We also compare our results with various model predictions, including a model that attempts to explain EROs in terms of a single population of elliptical galaxies formed at high redshift. We find that a formation epoch of for this population matches the observed surface density of EROs quite well, and the sample less well. More sophisticated models, including semi-analytic prescriptions, under-predict the ERO surface density by approximately an order of magnitude, suggesting that these models produce insufficient stars and/or dust at high redshift. This deficit of EROs appears to be a general problem with models that reproduce the median redshift from –selected redshift surveys. One possible explanation is that the current – selected redshift distribution may be incomplete beyond .
keywords:
galaxies: formation – galaxies: evolution – cosmology: observations – infrared: galaxies1 Introduction
Extremely Red Objects (EROs) are defined by their very red optical/near-infrared colours, e.g. (e.g. Moriondo et al. 2000) and typically have –band magnitudes of . Since their discovery (Elston et al. 1988, 1989, 1991; McCarthy et al. 1992; Eisenhardt & Dickinson 1992; Graham et al. 1994; Hu & Ridgway 1994; Dey et al. 1995), they have intrigued cosmologists, but until recently their extreme properties have escaped detailed, systematic investigation.
The variety of colour criteria used to define EROs e.g. , , or , , together with different survey depths and apparently strong clustering (Daddi et al. 2000a) have led to a wide dispersion in the claimed surface densities of EROs (e.g. Hu & Ridgway 1994; Cowie et al. 1994; Aragón-Salamanca et al. 1994; Dey et al. 1995; Moustakas et al. 1997; Yamada et al. 1997; Beckwith et al. 1998; Eisenhardt et al. 1998; Barger et al. 1999; Thompson et al. 1999; Daddi et al. 2000a; McCracken et al. 2000). The larger and newer surveys suggest that to the surface density of galaxies is arcmin-2 (Daddi et al. 2000a), increasing to arcmin -2 at the faintest limit probed to date (Thompson et al. 1999).
The optical faintness of EROs () and the lack of near-infrared multi-object spectrographs have combined to severely limit the number of spectroscopic identifications. However, the available spectra indicate that EROs comprise two broad classes of system: galaxies with evolved stellar populations at (e.g. Dunlop et al. 1996; Soifer et al. 1999; Liu et al. 2000) and dust-reddened starbursts at similar and higher redshifts (Graham et al. 1996; Dey et al. 1999). A few starburst EROs have also been detected in radio and sub-millimetre (sub-mm) wavelength surveys of the distant universe (Spinrad et al. 1997; Smail et al. 1999a, 2000; Dey et al. 1999; Gear et al. 2000; Barger et al. 2001). However, morphological studies (e.g. Treu et al. 1999; Moriondo et al. 2000) suggest that at the bulk of EROs are evolved elliptical galaxies.
These two classes of EROs may represent different phases in the formation and evolution of a single family of high redshift galaxies: massive ellipticals. However, rival galaxy formation theories (pure luminosity evolution and hierarchical clustering) predict very different formation epochs for such galaxies. The former predicts formation at high redshift in what is traditionally known as the “monolithic collapse” scenario (e.g. Eggen et al. 1962; Larson et al. 1975; Tinsley & Gunn 1976) followed by subsequent passive evolution. The latter predicts formation through the merging of disk galaxies at (e.g. White & Frenk 1991; Kauffmann et al. 1993, 1996; Baugh et al. 1996; Cole et al. 1996, 2000). The properties of EROs, specifically, their redshift distribution and spectral characteristics, are therefore a crucial test of galaxy formation theories and will improve our ability to make complete measurements of the star formation history of the universe (e.g. Madau et al. 1996; Smail et al. 2001).
Many groups are currently investigating different aspects of the ERO population using a variety of observational approaches, for example: wide-field imaging surveys (Daddi et al. 2000a; Thompson et al. 1999), morphological studies (Treu et al. 1999; Moriondo et al. 2000), searches for over-densities around radio-loud AGN (Willott et al. 2000; Chapman et al. 2000; Cimatti et al. 2000), deep –band number counts (McCracken et al. 2000; Barger et al. 1999), searches for sub-mm counterparts (Smail et al. 1999a), photometric redshift studies (Fontana et al. 1999), studies of faint field spheroidals (Menanteau et al. 1999) and high redshift hosts of optically faint X-ray sources (Cowie et al. 2001).
This paper describes a survey whose aim is to produce a sample of EROs which is optimised for follow-up, with the specific goal of improving the opportunities for measuring redshifts and spectral properties. To achieve this we take advantage of the natural magnification of massive clusters of galaxies to amplify background source populations, in this case EROs, and so boost their apparent brightness. This approach has been successfully applied to the investigation of other faint sources with steep number counts, such as mid-infrared and sub-mm galaxies (e.g. Altieri et al. 1999; Smail, Ivison & Blain 1997) and may similarly aid progress in understanding the properties of EROs.
We use a unique sample of X-ray luminous galaxy clusters at moderate redshifts which have been uniformly imaged with the Hubble Space Telescope (HST) through the F702W filter to provide deep, high resolution imaging of the cluster cores – including many gravitationally lensed arcs. We have supplemented these deep optical images with high quality ground-based near-infrared imaging with UKIRT and we use this combined dataset to construct a sample of gravitationally amplified EROs.
In the next section we describe the optical and near-infrared imaging and its reduction. §3 describes the analysis of these images and the properties of the ERO sample constructed from them. Finally in §4 we discuss our results and list the main conclusions of this work. Throughout this paper we assume kms-1Mpc-1, =0.3 and .
2 Observations
2.1 HST / WFPC2 Optical Imaging
The HST imaging of the clusters used in this paper was obtained as part of a survey of gravitational lensing by X-ray luminous clusters (Smith et al. 2001a, 2001c). The complete sample consists of twelve X-ray luminous clusters ( erg s-1, 0.1–2.4 keV) in a narrow redshift slice at , selected from the XBACs sample (Ebeling et al. 1996). For the purposes of this paper we concentrate on the ten clusters listed in Table 1 for which homogeneous F702W imaging is available (the remaining two clusters which are excluded from our analysis are A 1689 and A 2390 for which only archival observations are available).
| Cluster | Redshift | F702W | –band | NERO | ||||||||
|---|---|---|---|---|---|---|---|---|---|---|---|---|
| WF2 | WF3 | WF4 | Depth | |||||||||
| TF702W | TK | FWHM | TK | FWHM | TK | FWHM | () | |||||
| (ks) | (ks) | (′′) | (ks) | (′′) | (ks) | (′′) | ||||||
| UKIRT Observations | ||||||||||||
| A 68 | 0.255 | 0.093 | 7.5 | 8.8 | 0.43 | 8.0 | 0.48 | 7.5 | 0.50 | 20.51 | 9 | 5 |
| A 209 | 0.209 | 0.019 | 7.8 | 6.5 | 0.53 | 6.5 | 0.51 | 6.5 | 0.38 | 20.42 | 7 | 2 |
| A 267 | 0.230 | 0.025 | 7.5 | 6.5 | 0.37 | 6.5 | 0.40 | 4.4 | 0.38 | 20.69 | 12 | 5 |
| A 383 | 0.187 | 0.033 | 7.5 | 6.5 | 0.59 | 6.7 | 0.57 | 6.5 | 0.42 | 20.65 | 11 | 6 |
| A 773 | 0.217 | 0.015 | 7.2 | 6.5 | 0.65 | 6.5 | 0.55 | 9.7 | 0.67 | 20.52 | 1 | 0 |
| A 963 | 0.206 | 0.015 | 7.8 | 6.5 | 0.59 | 6.5 | 0.52 | 6.5 | 0.70 | 20.64 | 12 | 6 |
| A 1763 | 0.228 | 0.009 | 7.8 | 6.5 | 0.58 | 6.5 | 0.55 | 6.5 | 0.69 | 20.65 | 5 | 2 |
| A 1835 | 0.253 | 0.030 | 7.5 | 6.5 | 0.48 | 6.5 | 0.44 | 6.5 | 0.45 | 20.58 | 1 | 0 |
| A 2219 | 0.228 | 0.024 | 14.4 | 6.5 | 0.60 | 9.7 | 0.60 | 6.5 | 0.51 | 20.67 | 2 | 0 |
| WHT Observations | ||||||||||||
| A 2218 | 0.171 | 0.024 | 6.5 | 8.3 ks 0.75′′ | 21.50 | 0 | 0 | |||||
Of these ten clusters, A 2218 was observed in Cycle 4, A 2219 in Cycle 6 and the remaining eight clusters in Cycle 8. All clusters except A 2219 were observed for three, single orbit exposures with the WFPC2 camera through the F702W filter; A 2219 was observed for six orbits using the same instrument/filter combination. The total exposure times for the fields, TR, are listed in Table 1. Each exposure was shifted relative to the others by ten WFC pixels () providing a partial overlap of the WFC chips. After pipeline processing, standard iraf/stsdas routines were used to align and combine the frames to remove both cosmic rays and hot pixels. Corrections for under-sampling of the point spread function (PSF) and geometric distortion of the optics were made using the dither package within iraf (Fruchter & Hook 1997). More details are given in Smith et al. (2001a, 2001c).
We adopt the photometric system from Holtzman et al. (1995) and, in the following, have chosen to convert the photometry to Cousins –band to aid in comparing our results with previous surveys. To achieve this we adopt a colour for an Sbc galaxy at –2 of , based on spectral templates derived from local galaxies. This translates into a correction of with a systematic uncertainty of magnitudes arising from the likely presence of both more and less evolved galaxies than the adopted Sbc spectral type. The equivalent correction for galaxies with the colours of cluster ellipticals at , , is , with an estimated systematic uncertainty of . Both of these corrections are sufficiently accurate to define a sample of EROs in these fields.
The final WFPC2 frames have an effective resolution of 0.15′′ and a typical 3– detection limit within our 2′′–diameter photometry aperture of .
2.2 Near-infrared Imaging
The near-infrared (–band) imaging essential for identifying EROs was obtained for nine of the ten clusters with the UFTI imager on the 3.8–m United Kingdom Infrared Telescope (UKIRT)111UKIRT is operated by the Joint Astronomy Centre on behalf of the Particle Physics and Astronomy Research Council of the United Kingdom.. UFTI incorporates a 10242 Hawaii-1 detector providing a 92′′ field of view with 0.0908′′ pixel-1 sampling – necessary to sample the best seeing provided by UKIRT, –0.3′′. The –band imaging of these fields was obtained in two observing runs in 2000 April 4–7 and September 26–29. Conditions during both observing runs were good, with reasonable seeing and transparency. Each WFPC2 field was covered in three pointings (one per WFC chip: WF2, WF3 and WF4), although the different roll-angles for the various WFPC2 observations means that a particular near-infrared exposure may overlap more than one WFC chip. The individual pointings usually consist of –s exposures grouped into six sets of nine exposures, or occasionally –s exposures in eight sets of nine, each exposure being offset on a grid with 10′′ spacing, and the origin of each set was randomly moved by . We list the total exposure times for the individual pointings (TK) and the seeing for each in Table 1. The median seeing for these 2–hr integrations is 0.5′′.
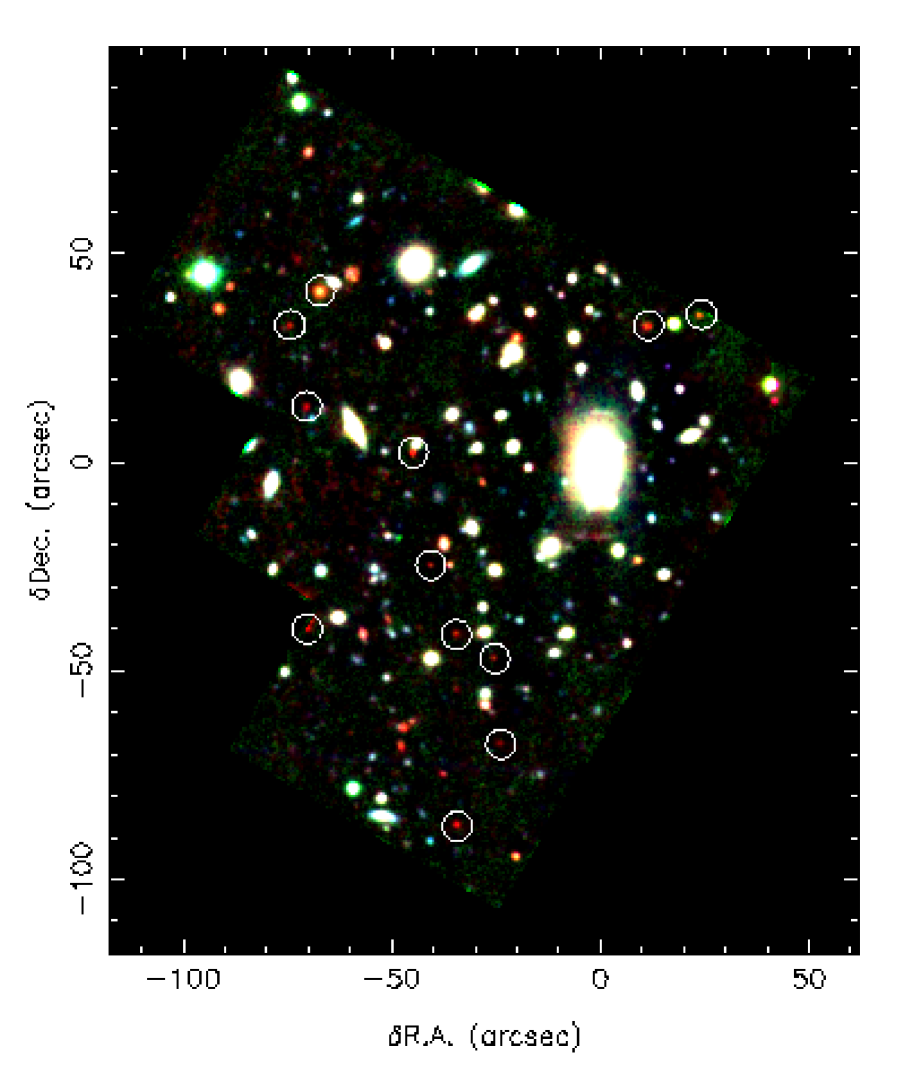
The data were reduced using the dedicated UFTI summit data pipeline (Currie et al. 1999) including dark subtraction, flat fielding using a local median sky, resampling onto an astrometric grid and combining to remove defects and cosmic ray events. A small amount of the data was re-reduced in Durham following a similar scheme and using standard iraf tasks. Calibration was obtained from UKIRT Faint Standards (Casali & Hawarden 1992) interspersed throughout the science observations. We estimate that our absolute calibration is good to mag. A reddening correction of , was also applied to the colours following Schlegel et al. (1998). The final UFTI –band images typically reach a median 80% completeness of (Table 1 & §2.4). For comparison a passively evolving elliptical will have –19 at . We show an example of one of our fields in Fig. 1.
The tenth cluster, A 2218, was observed in commissioning time with the new INGRID near-infrared imager (Packham et al. 2001) on the 4.2–m William Herschel Telescope (WHT)222Based on observations made with the William Herschel Telescope operated on the island of La Palma by the Isaac Newton Group in the Spanish Observatorio del Roque de los Muchachos of the Instituto de Astrofisica de Canarias. INGRID comprises a 10242 Hawaii-1 detector giving a 248′′ field of view with 0.242′′ pixel-1 sampling. These data comprise a 8.3 ks exposure of the whole WFPC2 field in A 2218 (Kneib et al. 1996) in the band. The seeing on the final stacked frame is 0.75′′ and the frame reaches an 80% completeness limit of for point sources. The reduction, calibration and analysis of these data are discussed in more detail in Smail et al. (2001). For uniformity in our analysis we restrict ourselves to a limit of in A 2218.
In addition to the –band imaging described above, a sub-set of the cluster fields were also observed in the –band. We observed A 773, A 963, A 1763 and A 1835 with UKIRT/UFTI on the nights of 2001 February 16 and April 4 in non-photometric conditions and seeing, and A 68 A 267 and A 2219 with WHT/INGRID on the nights of 2001 June 27 and 2001 May 6, in seeing and photometric conditions (Table 2). All of these observations were reduced in a similar manner to the –band images. The UFTI observations reach a 5– limit of , whilst INGRID frames reach 5– depths of 20–21. Finally, a –band image of A 2218 is also available from the INGRID commissioning observations of that cluster, however, as we find no ERO sources brighter than within that field, we do not discuss these data further.
2.3 Ground-based Optical Imaging
To study the spectral energy distributions of EROs between the – and – bands, we also make use of archival –band imaging of the clusters in our sample. These observations come from a number of ground-based 4–m class telescopes and comprise 0.5–3.6 ks integration in 0.7–1.4′′ seeing (Table 2), reaching . We use panoramic imaging of A 68, A 209, A 267 and A 383 from the CFH12k camera on the 3.6–m Canada-France-Hawaii Telescope,333Based on observations made with the Canada France Hawaii Telescope, operated on the island of Hawaii by the Canada France Hawaii Telescope Corporation taken on 1999 November 10–14. More details of their reduction and analysis can be found in Smith et al. (2001a, 2001c) and Czoske et al. (2001). For A 773 and A 963 we use –band images taken on 1994 December 8–9 with PFCCD of the 4.2–m William Herschel Telescope444Based on observations made with the William Herschel Telescope operated on the island of La Palma by the Isaac Newton Group in the Spanish Observatorio del Roque de los Muchachos of the Instituto de Astrofisica de Canarias. Finally, we exploit imaging of A 1763, A 1835, A 2218 and A 2219 taken with the COSMIC imager spectrograph on the Hale 5–m555This work is based on observations obtained at Palomar Observatory, which is owned and operated by the California Institute of Technology, more details of these observations and details of their reduction can be found in Smail et al. (1998) and Ziegler et al. (2001).
3 Analysis and Results
| Cluster | –band | –band | |||
|---|---|---|---|---|---|
| TI | FWHM | TJ | FWHM | Field(s) | |
| (ks) | (′′) | (ks) | (′′) | Observeda | |
| A 68 | 3.6 | 0.7 | 3.2 | 0.8 | WFPC2 |
| A 209 | 3.6 | 0.7 | … | … | … |
| A 267 | 0.9 | 0.7 | 1.3 | 0.8 | WFPC2 |
| A 383 | 3.6 | 0.7 | … | … | … |
| A 773 | 0.9 | 1.4 | 3.2 | 0.6 | WF4 |
| A 963 | 0.6 | 1.1 | 3.2 | 0.6 | WF2/3/4 |
| A 1763 | 0.5 | 1.1 | 3.2 | 0.6 | WF2/4 |
| A 1835 | 1.0 | 1.1 | 3.2 | 0.6 | WF2 |
| A 2218 | 21.7 | 0.9 | 6.5 | 0.8 | WFPC2 |
| A 2219 | 0.5 | 1.1 | 2.2 | 0.8 | WFPC2 |
(a) The –band observations cover the whole WFPC2 field of view. For the –band: WFPC2 denotes WHT/INGRID observations which cover the whole field; WF2/3/4 indicate UKIRT/UFTI imaging of a particular WFC chip.
3.1 Source Detection and Photometry
The near-infrared images of each cluster were aligned and mosaiced together (if necessary) to create one –band frame per cluster that covers the relevant WFPC2 field of view. The WFPC2 frames were rotated and aligned to the –band frames with an rms tolerance of and the whole field astrometrically calibrated using the APM catalogue to an absolute accuracy of .
To produce a catalogue of EROs in these fields we first analysed the –band frames using the SExtractor package (Bertin & Arnouts 1996). All objects with isophotal areas in excess of 10 pixels ( arcsec2) at the mag arcsec-2 isophote ( pixel-1) and lying within the WFPC2 field of view were selected. Across the ten clusters, this survey covers a total area of 49 arcmin2, excluding the PC chips, and these catalogues contain a total of 2,382 sources. We adopt the mag_best magnitude computed by SExtractor as the total –band magnitude of each source.
We perform extensive ( realisations) Monte Carlo simulations to measure the completeness limits of these catalogues by suitably scaling and re-inserting a moderately bright (), compact ERO source into the science frames. The resulting 80% completeness limits (roughly equivalent to 5– detection limits) are presented in Table 1. We also re-perform these simulations using a more diffuse galaxy of similar magnitude, and find that the typical 5– limiting depth was magnitudes brighter than that for the compact source. This difference is not large enough to have a significant impact on the results presented in this paper.
We measured the colour of all these sources using a 2′′ diameter aperture on seeing matched – and –band frames. As the image smoothing required to match the seeing reduces the pixel to pixel variation in the sky backgrounds, the noise estimates from the seeing-matched frames are compromised. We therefore exploited the overlap regions between the three UFTI pointings used to cover each HST field to compare independent photometry of sources as a function of magnitude, and so derive conservative estimates of the photometric uncertainties as a function of magnitude. We applied the same principle in the –band, taking advantage of the six 2.4 ks exposures of A 2219 (§2.1), to make independent measurements on two frames, each derived from an independent sub-set of three exposures. This provides a reliable and conservative estimate of the photometric errors of sources in the –band. We also estimate the 5– depth of the –band imaging to be . However, for the purposes of our final photometry we adopt a 3– –band detection limit of to discriminate between and (§2.4) sources lying close to both detection limits.
We show the – colour-magnitude diagrams for the ten clusters in Fig. 2. The strong sequences of red galaxies identifiable in all the panels correspond to the evolved early-type cluster members. These provide a useful check of the calibration of the colours for sources in these fields. We estimate that the rms scatter in the colours of the cluster early-type sequences at a fixed luminosity as a function of redshift is mags, confirming that any field-to-field offset between our photometry of galaxies detected in each cluster field is magnitudes.
Finally, we measure the and (where –band imaging is available) colours of the ERO sample defined in §3.2 using a 2′′ diameter aperture on seeing-matched frames, adopting a 3– detection limit when no – or – band counterpart is detected.


3.2 ERO Selection
We adopt the definition of an ERO as a galaxy with as used by Daddi et al. (2000a), and also employ a more stringent definition of (Thompson et al. 1999). These sample boundaries are shown for the individual cluster fields in Fig. 2, we list the numbers of galaxies in each class in the various clusters in Table 1 and give a catalogue of the sources in Table 3.
We show in Fig. 3 the composite – colour magnitude diagram for all ten clusters, along with the sample boundaries. In total we find 60 sources with in the ten fields (an image plane survey area of 49 arcmin2) and 26 with down to our median 80% completeness limit of .
In addition to the Monte Carlo simulations described in §3.1, we performed two further checks to verify the completeness of our ERO sample. First, we visually checked true-colour optical/near-infrared images of the clusters (e.g. Fig. 1) to guard against losing ERO candidates due to contamination of photometric apertures by nearby sources with less extreme colours. In two cases we re-calculated the colours of objects after masking the light from nearby galaxies to ensure a more reliable measurement. Second, we searched for EROs hidden under the halos of bright cluster ellipticals by subtracting a median-smoothed version of the each –band frame from the original frame to produce a “difference” frame. This search revealed no further EROs.
These “difference” frames contain residual flux from the central regions of the bright cluster ellipticals, with the result that a fraction of each WFPC2 field of view remains obscured. We estimate this fraction, first thresholding the “difference” frames at a level where the fainter EROs in our sample would not be detected. We then ray trace these thresholded frames back to the source plane (using the lens models described in §3.3). As the lens amplification is highest at the cluster centre and the centre of other bright cluster ellipticals, the transformation to the source plane results in the obscured fraction of each field of view being typically %.
We estimate contamination of the sample by red, low mass stars by visually comparing the –band morphologies of the 19 EROs in our sample with a FWHM to the images of morphologically-classified stars selected from the HST frames. Only one of these sources (ERO J0248050330.2) has a star-like morphology; we therefore flag it as a possible star or AGN, but choose not to remove it from our analysis. This very low level of stellar contamination () is consistent with that determined by Daddi et al. (2000a) and Thompson et al. (1999).
A further potential bias in colour-selected surveys in gravitational lens fields is differential amplification across a galaxy image, causing separate regions of the galaxy with possibly different underlying colours to suffer different degrees of amplification. As the lens amplification only varies strongly with position close to critical lines, this bias is only a concern for multiply-imaged galaxies. Only one of our sample of 60 EROs is multiply imaged (§3.7). We therefore conclude that this bias has a negligible effect on our sample.
3.3 Surface Density of EROs
In a “blank” field survey, the surface density of sources brighter than a given limiting magnitude can be calculated by dividing the number of detected sources by the surveyed area. This simple calculation is more complicated in the field of a gravitational lens, due to the amplification of the source flux and the accompanying distortion of the background sky (source plane). Consequently, some regions of the source plane are observed to greater depths than others, even if the image plane is observed to a uniform depth. These effects can be quantified by constructing a detailed model of the gravitational lens. Such models are then used to compute the lens amplification as a function of image plane position. This knowledge of the lens amplification allows the surface density of sources to be reliably estimated as described in more detail below. First, we briefly discuss the lens models used to quantify the lens amplification in our cluster sample.
Smith et al. (2001c; hereafter S01) have constructed a detailed model of each cluster in our sample using the parametric lens inversion method of Kneib et al. (1996). S01 discuss the robustness of these lens models in considerable detail. In this paper, we summarise the redshift information used to constrain the models and thus provide an overview of the reliability of these models. The most robust models are those constrained by the spectroscopic redshift of a multiply-imaged background galaxy. Four of the ten clusters fall into this category. Half of the remaining six clusters contain faint multiply-imaged sources, whilst only three contain no obvious multiple images in our F702W frames. S01 therefore used both photometric redshift techniques and uniformly selected samples of weakly sheared background galaxies to constrain the lens models for these six clusters. Consequently, the amplifying power of the four spectroscopically constrained models is known to 2–5%, whilst the power of the other six is typically known to an accuracy of %. We therefore use S01’s lens models to remove the effects of lens amplification from both the source counts and the surveyed area using the method described below (Blain et al. 1999).
The amplification suffered by each background galaxy depends on its redshift () and the redshift of the intervening lens (). This redshift dependence is weak if , and as the cluster lenses all lie at and the background galaxies are all expected to lie at –2, this regime applies. We therefore adopt a single source plane of =1.5 and use each model to compute a map of lens amplification as a function of image plane position for this value of in each of the ten cluster fields. Adoption of a single value of introduces an uncertainty of –20 into the final surface density values, which is comparable with the Poisson noise in the raw number counts.
We first use the amplification maps to de-amplify the image plane flux of each ERO in our sample and hence obtain their source plane –band magnitudes. As gravitational lensing is achromatic, no correction is required to the colour. The number of EROs that are brighter than a source plane limiting magnitude , , can then be found by simply counting the number of sources brighter than in the source plane after correcting for lensing. A simple Poisson uncertainty is attached to this value.
We then calculate the area of the background sky within which each ERO is detectable in the relevant cluster field in the following manner. An ERO with a source plane magnitude of will appear in the image plane of the relevant cluster with a magnitude brighter than an image plane detection limit of if it is magnified by a factor greater than . The area in the source plane within which such a galaxy would be detected in that cluster is thus , where is the area of the source plane behind each cluster that lies within the WFPC2 field of view and is magnified by a factor greater than (Fig. 4). Finally, we divide the number of galaxies by the sum of the areas for all ten clusters, to obtain the cumulative surface density .
We present in Fig. 5 the cumulative surface density, , of and EROs detected in our survey after correcting the source fluxes and source plane surface areas for lens amplification. We also show the results of recent shallower, wide-field surveys (Daddi et al. 2000a; Thompson et al. 1999). The three datasets agree in the region of overlap (–19.5). We estimate the cumulative surface density of EROs at with to be () arcmin-2 and with to be () arcmin-2. We note that the EROs appear to comprise a constant fraction of the the overall population at all magnitudes: .
The slope of Daddi et al.’s (2000a) cumulative number counts for EROs with is at , where . However, fainter than , we estimate the slope of our cumulative number counts to be , suggesting a break in the surface density of EROs at –20. Number counts of the population reveal a similar break, with slopes of and for brighter and fainter EROs respectively.

3.4 Colour Distributions
We present the – colour-colour diagram of our ERO sample in Fig. 6a. We also plot in Fig. 6a the expected colours of passively evolving ellipticals as a function of redshift (for a formation redshift of – see also §4.1). We begin by comparing the and ERO selection criteria. Of the EROs, (15) have and would therefore not be classified as EROs in an selected sample. Most of these galaxies are also blue in , and given their proximity to the portion of the evolutionary track, we suggest that they are probably early-type galaxies whose 4000– break lies between the – and –bands.
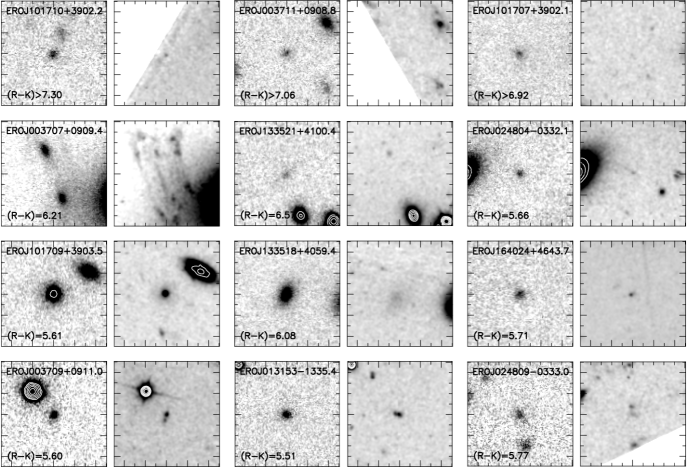
We also see that a substantial fraction of the galaxies are redder than the passive evolutionary track. Whilst we treat this comparison with caution, due to uncertainties in both photometric measurements and calibration onto the models, this suggests that the population may contain a sizeable fraction of starburst galaxies. We also measure the typical colour of those EROs for which we can only place a limit on their colour by co-adding the F702W–band images of these EROs. Using the same photometric approach as in §3.1, we obtain a typical –band magnitude for these galaxies of , just 0.4 magnitudes fainter than the 3– limit of determined in §3.2. This suggests that these galaxies are a continuation of the population that is detected in , rather than a distinct population of galaxies with much more extreme colours. The three galaxies with the most extreme colours are shown in Fig. 7.


Pozzetti & Mannucci (2000) develop a method for breaking the “age–dust” degeneracy between passive and starburst EROs. They explore the – and – planes, proposing a classification scheme based on the steepness of the spectral break between optical and near-infrared bands at –2. We show the – plane of those EROs for which we have obtained –band detections in Fig. 6b. We note that all of the morphologically classified “Compact” EROs (see §3.5) lie on the “Elliptical” side of the classification boundary. The situation is less clear for the “Irregular” galaxies, where the large photometric uncertainties mean that we cannot reliably state that the majority of these galaxies lie on the “Starburst” side of the classification boundary. More accurate –band photometry and spectroscopic identifications of the brighter members are required before firm conclusions may be drawn from this analysis.
Whilst the foreground cluster lenses increase the chances of successful spectroscopic identifications, the same amplifying power allows us to observe yet fainter EROs (–21 in the image plane), for which spectroscopic observations will remain unfeasible. As a test of the capabilities of photometric redshift measurements for EROs we use hyper-z (Bolzonella et al. 2000) to estimate photometric redshifts for those EROs for which photometry is available. We use template spectra corresponding to 51 different ages for a Gyr –model from Bruzual & Charlot (1993) to obtain a likelihood map in dust extinction–redshift (AV–) space for each galaxy. In most cases, valid solutions are possible for a wide range of redshifts, however the most likely solution is usually found around –2.
Future spectroscopic observations (e.g. Smith et al. 2001b) in conjunction with – and –band photometry of the whole sample will probe the redshift distribution and star formation histories of our ERO sample in significantly more detail.
3.5 Morphological Diversity
To gain further insight into the diversity of the ERO population we now attempt to quantify the morphologies of our sample. The optical imaging from HST has exquisite spatial resolution (0.1′′), however EROs are optically faint (), and therefore suffer from low signal to noise in optical pass-bands. In contrast, EROs are typically well detected in the near-infrared and our –band imaging from UKIRT enjoys superb seeing (0.5′′). We therefore exploit both datasets in the following analysis.
We first attempt to measure the scale-size of each member in our ERO sample. We fit a Moffatt profile to the –band image of each ERO from which we estimate the FWHM, and then crudely correct for the effects of seeing by subtracting in quadrature the FWHM of the PSF on the frame (Table 3). These measurements reveal no trend in intrinsic FWHM versus colour or –band magnitude, most likely due to uncertainties in the individual measurements.
We therefore attempt to measure the properties (scale-size and central concentration) of a typical ERO in amplification corrected magnitude bins: , and , co-adding the –band images of the EROs to obtain one representative galaxy per bin. Using where is the surface brightness at radius and is the mean surface brightness within (Petrosian 1976; Kron 1980), we measure the angular size of the three co-added galaxies where (Bershady et al. 1998). We also measure the concentration of these composite galaxies, , i.e. the ratio between the flux within the radius and that within 1.5 (Saracco et al. 1999).


Despite the co-addition of the data in these broad magnitude bins, no discernible trend in scale-size or concentration with –band magnitude or colour is found; for example, the concentration values differ by while the error bars are typically . It therefore appears that, although our –band data enjoys both high signal to noise and high resolution (0.5′′), a detailed morphological analysis of these galaxies at near-infrared wavelengths is not possible. We therefore turn to the optical HST imaging, noting that at –2, the F702W filter samples the rest-frame ultra-violet. The following morphological classification is therefore sensitive to any ongoing unobscured star-formation in these galaxies, allowing us to identify easily starburst systems..
We classify our ERO sample on the basis of their appearance in the HST F702W frames (Table 3): “C”, compact galaxies; “I”, irregular galaxies, e.g. disk-like, clumpy or interacting morphology; “F”, faint galaxies which are either not or only just detected in the HST frames. The sample comprises: 18% (C); 50% (I); 32% (F). Considering just the Compact and Irregular galaxies, we find that of the population are irregular, compared with of those with . This is another hint that the population may be dominated by distant dusty starbursts, although the large fraction of irregular EROs, suggests that dusty starbursts may also make an important contribution to the less extreme ERO population.
These results, specifically the large fraction of dusty starburst EROs in our sample, disagree with previous attempts to classify EROs on the basis of their morphology. For example, Moriondo et al. (2000) claim that only 15–20% of EROs in their sample have an “irregular” morphology, while 50–80% are well fitted by an elliptical galaxy ( law) profile. As noted by these authors, their data is heterogeneous, being drawn from the HST archive, and so the depth of their observations is not well defined, in contrast to our highly homogeneous data set. Another difference between the two studies is that of Moriondo et al.’s EROs come from targeted searches in probable dense environments, such as high redshift clusters, and regions around radio galaxies and quasars, whereas we survey random fields in the universe. Moriondo et al.’s (2000) results may therefore be biased by their concentration on dense environments.
Finally, we illustrate the diversity of ERO morphology in Fig. 7, including candidate interacting galaxies and strongly lensed EROs.
3.6 Clustering of EROs
There is an order of magnitude variation in the number of EROs detected in each cluster field (Fig. 2 & Table 1), supporting previous claims that at least some component of the ERO population is strongly clustered (Daddi et al. 2000a). However, to confidently identify two or more EROs as lying at the same redshift and therefore as being physically associated with each other generally requires spectra of those galaxies. Here, we search our photometric catalogue for examples of two or more neighbouring EROs that exhibit similar –band magnitudes and colours. The premise being that such systems may represent high-redshift galaxy associations and that the similar colours and magnitudes of such galaxies are analogous with the strong early-type galaxy sequences observed in lower redshift clusters and groups (e.g. Fig. 2 & 3a). We find two candidates for pairs of EROs, one each in A 963 and A 1835.
EROJ1017013903.4 & EROJ1017033903.4 — These two EROs (Table 3) have and and lie north-west of the cD galaxy in A 963 in Fig. 1. They both have a regular –band morphology and very faint, low-surface brightness – and –band morphologies. Within the photometric errors, the and colours of these two galaxies support the idea that these are two high redshift elliptical galaxies. However, ERO J1017013903.4 is 0.5–1.0 magnitude bluer than its neighbour in (Fig. 5a & Table 3), indicating that it may be at a slightly lower redshift.
EROJ1400570252.4 — This is one of two adjacent galaxies (separation 3′′) in the field of A 1835. The other galaxy falls just below the criterion (Fig. 2), and is therefore not included in the ERO sample. Both galaxies have featureless –band morphologies, as does the ERO in the –band. The neighbour however has a very diffuse and low surface brightness –band morphology.
We conclude that there are no unambiguous examples of ERO associations in our sample.
3.7 Strongly Lensed EROs
The amplifying power of the cluster lenses becomes very high within of the centre of the cluster. This is the region of the image plane in which rare, highly magnified giant arcs are detected in some clusters (e.g. A 383, Smith et al. 2001a). In this same region of the image plane, we detect three strongly lensed EROs in our cluster sample, which we discuss below.
EROJ0037070909.4 & EROJ0037070909.5 — Three images of a single background galaxy are detected in the core of A 68. The two brighter images are adjacent to the central galaxy and are shown in Fig. 7, while the third image (ERO J0037006+0909.1) lies south of the central galaxy and is considerably fainter. The optical morphology of these images reveals complex structure, containing what appears to be five bright knots within each image. In contrast the –band shows a bright centrally concentrated source (=17.2, 17.6 and 19.1 respectively). We obtain colours of , and for the central red region in both of the two brighter images (Table 3). The morphology and position of these arcs relative to the central galaxy suggest that they are the images of a background spiral galaxy, probably at a redshift of –1.0.
We also perform photometry using concentric circular apertures of increasing diameter to estimate the colour gradient within the brightest image. The colour gradient indicates that this galaxy only has a colour of for photometric apertures of in diameter. From our lens model we estimate that the amplification of the central region of the galaxy is , implying that a source plane aperture of diameter would be required to identify this as an ERO. This source would therefore have (2′′ diameter aperture – see §3.1) and would not be detected as as ERO in the absence of the foreground cluster lens.
EROJ1335214100.4 — This ERO is north east of the central galaxy in A 1763 and is shown in Fig. 7. Its ellipticity (a / b ) and position angle with respect to the central galaxy indicate that it is probably strongly lensed. We do not however detect any counter images which implies that this galaxy is either singly imaged, or that the counter images fall below the detection threshold of our observations. The arclet has and and we place lower limits on its and colours of and respectively, suggesting that this may be a high redshift elliptical galaxy.
EROJ0248040332.1 — This ERO was identified by Smith et al. (2001a) and lies south of the cD galaxy in A 383 and adjacent to a bright cluster elliptical. The ellipticity (a / b 7) and position angle (tangential to the cD) of this ERO supporting the interpretation of this image as a lensed background galaxy. We measure and , making this an extreme ERO under both and selection criteria. Smith et al. (2001a) estimated from their lens model that the object’s redshift is .
4 Discussion and Conclusions
In this section we compare the observed number counts of EROs with the theoretical predictions of pure luminosity evolution (Daddi et al. 2000b; McCracken et al. 2000 – hereafter M00) and semi-analytic (Cole et al. 2000 – hereafter C00) models of galaxy formation, and then summarise our conclusions. Our primary aim when comparing our observational results with the different model predictions is to investigate the suggestion that EROs comprise a mixture of evolved and dusty galaxy populations.
4.1 Comparison with PLE Models
In Fig. 5 we compare our observed number counts (§3.3) with Daddi et al.’s (2000b) PLE model down to . This model attempts to describe EROs as a single population of evolved galaxies using two free parameters: , the initial redshift of star formation in these galaxies and , the e-folding time of the starburst. Daddi et al. adopt a Salpeter (1955) initial mass function (IMF), solar metallicity, no dust reddening and normalise the predicted number counts to the local luminosity function and rest frame colours of elliptical galaxies. Looking at the range of model parameters in this figure we see that at the models diverge, enabling us to discriminate between them. For the sample, the models with Gyr, and Gyr, , best match the data, with higher values of predicting too many EROs at . The same models are also the best match with the sample.
However, as we show earlier, EROs appear not to be a single population of galaxies (§1), with the fraction of dusty starbursts possibly increasing towards redder optical/near-infrared colours and fainter –band magnitudes (§3.3, §3.5). Agreement between the observations and these simple models should therefore deteriorate, at the faint, red limit. Unfortunately, comparison close to the faint limit is hampered by the cumulative nature of the data plotted in Fig. 5, fainter magnitudes being influenced by the brighter bins. Nevertheless, Fig. 5b suggests that the models have more difficulty in correctly predicting the surface density of EROs, supporting the idea that this population contains a substantial fraction of dusty starbursts. We also note that although the best model lies within 1– (Poissonian) of our data, the very small number of these redder EROs in our sample, particularly at –19, implies that the disagreement between Daddi et al.’s (2000a) data and this model at –20 is a better test of the model at these magnitudes. Daddi et al. (2000b) also noticed this discrepancy between their data and the models, and suggested that it was due to a possible deficit of ellipticals at .
In summary, a simple model that assumes EROs comprise only passively evolving elliptical galaxies (with Gyr and ) succeeds fairly well in predicting the number density of the population. This model is also the best match to observations of the population, however the agreement is significantly worse, suggesting that the “single population” assumption may be a poor description of these more extreme EROs.
We also compare our observations with a more general PLE model which attempts to describe the whole galaxy population, and not just passive ellipticals. This more detailed model (M00) includes five galaxy populations (E/S0, Sab, Sbc, Scd, Sdm), each normalised to observed local galaxy parameters (i.e. luminosity function and rest frame colours). M00 also require their model to reproduce the shape and amplitude of Cowie et al.’s (1996) –selected redshift distribution, which contains very few galaxies at . To achieve this, they adopt a dwarf dominated IMF () in order to reconcile their PLE prescription with Cowie et al.’s observational results.
The M00 model (Fig. 5) under-predicts the surface density of EROs by approximately an order of magnitude and predicts none with . We suggest that this is probably caused by M00 requiring their model to fit Cowie et al.’s (1996) –selected redshift distribution, which contains comparatively few galaxies at . However, Cowie et al. (1996) were concerned that their optical follow-up of a small-field –selected sample might be incomplete for the reddest (i.e. optically faintest – ) galaxies, and hence for galaxies at . Recent wide field surveys have also discovered that EROs are strongly clustered (e.g. Daddi et al. 2000a: arcmin2). In contrast, Cowie et al.’s spectroscopic survey covered just 26.2 arcmin2, raising the possibility that their survey targeted an under-dense patch of sky. We therefore suggest that near-infrared spectroscopy of wide field –selected samples is necessary before the redshift distribution of such galaxies beyond can be reliably quantified.
4.2 Comparison with Semi-analytic Models
We now return to the primary aim of our comparison with model predictions, that of investigating the suggestion that EROs comprise a mixture of evolved and dusty galaxy populations.
We compare our ERO number counts with the predictions of the “reference model” from C00. This is a semi-analytic model which calculates the formation and evolution of galaxies in hierarchical clustering cosmologies, based on N-body simulations and simple parametrisation of physical processes. The model parameters are constrained by a number of local galaxy properties including the ratio of elliptical to spiral galaxies, the metallicity of local ellipticals, – and –band luminosity functions, the fraction of gas in spiral and irregular galaxies and the size of galaxy disks. C00 assume a Kennicutt (1993) IMF, however they find that the optical/near-infrared colours of galaxies are insensitive to this choice. They also include dust extinction using a Milky Way extinction curve, however as the authors point out, they do not allow for clumping of the dust and stars, nor do they include the effects of dust emission. We note that the model predicts a much weaker colour-magnitude correlation for cluster elliptical galaxies than that observed in the Coma cluster, the predicted colour of cluster ellipticals being 0.1–0.4 magnitudes bluer than the observations.
The surface density of EROs predicted by the C00 reference model is shown in Fig. 5 (Baugh, private communication). Despite its success in reproducing the properties of local galaxies, this model under-predicts the surface density of EROs with and 6.0 by approximately an order of magnitude. It would obviously be inappropriate to modify this model to fit the ERO number counts if in doing so, it no longer agreed with the local observational constraints mentioned above. Nevertheless, this disagreement with observations may point to important opportunities to improve our understanding of galaxy formation and hence improve C00’s semi-analytic model. We therefore briefly consider where these opportunities may lie.
As EROs appear to comprise galaxies containing both evolved and dust-reddened stellar populations (§1, §3.3 and §3.5), C00’s under-prediction of EROs suggests that their reference model contains insufficient old stars and/or dust at –2. It therefore appears that their reference model does not produce enough stars and/or dust at high-redshift (). One possible remedy would be to increase the fraction of stars formed in bursts, at the expense of quiescent star formation. This should reduce the level of ongoing star formation at (which would otherwise make these galaxies too blue to be classed as EROs). Another possible remedy would be to adopt a giant dominated IMF as this would increase the quantity of dust produced through the formation of a larger fraction of massive stars, thus both making starburst galaxies redder and allowing more systems to go through a starburst ERO phase without altering the properties of the local galaxy population with which the current model agrees. Introducing dust clumping may also provide a more realistic description of the spatial distribution of dust in starburst systems. These options should be considered in future revisions of the semi-analytic models.
Although the C00 reference model fails to reproduce the observed number of EROs, this model does provide a physically motivated framework to qualitatively interpret the relationship between the various classes of ERO. In the model the redshifts of galaxies predicted to have and are –2.5, equally split between the –1.5 and –2.5 bins. The lower redshift bin is dominated by passively evolving galaxies ( of the total) whose stars are sufficiently old to produce such red colours in the observed passbands, whilst the higher redshift bin is dominated by starburst galaxies ( of the total), whose colours are reddened by dust. A similar analysis of the predicted population reveals that almost all of these more extreme EROs are predicted to lie at –2.5, with of these galaxies being dusty starbursts. The C00 reference model therefore appears to qualitatively support the observational evidence (§3) for both a predominance of distant dusty starburst galaxies in the EROs, and passively evolving galaxies at producing the bulk of the –6.0 population.
We now return to the break in the number counts of EROs identified in §3. Whilst the normalisation of the semi-analytic predictions falls an order of magnitude short of our observations, the qualitative properties of the predicted ERO population offers a plausible explanation of the break in the count slopes. At magnitudes brighter than the break, the counts may be dominated by lower redshift (–1.5), predominantly passively evolving galaxies, whereas faint-ward of the break, the counts could be dominated by the distant (–2.5), dusty starburst galaxies. We therefore speculate that the break may be due to a transition from an ERO population dominated by evolved galaxies at () to one dominated by distant dusty starburst galaxies (that may have experienced a recent merger) at ().
4.3 Conclusions
We have undertaken a deep optical/near-infrared survey of 10 massive cluster lenses at using HST and UKIRT. We find 60 EROs with , of which 26 have in a total image plane survey area of 49 arcmin2 down to .
We use detailed models of the cluster lenses (S01) to quantify the lens amplification and thus correct the observed number counts for the effects of gravitational lensing. After making these corrections, we estimate a surface density of () arcmin-2 for EROs with () at . Our results agree with previous shallower wide-field surveys at and probe the number density of EROs with and 6.0 down to a source plane magnitude of .
The number counts of both classes of ERO flatten significantly at magnitudes fainter than –20. We speculate that this is due to a transition from an ERO population dominated by evolved galaxies at –2 (–20) to one dominated by distant dusty starburst galaxies at (–20). Analysis of the – and – planes also suggests that the population may contain a substantial fraction of dusty starburst galaxies.
Approximately 50% of our sample contain morphological substructure including disk-like, clumpy or interacting morphologies. This is a larger fraction than found by previous studies (e.g. Moriondo et al. 2000) which claimed that only 15–20% of EROs have such morphologies. The discrepancy may be due to a bias towards dense environments and the heterogeneity of Moriondo et al.’s dataset, compared with our unbiased and more homogeneous dataset.
We compare our observations with progressively more sophisticated models of galaxy formation, beginning with a two parameter ( and ) PLE model that attempts to describe EROs as a single population of elliptical galaxies (Daddi et al. 2000b). The model parameters which best match the observations are Gyr and , ruling out the very high formation redshifts () that were allowed by Daddi et al.’s (2000a) shallower observations. However, this single population model matches the EROs significantly worse than the EROs, supporting the idea that the more extreme population contains a large fraction of distant dusty starbursts in addition to the elliptical galaxies contained within this model.
We then compared our observations with PLE models that attempt to describe the whole galaxy population, and not just passive ellipticals (M00). These models under-predict the surface density of EROs by approximately an order of magnitude and predict none with . This deficit of EROs is probably caused by M00 requiring their model to fit the median redshift of Cowie et al.’s (1996) –selected redshift distribution. We suggest that this confirms Cowie et al.’s (1996) concern that their optical follow-up of a small-field –selected sample might be incomplete for the reddest (i.e. optically faintest – ) galaxies, and hence for galaxies at . It therefore appears that near-infrared spectroscopy of wide field –selected samples is necessary before the redshift distribution of galaxies at can be reliably quantified.
Finally, we compare the observed number density of EROs with the semi-analytic predictions from the reference model of C00. This semi-analytic model under-predicts the number density of EROs at –22 by an order of magnitude, indicating that the current generation of semi-analytic models may not produce sufficient stars and/or dust at high redshift (). However, as the C00 reference model is physically well motivated, we look at the predicted properties of the ERO population, finding that their redshift distribution and the split between passive and dusty EROs appear to support our interpretation of the break in the slope of the number counts.
This is the first survey to exploit massive foreground galaxy clusters to amplify the flux of background EROs. The sample constructed from our deep, high resolution – and –band observations is therefore ideally suited to near-infrared spectroscopic follow-up on 10–m class telescopes (e.g. Smith et al. 2001b), the lens amplification allowing us to probe magnitude beyond the normal reach of such observations. The primary goal of our future programme will be to probe the properties of EROs beyond the break in their number counts at –20 and to identify the cause of this feature.
Acknowledgements
We thank the referee, Alfonso Aragón-Salamanca for his careful reading of the manuscript and numerous thoughtful comments. We also thank Richard Ellis, Andy Fruchter, Richard Hook, Harald Kuntschner, Peder Norberg and Kevin Pimbblet for useful discussions and assistance at various stages of this project. We are also very grateful to Carlton Baugh, Shaun Cole, Emanuele Daddi, Nigel Metcalfe and Tom Shanks for providing the theoretical predictions discussed in this paper. Finally, we thank Andy Adamson, John Davies and Tom Kerr for support of the UKIRT observing programme and recovery observations.
GPS acknowledges a postgraduate studentship from PPARC. IRS acknowledges support from the Royal Society and the Leverhulme Trust. JPK acknowledges support from CNRS. OC acknowledges support from the European Commission under contract no. ER-BFM-BI-CT97-2471. HE acknowledges support by NASA and STScIgrants NAG 5–6336 and GO 5–08249. RJI acknowledges support from PPARC. We also acknowledge financial support from the UK–French ALLIANCE collaboration programme #00161XM
References
- [1] Altieri B., Metcalfe L., Kneib J.-P., McBreen B., Aussel H., Biviano A., Delaney M., Elbaz D., Leech K., Lémonon L., Okumura K., Pelló R., Shulz B., 1999, A&A, 343, L65
- [2] Aragón-Salamanca A., Ellis R.S., Schwartzenberg J.-M., Bergeron J.A., 1994, ApJ, 421, 27
- [3] Barger A.J., Cowie L.L., Trentham N., 1999, AJ, 117, 102
- [4] Barger A.J., Cowie L.L., Mushotzky R.F., Richards E.A., 2001, AJ, 121, 662
- [5] Baugh C.M., Cole S., Frenk C.S., 1996, MNRAS, 283, 1361
- [6] Beckwith S.V.W., Thompson D., Mannucci F., Djorgovski S.G., 1998, ApJ, 504, 107
- [7] Bershady M.A., Lowenthal J.D., Koo D.C., 1998, 505, 50
- [8] Bertin E., Arnouts S., 1996, A&A, 117, 393
- [9] Blain A.W., Kneib J.-P., Ivison R.J., Smail I., 1999, ApJ, 512, L87
- [10] Bolzonella M., Miralles J.-M., Pelló R., 2000, A&A, 363, 476
- [11] Bruzual G., Charlot S., 1993, ApJ, 405, 538
- [12] Casali M.M., Hawarden T.G., 1992, The JCMT-UKIRT Newsletter, 4, 35
- [13] Chapman S.C., McCarthy P.J., Persson S.E., 2000, AJ, 120, 1612
- [14] Cimatti A., Villani D., Pozzetti L., di Serego Alighieri S., 2000, MNRAS, 318, 453
- [15] Cole S., Lacey C.G., 1996, MNRAS, 281, 716
- [16] Cole S., Lacey C.G., Baugh C.M., Frenk C.S., 2000, MNRAS, 319, 204, (C00)
- [17] Cowie L.L., Gardiner J.P., Hu E.M., Songaila A., Hodapp K.-W., Wainscoat R.J., 1994, ApJ, 434, 114
- [18] Cowie L.L., Songaila A., Hu E.M., Cohen J.G., 1996, AJ, 112, 839
- [19] Cowie L.L., Barger A.J., Bautz M.W., Capak P., Crawford C.S., Fabian A.C., Hu E.M., Iwamuro F., Kneib J.-P., Maihara T., Motohara K., 2001, ApJL, 551, 9
- [20] Currie M., Wright G., Bridger A., Economou F., 1999, adass, 8, 175C
- [21] Czoske O., et al., 2001, in preparation
- [22] Daddi E., Cimatti A., Pozzetti L., Hoekstra H., Rottgering H.J.A., Renzini A., Zamorani G., Mannucci F., 2000a, A&A, 361, 535
- [23] Daddi E., Cimatti A., Renzini A., 2000b, A&A, 362, L45
- [24] Dey A., Spinrad H., Dickinson M., 1995, ApJ, 440, 515
- [25] Dey A., Graham J.R., Ivison R.J., Smail I., Wright G.S., Liu M.C., 1999, ApJ, 519, 610
- [26] Dunlop J., Peacock J., Spinrad H., Dey A., Jimenez R., Stern D., Windhorst R., 1996, Nature, 381, 581
- [27] Ebeling H., et al., 1996, MNRAS, 281, 799
- [28] Eggen O.J., Lynden-Bell D., Sandage A.R., 1962, ApJ, 136, 748
- [29] Eisenhardt P.R.M., Dickinson M., 1992, ApJ, 399, L47
- [30] Eisenhardt P.R.M., Elston R., Stanford S.A., Dickinson M., Spinrad H., Stern D., Dey A., 1998, in Proc. Xth Recontres de Blois, The Birth of Galaxies, ed. B. Guideroni, F.R. Bouchet, & T.X. Thuan (Paris: Editions Frontier̀es), in press
- [31] Elston R., Rieke G.H., Rieke M.J., 1988, ApJ, 331, L77
- [32] Elston R., Rieke G.H., Rieke M.J., 1991, in ASP Conf. Ser. 14, Astrophysics with Infrared Arrays, ed. R. Elston (San Fransisco: ASP), 3
- [33] Elston R., Rieke M.J., Rieke G.H., 1989, ApJ, 341, 80
- [34] Fontana A., Menci N., D’Odorico S., et al., 1999, MNRAS, 310, L27
- [35] Fruchter A.S., Hook R.N., 1997, in Applications of Digital Image Processing, Proc. SPIE, 3164, ed. Tescher A., p120
- [36] Gear W.K., Lilly S.J., Stevens J.A., Clements D.L., Webb T.M., Eales S.A., Dunne L., 2000, MNRAS, 316, 51
- [37] Graham J.R., et al., 1994, ApJ, 420, L5
- [38] Graham J.R., Dey A., 1996, ApJ, 471, 720
- [39] Holtzman J.A., Burrows C.J., Casertano S., Hester J.J., Trauger J.T., Watson A.M., Worthey G., 1995, PASP, 107, 1065
- [40] Hu E.M., Ridgway S.E., 1994, AJ, 107, 1303
- [41] Kauffmann G., White S.D.M., Guideroni B., 1993, MNRAS, 264, 201
- [42] Kauffmann G., Charlot S., White S.D.M., 1996, MNRAS, 283, 117
- [43] Kennicutt R.C., 1983, ApJ, 272, 54
- [44] Kneib J.-P., Ellis R.S., Smail I., Couch W.J., Sharples R.M., 1996, ApJ, 471, 643
- [45] Kron R.G., 1980, ApJS, 43, 305
- [46] Larson R.B., 1975, MNRAS, 173, 671
- [47] Liu M.C., Dey A., Graham J.R., Bundy K.A., Steidel C.S., Adelberger K., Dickinson M.E., 2000, AJ, 119, 2556
- [48] McCarthy P.J., Persson S.E., West S.C., 1992, ApJ, 386, 52
- [49] McCracken H.J., Metcalfe N., Shanks T., et al., 2000, MNRAS, 311, 707, (M00)
- [50] Madau P., Ferguson H.C., Dickinson M., Giavalisco M., Steidel C.C., Fruchter A., 1996, ApJ., 283, 1388
- [51] Menanteau F., Ellis R.S., Abraham R.G., Barger A.J., Cowie L.L., 1999, 309, 208
- [52] Moriondo G., Cimatti A., Daddi E., 2000, A& A, 364, 26
- [53] Moustakas L.A., Davis, M., Graham J.R., et al., 1997, ApJ, 475, 445
- [54] Packham C., et al., 2001, in preparation
- [55] Peebles P.J.E., 1984, ApJ, 284, 439
- [56] Persson S.E., Murphy W., Krzeminski W., Roth M., Rieke M.J., 1998, AJ, 116, 2475
- [57] Petrosian V., 1976, ApJ, 209, L1
- [58] Pozzetti L., Mannucci F., 2000, MNRAS, 317 L17
- [59] Salpeter E.E., 1995, ApJ, 121, 161
- [60] Saracco P., D’Odorico S., Moorwood A., Buzzoni A., Cuby J.-G., Lidman C., 1999, 349, 751
- [61] Schlegel D.J., Finkbeiner D.P., Davis M., 1998, ApJ, 500, 525
- [62] Smail I., Ivison R.J., Blain A.W., 1997, ApJ, 490, 5
- [63] Smail I., Edge A.C., Ellis R.S., Blandford R.D., 1998, MNRAS, 293, 124
- [64] Smail I., Ivison R.J., Kneib J.-P., Cowie L.L., Blain A.W., Barger A.J., Owen F.N., Morrison G., 1999a, MNRAS, 308, 1061
- [65] Smail I., Morrison G., Gray, M.E., Owen F.N., Ivison R.J., Kneib J.-P., Ellis, R.S., 1999b, ApJ, 525, 609
- [66] Smail I., Ivison R.J., Owen F.N., Blain A.W., Kneib J.-P., 2000 ApJ, 528, 612
- [67] Smail I., Ivison R.J., Blain A.W., Kneib J.-P., 2001a, MNRAS, submitted
- [68] Smail I., Kuntschner H., Kodama T., Smith G.P., Packham C., Fruchter A.S., Hook R.N., 2001b, MNRAS, 323, 839
- [69] Smith G.P., Kneib J.-P., Ebeling H., Czoske O., Smail I., 2001a, ApJ, 552, 493
- [70] Smith G.P., Treu T., Ellis R.S., Smail I., Kenib J.-P., Frye B.L., 2001b, ApJ, in press (astro-ph/0108039)
- [71] Smith G.P., et al., 2001c, in preparation, (S01)
- [72] Soifer B.T., Matthews K., Neugebauer G., Armus L., Cohen J.G., Persson S.E., Smail I., 1999, AJ, 118, 2065
- [73] Spinrad H., Dey A., Stern D., et al., 197, ApJ, 484, 581
- [74] Stanford S.A., Elston R., Eisenhardt P.R., Spinrad H., Sterm D., Dey A., 1997, AJ, 114, 2232S
- [75] Thompson D., Beckwith S.V.W., Fockenbrock R., Fried J., Hippelein H., Huang J.-S., von Kuhlmann B., Leinhert C., Meisenheimer K., Phleps S., Roeser H.-J., Thommes E., Wolf C., 1999, ApJ, 523, 100
- [76] Tinsley B.M., Gunn J.E., 1976, ApJ, 203, 52
- [77] Treu T., Stiavelli M., 1999, ApJ, 524, L27
- [78] White S.D.M., Frenk C.S., 1991, ApJ, 379, 52
- [79] Willott C.J., Rawlings S., Blundell K.M., 2000, MNRAS submitted (astro-ph/0011082)
- [80] Yamada T., Tanaka I., Aragón-Salamanca A., Kodama T., Ohta K., Arimoto N., 1997, ApJ, 487, L125
- [81] Ziegler B.L., Bower R.G., Smail I., Davies R.L., Lee, D., 2001, MNRAS, 325, 1572
| Source | , | FWHM | Morphology | ||||
|---|---|---|---|---|---|---|---|
| (J2000) | (′′) | (a) | |||||
| A 68 | |||||||
| ERO J003703+0909.7 | 00 37 03.30 09 09 44.4 | F | |||||
| ERO J003706+0909.1 | 00 37 06.10 09 09 08.7 | I, §3.6 | |||||
| ERO J003707+0909.4 | 00 37 07.25 09 09 23.8 | I, §3.6 | |||||
| ERO J003707+0909.5 | 00 37 07.37 09 09 28.4 | I, §3.6 | |||||
| ERO J003709+0909.6 | 00 37 08.84 09 09 37.0 | F | |||||
| ERO J003709+0911.0 | 00 37 09.03 09 11 01.8 | I, Clumpy | |||||
| ERO J003710+0908.9 | 00 37 09.57 09 08 53.4 | I | |||||
| ERO J003710+0909.1 | 00 37 09.58 09 09 08.4 | I, Disk? | |||||
| ERO J003711+0908.8 | 00 37 10.53 09 08 46.8 | F | |||||
| ERO J003711+0909.1 | 00 37 10.91 09 09 09.8 | F | |||||
| ERO J003711+0909.2 | 00 37 11.00 09 09 10.1 | F | |||||
| A 209 | |||||||
| ERO J0131511335.5 | 01 31 50.78 13 35 31.0 | … | C | ||||
| ERO J0131531335.4 | 01 31 52.82 13 35 22.8 | … | I, Clumpy | ||||
| ERO J0131541336.3 | 01 31 54.14 13 36 19.9 | … | F | ||||
| ERO J0131571336.6 | 01 31 56.98 13 36 37.5 | … | I | ||||
| ERO J0131591336.2 | 01 31 58.60 13 36 15.4 | … | C | ||||
| ERO J0131591336.3 | 01 31 59.36 13 36 16.4 | … | I, Disk | ||||
| ERO J0132001336.5 | 01 31 59.66 13 36 28.4 | … | F | ||||
| A 267 | |||||||
| ERO J015238+0101.0 | 01 52 38.43 01 02 02.8 | I, Disk? | |||||
| ERO J015238+0101.9 | 01 52 37.60 01 01 51.6 | C | |||||
| ERO J015240+0101.2 | 01 52 40.08 01 01 08.8 | C | |||||
| ERO J015240+0101.6 | 01 52 39.55 01 00 38.4 | F | |||||
| ERO J015240+0101.7 | 01 52 39.88 01 01 39.3 | C | |||||
| ERO J015240+0101.8 | 01 52 39.82 01 01 50.0 | F | |||||
| ERO J015241+0101.1 | 01 52 41.25 01 02 07.4 | F | |||||
| ERO J015243+0101.5 | 01 52 42.80 01 01 27.0 | C | |||||
| ERO J015245+0101.8 | 01 52 44.53 01 00 47.9 | F | |||||
| ERO J015247+0101.1 | 01 52 47.28 01 01 04.8 | I | |||||
| ERO J015249+0100.6 | 01 52 48.93 01 00 38.1 | F | |||||
| ERO J015249+0101.6 | 01 52 49.10 01 00 36.8 | F | |||||
| A 383 | |||||||
| ERO J0248040332.1 | 02 48 04.12 03 32 06.4 | … | C, §3.6 | ||||
| ERO J0248050330.0 | 02 48 04.55 03 29 57.3 | … | I | ||||
| ERO J0248050330.2 | 02 48 04.56 03 30 11.0 | … | C, Star? | ||||
| ERO J0248050330.3 | 02 48 04.82 03 30 18.0 | … | I | ||||
| ERO J0248050330.3 | 02 48 04.90 03 30 22.7 | … | C | ||||
| ERO J0248050330.4 | 02 48 04.89 03 30 24.7 | … | I | ||||
| ERO J0248060331.5 | 02 48 06.44 03 31 27.3 | … | I | ||||
| ERO J0248080331.8 | 02 48 07.99 03 31 47.5 | … | I | ||||
| ERO J0248090332.9 | 02 48 08.79 03 32 56.4 | … | F | ||||
| ERO J0248090333.0 | 02 48 08.58 03 33 00.0 | … | I, Merging? | ||||
| ERO J0248100332.4 | 02 48 10.02 03 32 25.8 | … | I | ||||
| A 773 | |||||||
| ERO J091802+5143.1 | 09 18 02.50 51 43 06.4 | I, Disk | |||||
| A 963 | |||||||
| ERO J101701+3903.4 | 10 17 01.42 39 03 24.6 | I | |||||
| ERO J101703+3903.4 | 10 17 02.52 39 03 22.0 | F | |||||
| ERO J101706+3901.7 | 10 17 05.69 39 01 41.6 | F | |||||
| ERO J101706+3902.0 | 10 17 05.79 39 02 02.3 | F | |||||
| ERO J101707+3901.4 | 10 17 06.61 39 01 22.1 | I | |||||
| ERO J101707+3902.1 | 10 17 06.58 39 02 08.3 | I, Clumpy | |||||
| ERO J101707+3902.4 | 10 17 07.09 39 02 25.0 | I | |||||
(a) “C”, Compact; “I”, Irregular; “F”, Faint morphological classification, as discussed in §3.
| Source | , | FWHM | Morphology | ||||
|---|---|---|---|---|---|---|---|
| (J2000) | (′′) | (a) | |||||
| A 963 (continued) | |||||||
| ERO J101707+3902.9 | 10 17 07.43 39 02 52.2 | I, Disk? | |||||
| ERO J101709+3903.5 | 10 17 09.30 39 03 31.4 | C | |||||
| ERO J101710+3902.2 | 10 17 09.66 39 02 10.0 | I | |||||
| ERO J101710+3903.0 | 10 17 09.61 39 03 03.6 | I | |||||
| ERO J101710+3903.4 | 10 17 09.94 39 03 23.3 | F | |||||
| A 1763 | |||||||
| ERO J133511+4100.3 | 13 35 11.46 41 00 15.5 | … | I | ||||
| ERO J133517+4058.7 | 13 35 16.77 40 58 43.0 | I | |||||
| ERO J133518+4058.8 | 13 35 17.82 40 58 45.9 | I | |||||
| ERO J133518+4059.4 | 13 35 18.30 40 59 25.8 | I | |||||
| ERO J133521+4100.4 | 13 35 21.16 41 00 24.4 | F, §3.6 | |||||
| A 1835 | |||||||
| ERO J140057+0252.4 | 14 00 57.13 02 52 26.4 | C | |||||
| A 2219 | |||||||
| ERO J164023+4644.0 | 16 40 23.05 46 44 02.3 | I, Disk | |||||
| ERO J164024+4643.7 | 16 40 23.95 46 43 42.1 | I | |||||
(a) “C”, Compact; “I”, Irregular; “F”, Faint morphological classification, as discussed in §3.